Information Governance in Social Business Market Analysis North America, Europe, APAC, South America, Middle East and Africa - US, China, Japan, Germany, UK - Size and Forecast 2024-2028

Information Governance in Social Business Market Analysis North America, Europe, APAC, South America, Middle East and Africa - US, China, Japan, Germany, UK - Size and Forecast 2024-2028

Published: Apr 2024 168 Pages SKU: IRTNTR77888

Market Overview at a Glance

$6.78 B
Market Opportunity
13.5%
CAGR
13.16
YoY growth 2023-2024(%)

Information Governance in Social Business Market Size 2024-2028

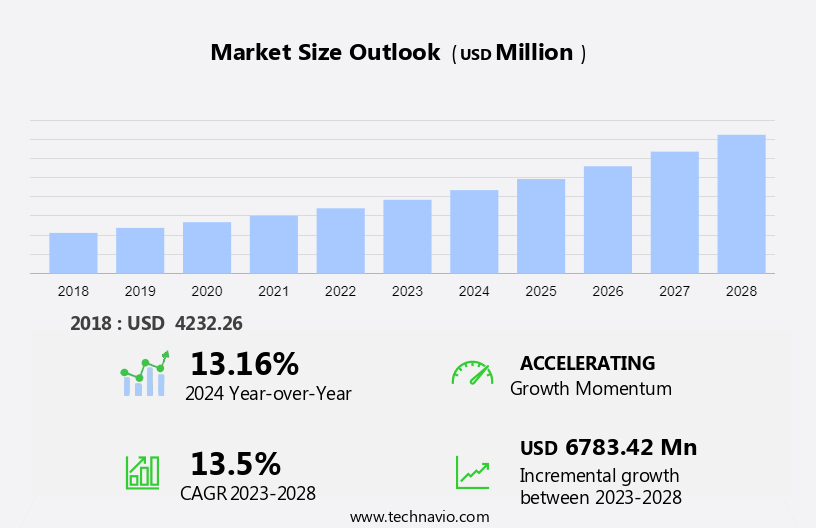
The information governance in social business market size is forecast to increase by USD 6.78 billion, at a CAGR of 13.5% between 2023 and 2028.

  • Information governance in social business is a critical area of focus for organizations as they increasingly leverage social media platforms for customer engagement and business operations. The market is driven by several trends and challenges. Rising regulatory compliance requirements related to data privacy and data security are pushing businesses to implement strong information governance frameworks. The expanding digital transformation landscape, with the proliferation of big data and cloud computing, is creating new challenges. Integration and interoperability issues between various social media platforms and enterprise systems further complicate information governance efforts.
  • To effectively manage information in the social business context, organizations need to adopt a holistic approach that addresses these trends and challenges. This includes implementing policies and technologies for data classification, access control, and data retention, as well as investing in training and education for employees on social media best practices and information security. By doing so, businesses can mitigate risks, improve compliance, and enhance their ability to derive value from social data.

What will be the Size of the Market During the Forecast Period?

Information Governance in Social Business Market Size

 Request Free Sample

  • The social business market, fueled by the increasing integration of social media platforms into business operations, has experienced significant growth. Information governance solutions have emerged as a crucial component in this landscape, addressing the unique challenges posed by data processing in social media environments. Market participants, including trading enterprises and financial institutions, prioritize operational transparency and legal compliance In their social business strategies. Technological innovation continues to drive performance optimization, enabling real-time data analytics and policy enforcement. Employees engage in various forms of data processing through microblogs, forums, and other social tools, necessitating strong information governance frameworks.
  • Sensitive information sharing and customer interaction further accentuate the importance of data and information policies and procedures. As businesses strive for carbon neutrality and marketing tool efficiency, the role of information governance in social business continues to evolve, shaping the market's direction. Switching costs associated with implementing new software remain a consideration, but the benefits of effective information governance far outweigh the initial investment.

How is this Information Governance in Social Business Industry segmented and which is the largest segment?

The market research report provides comprehensive data (region-wise segment analysis), with forecasts and estimates in "USD million" for the period 2024-2028, as well as historical data from 2018-2022 for the following segments.

  • Product
    • Software
    • Services
  • End-user
    • Large enterprises
    • SMEs
  • Geography
    • North America
      • US
    • Europe
      • Germany
      • UK
    • APAC
      • China
      • Japan
    • South America
    • Middle East and Africa

By Product Insights

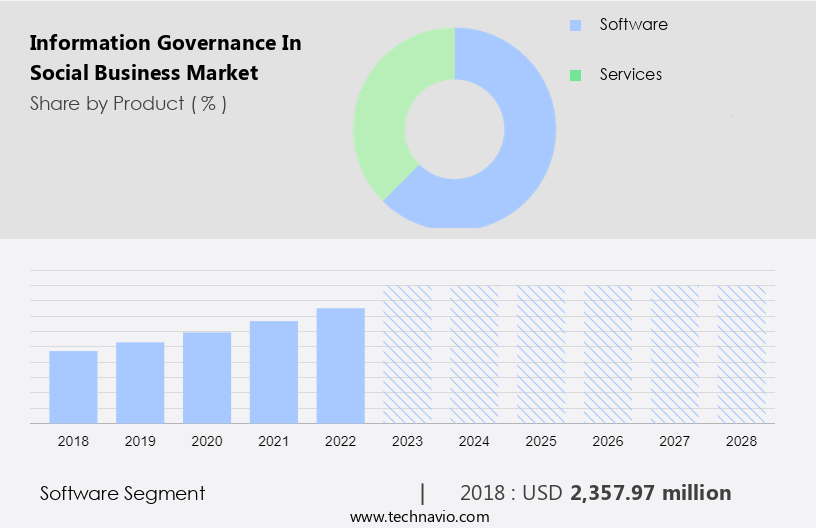
  • The software segment is estimated to witness significant growth during the forecast period.

The markets is essential for managing data efficiently and ensuring compliance across various platforms and geographies. Software solutions are a critical component of this market, offering comprehensive features to address data privacy, security, regulatory standards, and risk management. IBM Corp. Is a notable company in this sector, providing offerings such as IBM Information Governance Catalog and IBM DataStage. These platforms enable businesses to gain insights into their data landscapes, maintain regulatory compliance, and mitigate risks associated with data misuse or unauthorized access. Other market participants focus on geographical expansions, technological advancements, and strategic collaborations to drive growth in this market. Key areas of focus include performance optimization, carbon neutrality, and customer interaction through social media platforms like microblogs and forums. Information governance solutions are integral to managing sensitive information, data analytics, and cloud-based solutions in this dynamic business environment.

Information Governance in Social Business Market Size

Get a glance at the Industry report of share of various segments Request Free Sample

The software segment was valued at USD 2.36 billion in 2018 and showed a gradual increase during the forecast period.

Regional Analysis

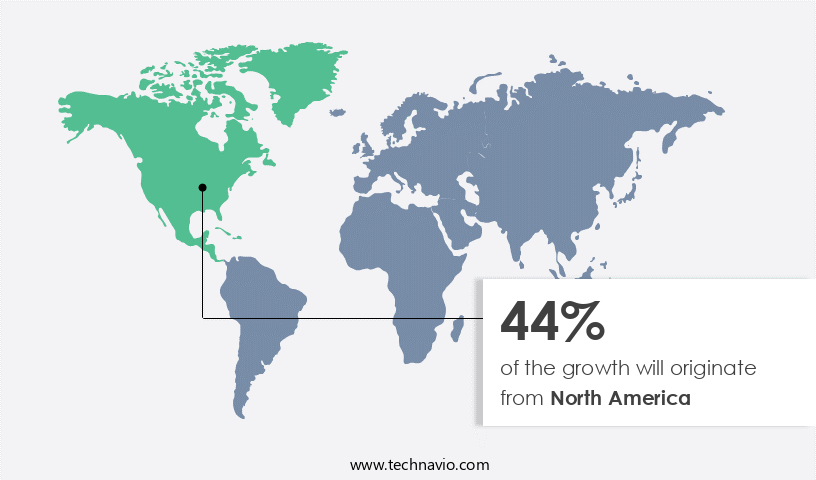
  • North America is estimated to contribute 44% to the growth of the global market during the forecast period.

Technavio's analysts have elaborately explained the regional trends and drivers that shape the market during the forecast period.

Information Governance in Social Business Market Share by Geography

For more insights on the market share of various regions, Request Free Sample

The North American market is projected to expand due to the region's technological advancements and widespread adoption of social media platforms by enterprises. The US and Canada are at the forefront of social media usage, creating a significant demand for advanced information governance solutions. companies are responding to this trend by offering sophisticated tools to help businesses manage sensitive information shared on social media. Additionally, enterprises are recognizing the importance of information governance in social business as a critical channel for customer interaction. As a result, the market is poised for growth during the forecast period. This expansion is further driven by geographical expansions, technological advancements, and the evolving technology ecosystem. Key performance indicators include operational transparency, data processing, data analytics, and carbon neutrality. Information governance solutions are essential for ensuring legal compliance, protecting data and information, and optimizing performance. Cloud-based solutions and data analytics are expected to play a significant role In the market's development.

Market Dynamics

Our researchers analyzed the data with 2023 as the base year, along with the key drivers, trends, and challenges. A holistic analysis of drivers will help companies refine their marketing strategies to gain a competitive advantage.

What are the key market drivers leading to the rise In the adoption of Information Governance in Social Business Industry?

Rising regulatory compliance requirements related to the market is the key driver of the market.

  • The market is experiencing significant growth due to increasing legal compliance requirements. Governments worldwide are implementing stringent data protection regulations to safeguard individuals' privacy rights and mitigate risks associated with the misuse of personal data on social media platforms. For instance, the European Union's GDPR, which came into effect in 2018, mandates strict guidelines for the collection, processing, and storage of personal data by businesses. Failure to comply with these regulations can result in hefty fines, leading organizations to prioritize information governance strategies. Moreover, technological innovation, operational transparency, and performance optimization are key factors driving the market.
  • Cloud-based information governance solutions, data analytics, and technological advancements are enabling businesses to manage and protect their data and information more effectively. Additionally, social media platforms are increasingly becoming essential marketing tools for businesses, necessitating the need for strong information governance policies and procedures to manage customer interaction and sensitive information. Carbon neutrality is also a growing concern for market participants, and information governance solutions are playing a crucial role in reducing the carbon footprint of businesses by optimizing data processing and reducing the need for physical storage. The market is witnessing significant strategic developments, including new product launches, mergers and acquisitions, agreements, collaborations, and joint ventures, as businesses seek to expand their geographical reach and production capabilities.

What are the market trends shaping the Information Governance in Social Business Industry?

Expanding digital transformation landscape is the upcoming market trend.

  • The digital transformation landscape's expansion is fueling the growth of the market. As organizations integrate social media platforms into their business strategies, they face the challenge of managing and securing data generated through these channels. Compliance with legal requirements and operational transparency are paramount in social business environments. Leading market participants provide information governance solutions to help organizations address these challenges.
  • These solutions offer frameworks for managing data processing, technological innovation, performance optimization, carbon neutrality, and sensitive information in social media contexts. Data analytics and cloud-based solutions are integral components of these offerings. The information governance market dynamics include geographical expansions, strategic developments, new product launches, mergers and acquisitions, agreements, collaborations, and joint ventures. 

What challenges does the Information Governance in Social Business Industry face during its growth?

Integration and interoperability issues related to information governance in social business is a key challenge affecting the industry growth.

  • Information governance in social business is a critical aspect of managing data and information In the digital age. Developing effective information governance plans is essential for ensuring legal compliance and operational transparency in social media interactions. However, integrating information governance solutions with various social media platforms and technological innovations poses challenges. The lack of standardization and compatibility between different systems and data formats is a significant barrier. Social media platforms often employ proprietary APIs and data structures, making it difficult to establish seamless connectivity and data exchange. This complexity can hinder performance optimization and carbon neutrality efforts. Moreover, as businesses expand their social media presence and explore new product launches, M&A, agreements, collaborations, joint ventures, and geographical expansions, the need for information governance solutions becomes increasingly important.
  • In the ever-evolving technology ecosystem, staying up-to-date with the latest statistics, guidance, and direction is vital for making informed investment decisions and overcoming business market obstacles. Data analytics plays a crucial role in optimizing social business strategies and understanding supply chain dynamics, production costs, and raw materials. Cloud-based solutions offer a cost-effective and scalable alternative to traditional on-premises systems. By implementing strong information governance policies and procedures, businesses can mitigate risks associated with sensitive information and ensure effective customer interaction through microblogs, forums, and other marketing channels.

Exclusive Customer Landscape

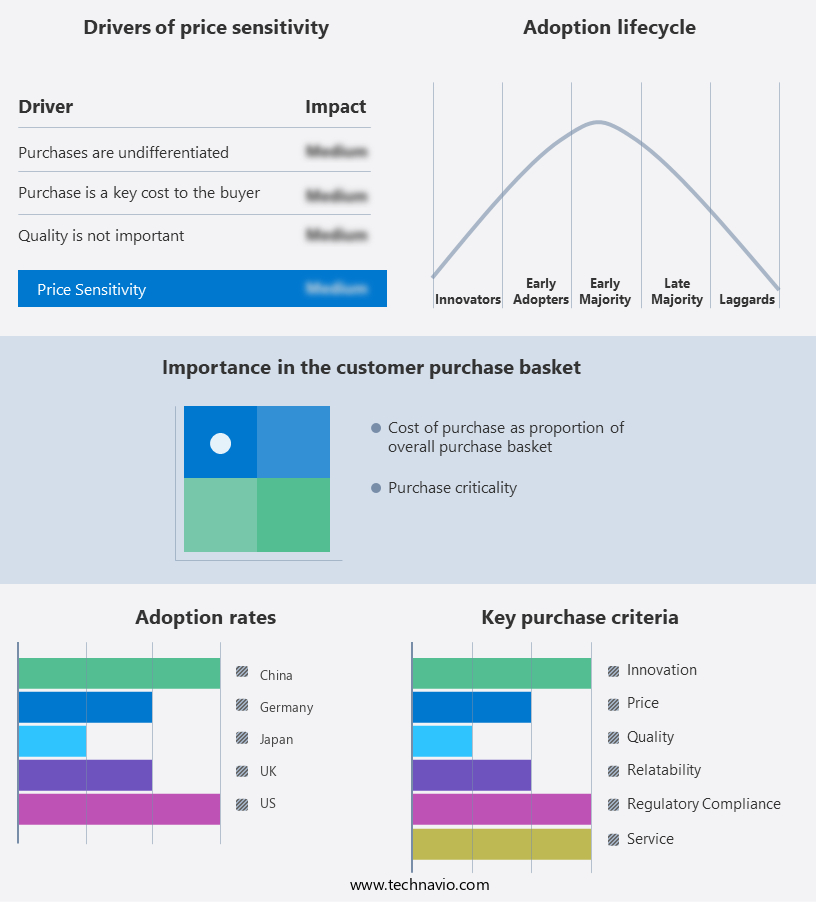
The market forecasting report includes the adoption lifecycle of the market, covering from the innovator's stage to the laggard's stage. It focuses on adoption rates in different regions based on penetration. Furthermore, the market report also includes key purchase criteria and drivers of price sensitivity to help companies evaluate and develop their market growth analysis strategies.

Information Governance in Social Business Market Share by Geography

 Customer Landscape

Key Companies & Market Insights

Companies are implementing various strategies, such as strategic alliances, market forecast, partnerships, mergers and acquisitions, geographical expansion, and product/service launches, to enhance their presence In the industry.

The industry research and growth report includes detailed analyses of the competitive landscape of the market and information about key companies, including:

  • Accenture Plc
  • Exterro Inc.
  • Flatworld Solutions Pvt. Ltd.
  • FTI Consulting Inc.
  • Gimmal
  • Informatica Inc.
  • International Business Machines Corp.
  • Iron Mountain Inc.
  • Kroll LLC
  • Kyocera Corp.
  • MetricStream Inc.
  • Mitratech Inc.
  • Open Text Corp.
  • Oracle Corp.
  • Salesforce Inc.
  • Spirion LLC
  • Sprout Social Inc.
  • Talkwalker Sarl
  • Veritas Technologies LLC

Qualitative and quantitative analysis of companies has been conducted to help clients understand the wider business environment as well as the strengths and weaknesses of key industry players. Data is qualitatively analyzed to categorize companies as pure play, category-focused, industry-focused, and diversified; it is quantitatively analyzed to categorize companies as dominant, leading, strong, tentative, and weak.

Research Analyst Overview

In the dynamic and evolving landscape of social business, the importance of information governance has emerged as a critical factor for market participants. As businesses increasingly leverage social media platforms for customer interaction and operational transparency, the management of data and information becomes a key component of business strategies. A strong information governance framework is essential for ensuring legal compliance and operational efficiency. Employees must be trained to handle data processing in accordance with established policies and procedures. Technological innovation plays a significant role in performance optimization, with cloud-based solutions and data analytics becoming increasingly prevalent. Carbon neutrality is another consideration for social businesses, as they seek to reduce their environmental footprint and enhance their corporate social responsibility.

Social media microblogs and forums provide valuable opportunities for community engagement and customer feedback, but also pose challenges in managing sensitive information. Market participants in various industries, including trading enterprises, financial institutions, community organizations, non-government organizations, and charities, are all grappling with the complexities of information governance in social business. Geographical expansions and technological advancements continue to shape the technology ecosystem, presenting both opportunities and challenges. According to statistics, the global market is expected to experience significant growth In the coming years. This growth is driven by the increasing adoption of social media platforms for business purposes and the need for guidance and direction in managing the resulting data and information.

Also, marketing channels are evolving, with marketing tools becoming more sophisticated and switching costs decreasing. New product launches, mergers and acquisitions, agreements, collaborations, and joint ventures are all strategic developments shaping the market. Despite these opportunities, there are also obstacles to overcome. Production costs and supply chain dynamics, for example, can impact the feasibility of investment projects. Raw materials and resource availability are also critical factors.

Market Scope

Report Coverage

Details

Page number

168

Base year

2023

Historic period

2018-2022

Forecast period

2024-2028

Growth momentum & CAGR

Accelerate at a CAGR of 13.5%

Market growth 2024-2028

USD 6.78 billion

Market structure

Fragmented

YoY growth 2023-2024(%)

13.16

Key countries

US, China, Japan, Germany, and UK

Competitive landscape

Leading Companies, Market Positioning of Companies, Competitive Strategies, and Industry Risks

Request Free Sample

What are the Key Data Covered in this Market Research and Growth Report?

  • CAGR of the industry during the forecast period
  • Detailed information on factors that will drive the growth and forecasting between 2024 and 2028
  • Precise estimation of the size of the market and its contribution of the industry in focus to the parent market
  • Accurate predictions about upcoming growth and trends and changes in consumer behaviour
  • Growth of the market across North America, Europe, APAC, South America, and Middle East and Africa
  • Thorough analysis of the market's competitive landscape and detailed information about companies
  • Comprehensive analysis of factors that will challenge the market growth of industry companies

We can help! Our analysts can customize this market research report to meet your requirements.

Get in touch

1 Executive Summary

  • 1.1 Market overview
    • Exhibit 01: Executive Summary – Chart on Market Overview
    • Exhibit 02: Executive Summary – Data Table on Market Overview
    • Exhibit 03: Executive Summary – Chart on Global Market Characteristics
    • Exhibit 04: Executive Summary – Chart on Market by Geography
    • Exhibit 05: Executive Summary – Chart on Market Segmentation by Product
    • Exhibit 06: Executive Summary – Chart on Market Segmentation by End-user
    • Exhibit 07: Executive Summary – Chart on Incremental Growth
    • Exhibit 08: Executive Summary – Data Table on Incremental Growth
    • Exhibit 09: Executive Summary – Chart on Vendor Market Positioning

2 Market Landscape

  • 2.1 Market ecosystem
    • Exhibit 10: Parent market
    • Exhibit 11: Market Characteristics

3 Market Sizing

  • 3.1 Market definition
    • Exhibit 12: Offerings of vendors included in the market definition
  • 3.2 Market segment analysis
    • Exhibit 13: Market segments
  • 3.3 Market size 2023
    • 3.4 Market outlook: Forecast for 2023-2028
      • Exhibit 14: Chart on Global - Market size and forecast 2023-2028 ($ million)
      • Exhibit 15: Data Table on Global - Market size and forecast 2023-2028 ($ million)
      • Exhibit 16: Chart on Global Market: Year-over-year growth 2023-2028 (%)
      • Exhibit 17: Data Table on Global Market: Year-over-year growth 2023-2028 (%)

    4 Historic Market Size

    • 4.1 Global information governance in social business market 2018 - 2022
      • Exhibit 18: Historic Market Size – Data Table on global information governance in social business market 2018 - 2022 ($ million)
    • 4.2 Product Segment Analysis 2018 - 2022
      • Exhibit 19: Historic Market Size – Product Segment 2018 - 2022 ($ million)
    • 4.3 End-user Segment Analysis 2018 - 2022
      • Exhibit 20: Historic Market Size – End-user Segment 2018 - 2022 ($ million)
    • 4.4 Geography Segment Analysis 2018 - 2022
      • Exhibit 21: Historic Market Size – Geography Segment 2018 - 2022 ($ million)
    • 4.5 Country Segment Analysis 2018 - 2022
      • Exhibit 22: Historic Market Size – Country Segment 2018 - 2022 ($ million)

    5 Five Forces Analysis

    • 5.1 Five forces summary
      • Exhibit 23: Five forces analysis - Comparison between 2023 and 2028
    • 5.2 Bargaining power of buyers
      • Exhibit 24: Chart on Bargaining power of buyers – Impact of key factors 2023 and 2028
    • 5.3 Bargaining power of suppliers
      • Exhibit 25: Bargaining power of suppliers – Impact of key factors in 2023 and 2028
    • 5.4 Threat of new entrants
      • Exhibit 26: Threat of new entrants – Impact of key factors in 2023 and 2028
    • 5.5 Threat of substitutes
      • Exhibit 27: Threat of substitutes – Impact of key factors in 2023 and 2028
    • 5.6 Threat of rivalry
      • Exhibit 28: Threat of rivalry – Impact of key factors in 2023 and 2028
    • 5.7 Market condition
      • Exhibit 29: Chart on Market condition - Five forces 2023 and 2028

    6 Market Segmentation by Product

    • 6.1 Market segments
      • Exhibit 30: Chart on Product - Market share 2023-2028 (%)
      • Exhibit 31: Data Table on Product - Market share 2023-2028 (%)
    • 6.2 Comparison by Product
      • Exhibit 32: Chart on Comparison by Product
      • Exhibit 33: Data Table on Comparison by Product
    • 6.3 Software - Market size and forecast 2023-2028
      • Exhibit 34: Chart on Software - Market size and forecast 2023-2028 ($ million)
      • Exhibit 35: Data Table on Software - Market size and forecast 2023-2028 ($ million)
      • Exhibit 36: Chart on Software - Year-over-year growth 2023-2028 (%)
      • Exhibit 37: Data Table on Software - Year-over-year growth 2023-2028 (%)
    • 6.4 Services - Market size and forecast 2023-2028
      • Exhibit 38: Chart on Services - Market size and forecast 2023-2028 ($ million)
      • Exhibit 39: Data Table on Services - Market size and forecast 2023-2028 ($ million)
      • Exhibit 40: Chart on Services - Year-over-year growth 2023-2028 (%)
      • Exhibit 41: Data Table on Services - Year-over-year growth 2023-2028 (%)
    • 6.5 Market opportunity by Product
      • Exhibit 42: Market opportunity by Product ($ million)
      • Exhibit 43: Data Table on Market opportunity by Product ($ million)

    7 Market Segmentation by End-user

    • 7.1 Market segments
      • Exhibit 44: Chart on End-user - Market share 2023-2028 (%)
      • Exhibit 45: Data Table on End-user - Market share 2023-2028 (%)
    • 7.2 Comparison by End-user
      • Exhibit 46: Chart on Comparison by End-user
      • Exhibit 47: Data Table on Comparison by End-user
    • 7.3 Large enterprises - Market size and forecast 2023-2028
      • Exhibit 48: Chart on Large enterprises - Market size and forecast 2023-2028 ($ million)
      • Exhibit 49: Data Table on Large enterprises - Market size and forecast 2023-2028 ($ million)
      • Exhibit 50: Chart on Large enterprises - Year-over-year growth 2023-2028 (%)
      • Exhibit 51: Data Table on Large enterprises - Year-over-year growth 2023-2028 (%)
    • 7.4 SMEs - Market size and forecast 2023-2028
      • Exhibit 52: Chart on SMEs - Market size and forecast 2023-2028 ($ million)
      • Exhibit 53: Data Table on SMEs - Market size and forecast 2023-2028 ($ million)
      • Exhibit 54: Chart on SMEs - Year-over-year growth 2023-2028 (%)
      • Exhibit 55: Data Table on SMEs - Year-over-year growth 2023-2028 (%)
    • 7.5 Market opportunity by End-user
      • Exhibit 56: Market opportunity by End-user ($ million)
      • Exhibit 57: Data Table on Market opportunity by End-user ($ million)

    8 Customer Landscape

    • 8.1 Customer landscape overview
      • Exhibit 58: Analysis of price sensitivity, lifecycle, customer purchase basket, adoption rates, and purchase criteria

    9 Geographic Landscape

    • 9.1 Geographic segmentation
      • Exhibit 59: Chart on Market share by geography 2023-2028 (%)
      • Exhibit 60: Data Table on Market share by geography 2023-2028 (%)
    • 9.2 Geographic comparison
      • Exhibit 61: Chart on Geographic comparison
      • Exhibit 62: Data Table on Geographic comparison
    • 9.3 North America - Market size and forecast 2023-2028
      • Exhibit 63: Chart on North America - Market size and forecast 2023-2028 ($ million)
      • Exhibit 64: Data Table on North America - Market size and forecast 2023-2028 ($ million)
      • Exhibit 65: Chart on North America - Year-over-year growth 2023-2028 (%)
      • Exhibit 66: Data Table on North America - Year-over-year growth 2023-2028 (%)
    • 9.4 Europe - Market size and forecast 2023-2028
      • Exhibit 67: Chart on Europe - Market size and forecast 2023-2028 ($ million)
      • Exhibit 68: Data Table on Europe - Market size and forecast 2023-2028 ($ million)
      • Exhibit 69: Chart on Europe - Year-over-year growth 2023-2028 (%)
      • Exhibit 70: Data Table on Europe - Year-over-year growth 2023-2028 (%)
    • 9.5 APAC - Market size and forecast 2023-2028
      • Exhibit 71: Chart on APAC - Market size and forecast 2023-2028 ($ million)
      • Exhibit 72: Data Table on APAC - Market size and forecast 2023-2028 ($ million)
      • Exhibit 73: Chart on APAC - Year-over-year growth 2023-2028 (%)
      • Exhibit 74: Data Table on APAC - Year-over-year growth 2023-2028 (%)
    • 9.6 South America - Market size and forecast 2023-2028
      • Exhibit 75: Chart on South America - Market size and forecast 2023-2028 ($ million)
      • Exhibit 76: Data Table on South America - Market size and forecast 2023-2028 ($ million)
      • Exhibit 77: Chart on South America - Year-over-year growth 2023-2028 (%)
      • Exhibit 78: Data Table on South America - Year-over-year growth 2023-2028 (%)
    • 9.7 Middle East and Africa - Market size and forecast 2023-2028
      • Exhibit 79: Chart on Middle East and Africa - Market size and forecast 2023-2028 ($ million)
      • Exhibit 80: Data Table on Middle East and Africa - Market size and forecast 2023-2028 ($ million)
      • Exhibit 81: Chart on Middle East and Africa - Year-over-year growth 2023-2028 (%)
      • Exhibit 82: Data Table on Middle East and Africa - Year-over-year growth 2023-2028 (%)
    • 9.8 US - Market size and forecast 2023-2028
      • Exhibit 83: Chart on US - Market size and forecast 2023-2028 ($ million)
      • Exhibit 84: Data Table on US - Market size and forecast 2023-2028 ($ million)
      • Exhibit 85: Chart on US - Year-over-year growth 2023-2028 (%)
      • Exhibit 86: Data Table on US - Year-over-year growth 2023-2028 (%)
    • 9.9 China - Market size and forecast 2023-2028
      • Exhibit 87: Chart on China - Market size and forecast 2023-2028 ($ million)
      • Exhibit 88: Data Table on China - Market size and forecast 2023-2028 ($ million)
      • Exhibit 89: Chart on China - Year-over-year growth 2023-2028 (%)
      • Exhibit 90: Data Table on China - Year-over-year growth 2023-2028 (%)
    • 9.10 Germany - Market size and forecast 2023-2028
      • Exhibit 91: Chart on Germany - Market size and forecast 2023-2028 ($ million)
      • Exhibit 92: Data Table on Germany - Market size and forecast 2023-2028 ($ million)
      • Exhibit 93: Chart on Germany - Year-over-year growth 2023-2028 (%)
      • Exhibit 94: Data Table on Germany - Year-over-year growth 2023-2028 (%)
    • 9.11 UK - Market size and forecast 2023-2028
      • Exhibit 95: Chart on UK - Market size and forecast 2023-2028 ($ million)
      • Exhibit 96: Data Table on UK - Market size and forecast 2023-2028 ($ million)
      • Exhibit 97: Chart on UK - Year-over-year growth 2023-2028 (%)
      • Exhibit 98: Data Table on UK - Year-over-year growth 2023-2028 (%)
    • 9.12 Japan - Market size and forecast 2023-2028
      • Exhibit 99: Chart on Japan - Market size and forecast 2023-2028 ($ million)
      • Exhibit 100: Data Table on Japan - Market size and forecast 2023-2028 ($ million)
      • Exhibit 101: Chart on Japan - Year-over-year growth 2023-2028 (%)
      • Exhibit 102: Data Table on Japan - Year-over-year growth 2023-2028 (%)
    • 9.13 Market opportunity by geography
      • Exhibit 103: Market opportunity by geography ($ million)
      • Exhibit 104: Data Tables on Market opportunity by geography ($ million)

    10 Drivers, Challenges, and Trends

    • 10.1 Market drivers
      • 10.2 Market challenges
        • 10.3 Impact of drivers and challenges
          • Exhibit 105: Impact of drivers and challenges in 2023 and 2028
        • 10.4 Market trends

          11 Vendor Landscape

          • 11.1 Overview
            • 11.2 Vendor landscape
              • Exhibit 106: Overview on Criticality of inputs and Factors of differentiation
            • 11.3 Landscape disruption
              • Exhibit 107: Overview on factors of disruption
            • 11.4 Industry risks
              • Exhibit 108: Impact of key risks on business

            12 Vendor Analysis

            • 12.1 Vendors covered
              • Exhibit 109: Vendors covered
            • 12.2 Market positioning of vendors
              • Exhibit 110: Matrix on vendor position and classification
            • 12.3 Accenture Plc
              • Exhibit 111: Accenture Plc - Overview
              • Exhibit 112: Accenture Plc - Business segments
              • Exhibit 113: Accenture Plc - Key news
              • Exhibit 114: Accenture Plc - Key offerings
              • Exhibit 115: Accenture Plc - Segment focus
            • 12.4 Exterro Inc.
              • Exhibit 116: Exterro Inc. - Overview
              • Exhibit 117: Exterro Inc. - Product / Service
              • Exhibit 118: Exterro Inc. - Key offerings
            • 12.5 FTI Consulting Inc.
              • Exhibit 119: FTI Consulting Inc. - Overview
              • Exhibit 120: FTI Consulting Inc. - Business segments
              • Exhibit 121: FTI Consulting Inc. - Key news
              • Exhibit 122: FTI Consulting Inc. - Key offerings
              • Exhibit 123: FTI Consulting Inc. - Segment focus
            • 12.6 Gimmal
              • Exhibit 124: Gimmal - Overview
              • Exhibit 125: Gimmal - Product / Service
              • Exhibit 126: Gimmal - Key offerings
            • 12.7 Informatica Inc.
              • Exhibit 127: Informatica Inc. - Overview
              • Exhibit 128: Informatica Inc. - Product / Service
              • Exhibit 129: Informatica Inc. - Key offerings
            • 12.8 International Business Machines Corp.
              • Exhibit 130: International Business Machines Corp. - Overview
              • Exhibit 131: International Business Machines Corp. - Business segments
              • Exhibit 132: International Business Machines Corp. - Key news
              • Exhibit 133: International Business Machines Corp. - Key offerings
              • Exhibit 134: International Business Machines Corp. - Segment focus
            • 12.9 Iron Mountain Inc.
              • Exhibit 135: Iron Mountain Inc. - Overview
              • Exhibit 136: Iron Mountain Inc. - Business segments
              • Exhibit 137: Iron Mountain Inc. - Key news
              • Exhibit 138: Iron Mountain Inc. - Key offerings
              • Exhibit 139: Iron Mountain Inc. - Segment focus
            • 12.10 Kroll LLC
              • Exhibit 140: Kroll LLC - Overview
              • Exhibit 141: Kroll LLC - Product / Service
              • Exhibit 142: Kroll LLC - Key offerings
            • 12.11 Kyocera Corp.
              • Exhibit 143: Kyocera Corp. - Overview
              • Exhibit 144: Kyocera Corp. - Business segments
              • Exhibit 145: Kyocera Corp. - Key offerings
              • Exhibit 146: Kyocera Corp. - Segment focus
            • 12.12 MetricStream Inc.
              • Exhibit 147: MetricStream Inc. - Overview
              • Exhibit 148: MetricStream Inc. - Product / Service
              • Exhibit 149: MetricStream Inc. - Key offerings
            • 12.13 Mitratech Inc.
              • Exhibit 150: Mitratech Inc. - Overview
              • Exhibit 151: Mitratech Inc. - Product / Service
              • Exhibit 152: Mitratech Inc. - Key offerings
            • 12.14 Open Text Corp.
              • Exhibit 153: Open Text Corp. - Overview
              • Exhibit 154: Open Text Corp. - Product / Service
              • Exhibit 155: Open Text Corp. - Key news
              • Exhibit 156: Open Text Corp. - Key offerings
            • 12.15 Oracle Corp.
              • Exhibit 157: Oracle Corp. - Overview
              • Exhibit 158: Oracle Corp. - Business segments
              • Exhibit 159: Oracle Corp. - Key news
              • Exhibit 160: Oracle Corp. - Key offerings
              • Exhibit 161: Oracle Corp. - Segment focus
            • 12.16 Spirion LLC
              • Exhibit 162: Spirion LLC - Overview
              • Exhibit 163: Spirion LLC - Product / Service
              • Exhibit 164: Spirion LLC - Key offerings
            • 12.17 Veritas Technologies LLC
              • Exhibit 165: Veritas Technologies LLC - Overview
              • Exhibit 166: Veritas Technologies LLC - Product / Service
              • Exhibit 167: Veritas Technologies LLC - Key offerings

            13 Appendix

            • 13.1 Scope of the report
              • 13.2 Inclusions and exclusions checklist
                • Exhibit 168: Inclusions checklist
                • Exhibit 169: Exclusions checklist
              • 13.3 Currency conversion rates for US$
                • Exhibit 170: Currency conversion rates for US$
              • 13.4 Research methodology
                • Exhibit 171: Research methodology
                • Exhibit 172: Validation techniques employed for market sizing
                • Exhibit 173: Information sources
              • 13.5 List of abbreviations
                • Exhibit 174: List of abbreviations

              Research Methodology

              Technavio presents a detailed picture of the market by way of study, synthesis, and summation of data from multiple sources. The analysts have presented the various facets of the market with a particular focus on identifying the key industry influencers. The data thus presented is comprehensive, reliable, and the result of extensive research, both primary and secondary.

              INFORMATION SOURCES

              Primary sources

              • Manufacturers and suppliers
              • Channel partners
              • Industry experts
              • Strategic decision makers

              Secondary sources

              • Industry journals and periodicals
              • Government data
              • Financial reports of key industry players
              • Historical data
              • Press releases

              DATA ANALYSIS

              Data Synthesis

              • Collation of data
              • Estimation of key figures
              • Analysis of derived insights

              Data Validation

              • Triangulation with data models
              • Reference against proprietary databases
              • Corroboration with industry experts

              REPORT WRITING

              Qualitative

              • Market drivers
              • Market challenges
              • Market trends
              • Five forces analysis

              Quantitative

              • Market size and forecast
              • Market segmentation
              • Geographical insights
              • Competitive landscape

              Interested in this report?

              Get your sample now to see our research methodology and insights!

              Download Now

              Frequently Asked Questions

              Information Governance in Social Business market growth will increase by $ 6783.42 mn during 2024-2028.

              The Information Governance in Social Business market is expected to grow at a CAGR of 13.5% during 2024-2028.

              Information Governance in Social Business market is segmented by Product( Software, Services) End-user( Large enterprises, SMEs)

              Accenture Plc, Exterro Inc., Flatworld Solutions Pvt. Ltd., FTI Consulting Inc., Gimmal, Informatica Inc., International Business Machines Corp., Iron Mountain Inc., Kroll LLC, Kyocera Corp., MetricStream Inc., Mitratech Inc., Open Text Corp., Oracle Corp., Salesforce Inc., Spirion LLC, Sprout Social Inc., Talkwalker Sarl, Veritas Technologies LLC are a few of the key vendors in the Information Governance in Social Business market.

              North America will register the highest growth rate of 44% among the other regions. Therefore, the Information Governance in Social Business market in North America is expected to garner significant business opportunities for the vendors during the forecast period.

              US, China, Japan, Germany, UK

              • Rising regulatory compliance requirements related to information governance in social businessRising regulatory compliance requirements are indeed a significant driver behind the growth of the global information governance in social business market. In recent years is the driving factor this market.
              • governments worldwide have implemented stringent data protection regulations to safeguard individuals privacy rights and mitigate risks associated with the misuse of personal data on social media platforms. For instance is the driving factor this market.
              • the European Unions GDPR is the driving factor this market.
              • which came into effect in 2018 is the driving factor this market.
              • mandates strict guidelines for the collection is the driving factor this market.
              • processing is the driving factor this market.
              • and storage of personal data by businesses operating within the EU or targeting EU citizens. GDPR imposes hefty fines for non-compliance is the driving factor this market.
              • compelling organizations to adopt robust information governance strategies to ensure adherence to its provisions. Similarly is the driving factor this market.
              • in the US is the driving factor this market.
              • the CCPA is the driving factor this market.
              • enacted in 2020 is the driving factor this market.
              • grants residents of California comprehensive rights over their personal information and imposes obligations on businesses to disclose data collection practices is the driving factor this market.
              • honor consumer requests regarding their data is the driving factor this market.
              • and implement reasonable security measures to protect personal information. The CCPAs enforcement has prompted businesses is the driving factor this market.
              • even those outside California is the driving factor this market.
              • to enhance their data governance practices to comply with its stringent requirements and avoid penalties. The growing global trend toward data sovereignty and localization laws is the driving factor this market.
              • such as Chinas Cybersecurity Law and Russias data localization requirements is the driving factor this market.
              • further underscores the importance of robust information governance in navigating complex regulatory landscapes and ensuring compliance with varying data protection standards across jurisdictions. These regulations compel organizations to implement comprehensive information governance frameworks that encompass data classification is the driving factor this market.
              • encryption is the driving factor this market.
              • access controls is the driving factor this market.
              • and auditing capabilities to effectively manage and protect sensitive data shared through social media channels. In response to these regulatory challenges is the driving factor this market.
              • organizations are increasingly turning to information governance solutions tailored specifically to social business environments to streamline compliance efforts is the driving factor this market.
              • mitigate legal and regulatory risks is the driving factor this market.
              • and demonstrate accountability and transparency in their social media data practices. These solutions offer features such as automated data classification is the driving factor this market.
              • policy enforcement is the driving factor this market.
              • audit trails is the driving factor this market.
              • and reporting functionalities to help organizations ensure compliance with regulatory requirements and maintain trust with their stakeholders amid the evolving regulatory landscape. Therefore is the driving factor this market.
              • the rising regulatory compliance requirements are expected to drive the growth of the global information governance in social business market during the forecast period. is the driving factor this market.

              The Information Governance in Social Business market vendors should focus on grabbing business opportunities from the Software segment as it accounted for the largest market share in the base year.
              RIA - Research AI Assistant
              Ask RIA