
Europe Insurance Brokerage Market Size and Trends
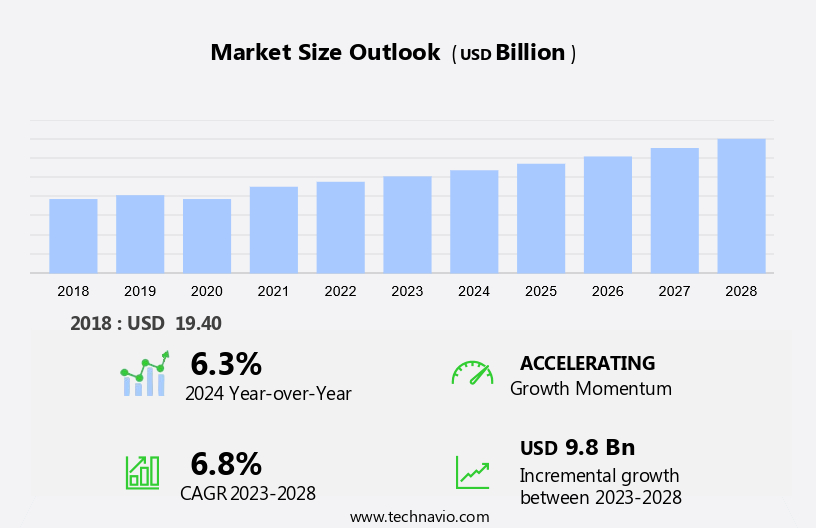
The Europe insurance brokerage market size is forecast to increase by USD 9.8 billion at a CAGR of 6.8% between 2024 and 2028. The market is experiencing significant changes, driven by various factors. One notable trend is the increasing demand for insurance policies, particularly in areas such as cyber insurance. This growth is attributed to the heightened awareness of risk and the need for protection against cyber threats. Another trend is the integration of IT and analytic solutions to enhance risk assessment and claims management. However, this market also faces challenges, including regulatory changes and the conflict between intermediaries, insurers, and policyholders over technical advice and pricing. By offering comprehensive insurance solutions, insurance brokers are expanding their offerings to include security services and personalized financial advice. Effective claims management and risk assessment are crucial for insurers to maintain profitability and for policyholders to receive optimal coverage. Cyber insurance, in particular, requires specialized knowledge and expertise, making the role of insurance brokers increasingly important in navigating this complex landscape.
The market is a significant sector in the financial services industry, playing a crucial role in connecting policyholders with insurers. This market is characterized by the provision of brokerage services, which include customized coverage and technical advice, to help policyholders make informed decisions about their insurance needs. Insurance brokers act as intermediaries between policyholders and insurers, offering a range of services beyond just selling insurance policies. They provide professional advice on various types of insurance, such as life insurance for financial planning, medical insurance and health insurance for personal protection, and property insurance for business and homeowners. The market is undergoing digital transformation, with e-commerce platforms becoming increasingly popular. This shift towards digital solutions enables policyholders to access customized insurance plans more efficiently and conveniently. Moreover, it allows insurers to streamline their underwriting processes, reducing turnaround times and enhancing customer experience. Customized insurance solutions are a key trend in the market. Policyholders are increasingly seeking tailored coverage that caters to their unique requirements. Insurance brokers leverage advanced analytics and technology to offer personalized recommendations based on individual risk profiles. Insurance brokers play a vital role in promoting financial literacy among their clients.
Market Segmentation
The market research report provides comprehensive data (region-wise segment analysis), with forecasts and estimates in "USD billion" for the period 2024-2028, as well as historical data from 2018 - 2022 for the following segments.
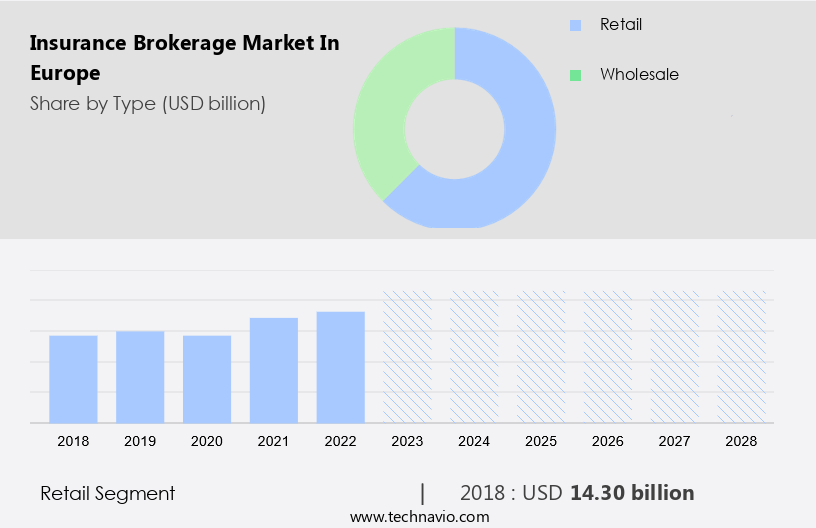
- Type
- Retail
- Wholesale
- Geography
- Europe
- Germany
- UK
- France
- Italy
- Europe
By Type Insights
The retail segment is estimated to witness significant growth during the forecast period. Retail insurance brokers serve as intermediaries between insurance seekers and the insurance marketplace in the United States. They procure insurance policies from wholesale brokers and insurers, subsequently selling these offerings to businesses or individuals. Some retail insurance brokers maintain exclusive relationships with one specific wholesale broker or insurer.
Get a glance at the market share of various segments Download the PDF Sample
The retail segment was the largest segment and was valued at USD 14.30 billion in 2018. The retail insurance brokerage role involves several key functions. They conduct thorough research on various insurance policies to identify suitable coverage options for their clients. Negotiations with insurers transpire to secure favorable terms for the policyholder. Insurance premiums are collected, and data is gathered for underwriters. Renewals or revisions of existing policies are managed for customers, and guidance is provided regarding claims handling. Hence, such factors are fuelling the growth of this segment during the forecast period.
Our researchers analyzed the data with 2023 as the base year, along with the key drivers, trends, and challenges. A holistic analysis of drivers will help companies refine their marketing strategies to gain a competitive advantage.
Europe Insurance Brokerage Market Driver
Increased demand for insurance policies is notably driving market growth. In the European market, customer interactions play a pivotal role in driving growth. With an increasing focus on financial literacy and customized insurance plans, brokers are working diligently to streamline underwriting processes and claims handling. This approach not only enhances customer satisfaction but also fosters trust and loyalty.
The demographic shift towards an aging population and the emergence of millennials presents significant opportunities for insurance brokers in sectors such as medical, life, accidental, and property insurance. As a result, the demand for accident, life, medical, vehicle, liability, and property insurance continues to surge in Europe. Thus, such factors are driving the growth of the market during the forecast period.
Europe Insurance Brokerage Market Trends
Integration of IT and analytic solutions is the key trend in the market. Insurance brokers play a crucial role in the US insurance market by providing customized coverage and brokerage services to clients. In today's digital age, insurance firms are integrating IT and analytic solutions to enhance their offerings and gain a competitive edge.
Data analytics is a key component of this transformation, enabling firms to design customized insurance solutions based on customer data and market trends. Insurance vendors focus on business intelligence to convert raw data into valuable marketing insights. By analyzing key performance indicators, they can assess the current market scenario and tailor their strategies accordingly. Data analytics employs advanced techniques such as simulation and stochastic modeling to forecast potential market scenarios and identify hidden patterns. Thus, such trends will shape the growth of the market during the forecast period.
Europe Insurance Brokerage Market Challenge
Conflict between insurance brokers and customers is the major challenge that affects the growth of the market. In the realm of business liability insurance, effective communication between insurance brokers and consumers is crucial for policy sales. The proliferation of E-commerce platforms has enabled consumers to conduct extensive research prior to engaging with brokers.
Consequently, consumers possess a high level of product awareness, necessitating a well-informed sales force in the market. However, insufficient information exchange between the broker and the consumer can hinder the insurance transaction process. Inadequate product information may prevent brokers from providing prompt details about a business agreement, leading to potential conflicts of interest. Hence, the above factors will impede the growth of the market during the forecast period.
Exclusive Customer Landscape
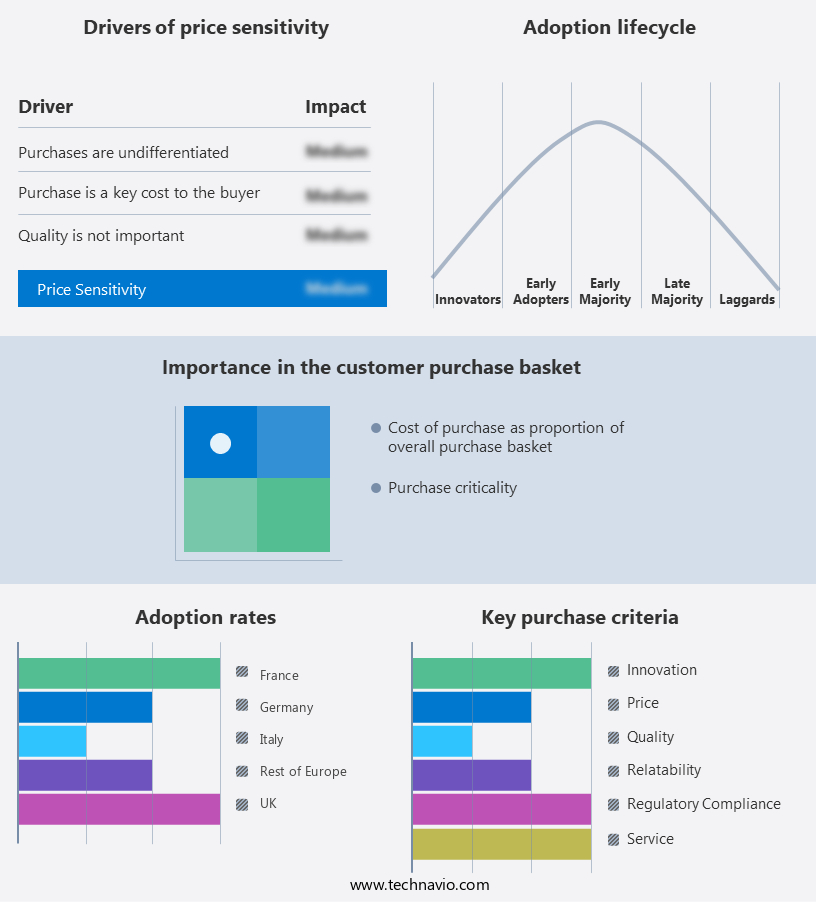
The market forecasting report includes the adoption lifecycle of the market, covering from the innovator's stage to the laggard's stage. It focuses on adoption rates in different regions based on penetration. Furthermore, the report also includes key purchase criteria and drivers of price sensitivity to help companies evaluate and develop their market growth analysis strategies.
Customer Landscape
Key Companies & Market Insights
Companies are implementing various strategies, such as strategic alliances, partnerships, mergers and acquisitions, geographical expansion, and product/service launches, to enhance their presence in the market.
AmWINS Group Inc: The company offers insurance brokerage such as specialty insurance products and services in the Property and Casualty and group benefits insurance marketplace, placing over USD10 billion in premiums annually through extensive relationships with retail brokerage firms and insurance carriers.
The market research and growth report also includes detailed analyses of the competitive landscape of the market and information about key companies, including:
- Acrisure LLC
- Aon plc
- Arthur J. Gallagher and Co.
- Assured Partners Inc.
- Blythin and Brown Ltd.
- Brown and Brown Inc.
- Foa and Son Corp.
- Funk Group GmbH
- HUB International Ltd.
- Lloyds and Corp.
- Lockton Companies
- Marsh and McLennan Co. Inc.
- NFP Corp.
- QBE European Operations plc
- Regent Insurance Brokers Europe GmbH
- Swiss Re Ltd.
- Truist Financial Corp.
- USI Insurance Services
- Willis Towers Watson Public Ltd. Co.
Qualitative and quantitative analysis of companies has been conducted to help clients understand the wider business environment as well as the strengths and weaknesses of key market players. Data is qualitatively analyzed to categorize companies as pure play, category-focused, industry-focused, and diversified; it is quantitatively analyzed to categorize companies as dominant, leading, strong, tentative, and weak.
The market is a dynamic and evolving industry that connects policyholders with insurers to provide customized coverage for various risks. Insurance brokers offer brokerage services, acting as intermediaries between policyholders and insurers, providing professional and technical advice to help clients make informed decisions on insurance policies. The market is witnessing significant digital transformation, with the adoption of IT & analytic solutions, digital brokers, and insurtech startups. This shift is enabling the creation of personalized insurance policies and tailor-made risk coverages, catering to the unique needs of consumers and businesses. Life insurance, medical insurance, car insurance, and property insurance are some of the popular insurance products offered by insurance brokers. Brokers provide financial planning services, helping clients manage their risks and plan for their financial future.
Moreover, regulatory changes and consumer protection laws are driving the need for customized insurance solutions, with a focus on risk assessment, claims management, and customer education. Cyber insurance is an emerging area of growth, as businesses increasingly recognize the importance of protecting themselves against cyber threats. Risk profiling and strategic planning are essential components of the market, with insurers and brokers working together to offer customized insurance plans to meet the specific needs of their clients. The market is also witnessing the adoption of artificial intelligence, automation, and the Internet of Things to streamline underwriting, claims processing, and customer interactions.
|
Market Scope |
|
|
Report Coverage |
Details |
|
Page number |
139 |
|
Base year |
2023 |
|
Historic period |
2018 - 2022 |
|
Forecast period |
2024-2028 |
|
Growth momentum & CAGR |
Accelerate at a CAGR of 6.8% |
|
Market growth 2024-2028 |
USD 9.8 billion |
|
Market structure |
Fragmented |
|
YoY growth 2023-2024(%) |
6.3 |
|
Competitive landscape |
Leading Companies, Market Positioning of Companies, Competitive Strategies, and Industry Risks |
|
Key companies profiled |
Acrisure LLC, AmWINS Group Inc., Aon plc, Arthur J. Gallagher and Co., Assured Partners Inc., Blythin and Brown Ltd., Brown and Brown Inc., Foa and Son Corp., Funk Group GmbH, HUB International Ltd., Lloyds and Corp., Lockton Companies, Marsh and McLennan Co. Inc., NFP Corp., QBE European Operations plc, Regent Insurance Brokers Europe GmbH, Swiss Re Ltd., Truist Financial Corp., USI Insurance Services, and Willis Towers Watson Public Ltd. Co. |
|
Market dynamics |
Parent market analysis, market report , market forecast , Market growth inducers and obstacles, Fast-growing and slow-growing segment analysis, COVID-19 impact and recovery analysis and future consumer dynamics, Market condition analysis for forecast period |
|
Customization purview |
If our report has not included the data that you are looking for, you can reach out to our analysts and get segments customized. |
What are the Key Data Covered in this Market Research Report?
- CAGR of the market during the forecast period
- Detailed information on factors that will drive the market growth and forecasting between 2024 and 2028
- Precise estimation of the size of the market and its contribution of the market in focus to the parent market
- Accurate predictions about upcoming market growth and trends and changes in consumer behaviour
- Growth of the market across Europe
- Thorough analysis of the market's competitive landscape and detailed information about companies
- Comprehensive analysis of factors that will challenge the growth of market companies
We can help! Our analysts can customize this market research report to meet your requirements. Get in touch
 RIA -
RIA - 
