Insurance Claims Services Market Analysis North America, Europe, APAC, South America, Middle East and Africa - US, China, UK, Germany, India, France, Japan, Canada, Brazil, Australia - Size and Forecast 2025-2029

Insurance Claims Services Market Analysis North America, Europe, APAC, South America, Middle East and Africa - US, China, UK, Germany, India, France, Japan, Canada, Brazil, Australia - Size and Forecast 2025-2029

Published: Jan 2025 217 Pages SKU: IRTNTR80546

Market Overview at a Glance

$155.1 B
Market Opportunity
12.7%
CAGR
12.1
YoY growth 2024-2025(%)

Insurance Claims Services Market Size 2025-2029

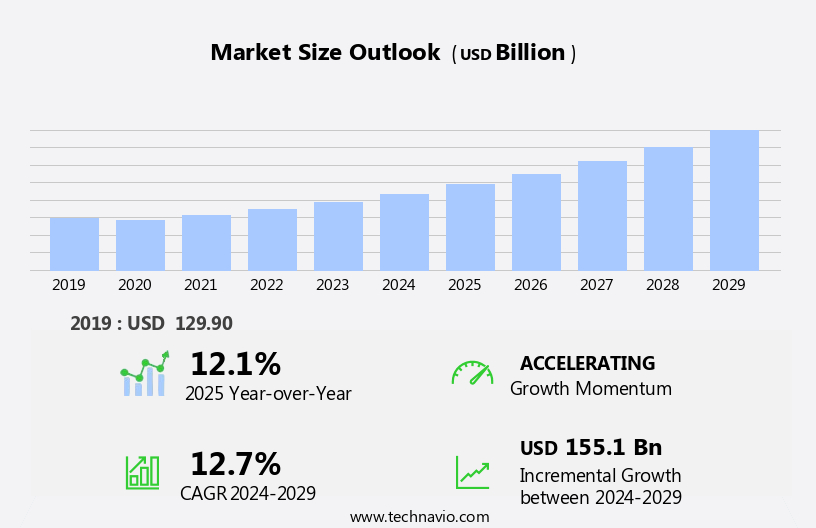
The insurance claims services market size is forecast to increase by USD 155.1 billion at a CAGR of 12.7% between 2024 and 2029.

  • The market is experiencing significant growth, driven by the ongoing urbanization and economic development worldwide. This trend is increasing the demand for efficient and effective claims processing services to cater to the expanding population and growing number of insured individuals. Furthermore, the digital transformation in the insurance industry is revolutionizing claims services, enabling faster and more accurate processing through advanced technologies such as artificial intelligence and machine learning. However, the market faces challenges that must be addressed to fully capitalize on its growth potential. Stringent regulatory compliance, particularly in the areas of data privacy and security, poses a significant hurdle for market participants.
  • Additionally, inconsistencies in the supply chain, including the availability and reliability of data from various sources, can hinder the efficiency and accuracy of claims processing. To succeed in this dynamic market, companies must navigate these challenges by investing in robust compliance frameworks and implementing advanced technologies to streamline their operations and ensure data accuracy. By doing so, they will be well-positioned to meet the evolving needs of their customers and capture new opportunities in the rapidly expanding the market.

What will be the Size of the Insurance Claims Services Market during the forecast period?

Insurance Claims Services Market Size

 Request Free Sample

  • The market is characterized by a growing emphasis on efficiency and accuracy in claims processing. Claims documentation and best practices are crucial for effective claims settlement, while claims insights derived from data analysis help insurers identify trends and improve performance. Fraud detection algorithms and claims benchmarking are essential tools for mitigating fraud and ensuring fair pricing. Claims management solutions, including digital claims processing and mobile reporting, streamline the claims journey for policyholders. Remote claims assessment and customer self-service portals enable faster resolution of disputes through claims negotiation and litigation. Insurance companies leverage claims analytics platforms to measure performance, forecast costs, and assess risks.
  • Policy validation and claims cost management are integral components of these solutions. Claims triage and audit help insurers prioritize claims and maintain compliance with industry regulations. Insurtech innovations, such as claims dashboards and automation tools, facilitate real-time claims processing and analysis. These advancements enable insurers to respond promptly to claims and deliver a superior customer experience. Overall, the market is evolving to meet the demands of a digital age, prioritizing transparency, accuracy, and efficiency.

How is this Insurance Claims Services Industry segmented?

The insurance claims services industry research report provides comprehensive data (region-wise segment analysis), with forecasts and estimates in "USD billion" for the period 2025-2029, as well as historical data from 2019-2023 for the following segments.

  • Type
    • Property and casualty claims
    • Health insurance claims
    • Motor insurance claims
    • Life insurance claims
  • End-user
    • Individual policyholder
    • Commercial policyholder
    • Government and public sector
  • Geography
    • North America
      • US
      • Canada
    • Europe
      • France
      • Germany
      • UK
    • APAC
      • Australia
      • China
      • India
      • Japan
    • South America
      • Brazil
    • Rest of World (ROW)

    By Type Insights

    The property and casualty claims segment is estimated to witness significant growth during the forecast period.

    The market, notably in the property and casualty sector, is marked by its handling of losses involving property damage and accidents or injuries' liability. This segment addresses incidents such as fires, theft, natural disasters, and various forms of liability. The intricacy of property and casualty insurance claims necessitates comprehensive assessment, rigorous investigation, and collaboration with external adjusters to guarantee fair and precise settlements. A key factor fueling growth in the property and casualty claims segment is the rising frequency and intensity of natural disasters. Events like hurricanes, floods, and wildfires are increasingly common, resulting in a surge in claims.

    Machine learning, claims data analytics, and artificial intelligence are increasingly being integrated into claims platforms to streamline the claims process, improve operational efficiency, and reduce costs. Personal lines insurance and commercial insurance each present unique challenges in claims handling. Personal lines insurance involves managing claims for individual policies, while commercial insurance encompasses claims for businesses. Industry best practices and insurance regulation play a crucial role in ensuring a consistent and fair claims process across the board. Claims automation, fraud detection, and risk management are essential components of the claims process. Health insurance claims, though distinct from property and casualty, share similarities in the need for thorough investigation and coordination with providers.

    Cloud computing and mobile applications are transforming the insurance industry, enabling claims reporting, processing, and adjudication in real-time. Claims software and technology are essential tools for claims specialists, adjusters, and examiners, facilitating data security, customer satisfaction, and claims cycle time reduction. Policy administration, claims payables, and claims workflow are interconnected aspects of the claims process, requiring seamless integration and coordination. Cost reduction, claims ratios, and claims severity are critical metrics for insurance carriers, agents, and brokers to monitor and manage effectively.

    Insurance Claims Services Market Size

    Request Free Sample

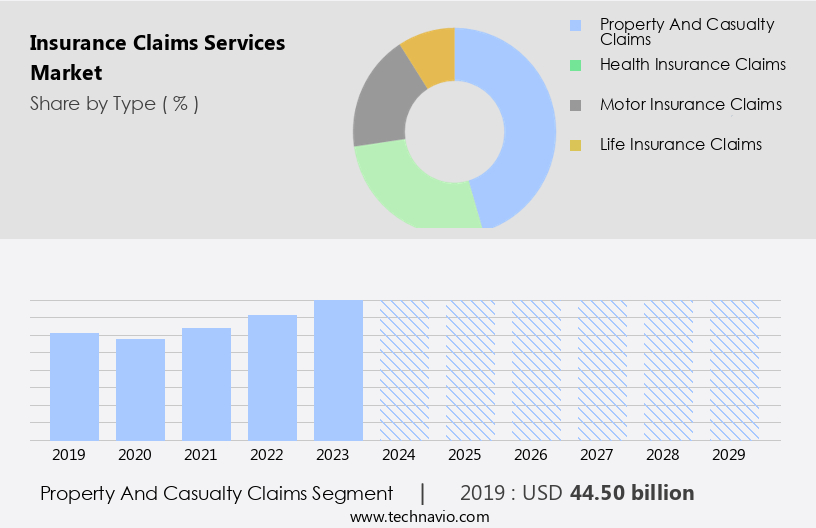
    The Property and casualty claims segment was valued at USD 44.50 billion in 2019 and showed a gradual increase during the forecast period.

    Regional Analysis

    North America is estimated to contribute 35% to the growth of the global market during the forecast period.Technavio’s analysts have elaborately explained the regional trends and drivers that shape the market during the forecast period.

    Insurance Claims Services Market Share by Geography

    Download Free Sample Report

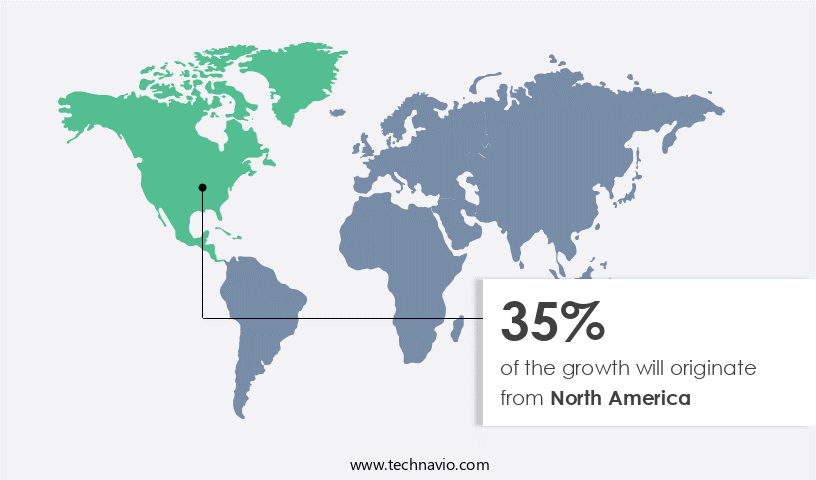
    In the vast and intricate landscape of the insurance industry, North America, specifically the United States, emerges as a significant player in The market. The region's well-established insurance sector, coupled with a large population and extensive insurance coverage across various sectors like life, health, property, casualty, and motor insurance, fuels considerable demand for insurance claims services. This mature market is marked by a robust infrastructure and regulatory framework that fosters efficient claims processing and management. Natural disasters, such as hurricanes, floods, and wildfires, are common occurrences in North America, significantly impacting the property and casualty insurance sectors.

    For example, on January 7, 2025, California was hit by devastating wildfires due to a Santa Ana wind event in Los Angeles County. In response to these events, claims handling becomes a critical function, necessitating the use of advanced technologies like machine learning, claims data analytics, and artificial intelligence to expedite claims resolution and enhance operational efficiency. Personal lines and commercial insurance companies employ claims platforms, claims software, and mobile applications to streamline the claims process and improve customer experience. Claims management, claims adjudication, claims reporting, and risk management are all integral components of this process. Moreover, the integration of fraud prevention measures, such as fraud detection and claims investigators, ensures cost reduction and maintains claims ratios.

    Industry best practices and insurance regulation guide the market in North America. Regulatory changes and policy administration updates necessitate continuous adaptation and innovation. Insurance carriers, agents, brokers, and adjusters collaborate to provide comprehensive claims services, ensuring customer satisfaction and data security throughout the claims lifecycle. The digital transformation of the insurance industry further propels the adoption of claims technology, including claims automation, claims workflow, and claims payables, to optimize the claims process and enhance overall operational efficiency.

    Market Dynamics

    Our researchers analyzed the data with 2024 as the base year, along with the key drivers, trends, and challenges. A holistic analysis of drivers will help companies refine their marketing strategies to gain a competitive advantage.

    What are the Insurance Claims Services market drivers leading to the rise in the adoption of Industry?

    • Urbanization and economic development serve as the primary catalysts for market growth. 

    • The market experiences significant growth due to the increasing urbanization and economic development worldwide. With over half of the Asia-Pacific (APAC) region's population residing in urban areas as of 2024, the demand for various insurance products, such as property, health, and motor insurance, escalates. Urban environments introduce unique risks, making insurance essential for individuals and businesses to protect their assets. Economic growth, particularly in countries like China, further fuels market expansion. As businesses thrive and populations grow, the need for effective claims services becomes increasingly important. Claims specialists and adjusters play a crucial role in managing the claims lifecycle, ensuring data security, and reducing costs through accurate claims reporting, processing, and claims severity analysis.
    • Risk management is a critical aspect of the insurance industry, and claims services are an integral part of this process. Cost reduction and claims ratios are essential metrics for insurers, making the efficiency and accuracy of claims services vital for business success. Insurance brokers also play a significant role in connecting clients with suitable insurance policies and claims services.

    What are the Insurance Claims Services market trends shaping the Industry?

    • Digital transformation is an essential and growing trend in today's market. Expanding the use of digital technologies to enhance business operations and customer experiences is a mandatory step for organizations seeking to remain competitive.

    • The market is experiencing a notable shift towards digital transformation, with insurers integrating advanced technologies such as artificial intelligence (AI), machine learning, and claims data analytics to automate claims processing and enhance accuracy. This trend is fueled by the imperative to streamline operations, enhance customer experiences, and maintain industry competitiveness. AI technologies, like DXC Technology's AI Impact solution, optimize various insurance processes, including claims handling, underwriting, risk assessment, and customer service. Machine learning algorithms analyze historical claims data to identify patterns, predict potential claims, and assess risk, thereby reducing settlement times and improving overall efficiency. Cloud computing enables secure, real-time access to claims data, enabling insurers to make informed decisions and respond promptly to customer needs.
    • Compliance with industry best practices and insurance regulations is ensured through automation and data analytics, ensuring transparency and accountability. Commercial and personal lines insurers alike are embracing these technological advancements to stay competitive and meet evolving customer expectations.

    How does Insurance Claims Services market faces challenges face during its growth?

    • The stringent regulatory compliance requirements pose a significant challenge to the industry's growth trajectory. In order to maintain business operations and expand, companies must adhere to complex and evolving regulations, which can be resource-intensive and costly. Ensuring regulatory compliance is a critical priority for industry professionals, as failure to do so can result in penalties, reputational damage, and legal consequences. 

    • The market is characterized by stringent regulatory compliance, with insurers required to adhere to a complex and evolving regulatory landscape. In the US, regulations such as the Health Insurance Portability and Accountability Act (HIPAA) impose strict rules on the handling and sharing of patient data in health insurance claims. Similarly, the General Data Protection Regulation (GDPR) in the European Union emphasizes data privacy and security during claims processing. Claims resolution is a critical aspect of the insurance industry, with claims cycle time being a key performance indicator. To improve efficiency and reduce cycle time, insurers are leveraging technology, including claims management systems, claims fraud detection, natural language processing, and mobile applications.
    • Outsourcing claims processing to third-party service providers is also becoming increasingly common. Claims examiners and investigators play a crucial role in ensuring fair and accurate claims processing, while regulatory changes continue to shape the market landscape. Businesses across various sectors, including auto, life, and business insurance, are adopting advanced claims processing solutions to streamline operations and enhance customer experience.

    Exclusive Customer Landscape

    The insurance claims services market forecasting report includes the adoption lifecycle of the market, covering from the innovator’s stage to the laggard’s stage. It focuses on adoption rates in different regions based on penetration. Furthermore, the insurance claims services market report also includes key purchase criteria and drivers of price sensitivity to help companies evaluate and develop their market growth analysis strategies.
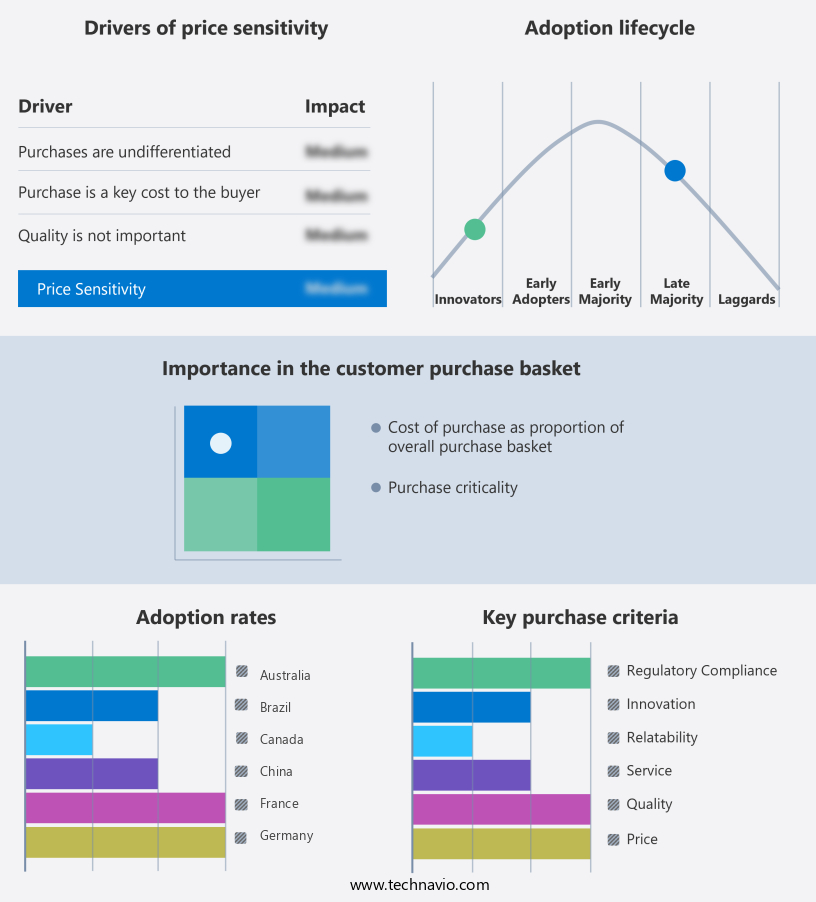
    Insurance Claims Services Market Share by Geography

     Customer Landscape

    Key Companies & Market Insights

    Companies are implementing various strategies, such as strategic alliances, insurance claims services market forecast, partnerships, mergers and acquisitions, geographical expansion, and product/service launches, to enhance their presence in the industry.

    Accenture PLC - The company specializes in insurance business process services and outsourcing, enhancing claim processing efficiency, quality, and reducing administrative expenses through innovative solutions. Our offerings encompass Accenture Insurance BPS, designed to streamline claims handling and optimize operational performance. By leveraging advanced technologies and industry expertise, we deliver cost savings and improved customer experience for our clients.

    The industry research and growth report includes detailed analyses of the competitive landscape of the market and information about key companies, including:

    • Accenture PLC
    • Capgemini Services SAS
    • CGI Inc.
    • Cognizant Technology Solutions Corp.
    • Conduent Inc.
    • DXC Technology Co.
    • Fiserv Inc.
    • HCL Technologies Ltd.
    • Infosys Ltd.
    • International Business Machines Corp.
    • Oracle Corp.
    • Pegasystems Inc.
    • Riddhi Corporate Services Ltd.
    • Sedgwick
    • Sutherland
    • Tata Consultancy Services Ltd.
    • WNS Holdings Ltd.

    Qualitative and quantitative analysis of companies has been conducted to help clients understand the wider business environment as well as the strengths and weaknesses of key industry players. Data is qualitatively analyzed to categorize companies as pure play, category-focused, industry-focused, and diversified; it is quantitatively analyzed to categorize companies as dominant, leading, strong, tentative, and weak.

    Recent Development and News in Insurance Claims Services Market

    • In February 2024, Allstate Insurance Company, a leading provider of insurance claims services, announced the launch of its new artificial intelligence (AI) powered claims assessment tool, ClaimCare AI. This innovation significantly enhances the speed and accuracy of claims processing, reducing the average time taken by 30% (Allstate press release).
    • In October 2025, Chubb Limited, another major player in the market, entered into a strategic partnership with IBM to leverage IBM's Watson AI technology for claims handling. This collaboration aims to improve claim processing efficiency and accuracy, enabling Chubb to offer more personalized services to its customers (IBM press release).
    • In March 2025, Munich Re, the world's largest reinsurer, acquired a significant stake in a leading digital claims management platform, ClaimGenius. This investment will enable Munich Re to expand its digital capabilities and offer more efficient claims services to its clients (Munich Re press release).
    • In May 2024, the European Commission approved the revised Insurance Distribution Directive (IDD), which includes new requirements for insurance intermediaries and distributors. This regulatory change will significantly impact the market, necessitating increased transparency, enhanced customer protection, and stricter compliance measures (European Commission press release).

    Research Analyst Overview

    The market continues to evolve, driven by advancements in technology and shifting industry dynamics. Claims investigation and handling are increasingly leveraging machine learning and claims data analytics to enhance accuracy and efficiency. Personal lines insurance and commercial insurance sectors are adopting claims platforms to streamline processes and improve operational efficiency. Industry best practices and insurance regulation are shaping the market, with a focus on claims automation and fraud prevention. Health insurance is exploring artificial intelligence and cloud computing to optimize claims resolution and enhance customer experience. Claims backlog and claims cycle time are critical metrics, with claims examiners utilizing natural language processing and claims software to expedite claims processing.

    Auto insurance and business insurance sectors are integrating mobile applications and claims technology to improve accessibility and convenience. Regulatory changes and claims frequency are influencing the market, with insurance carriers, agents, brokers, and adjusters adopting digital transformation to reduce cost and improve customer satisfaction. Claims payables, claims workflow, claims adjudication, and claims reporting are all areas undergoing significant innovation. Risk management and claims processing are becoming more sophisticated, with a focus on big data, data security, claims severity, and cost reduction. The claims lifecycle is being optimized through claims ratios and claims specialists, ensuring a seamless claims experience for policyholders.

    Dive into Technavio’s robust research methodology, blending expert interviews, extensive data synthesis, and validated models for unparalleled Insurance Claims Services Market insights. See full methodology.

    Market Scope

    Report Coverage

    Details

    Page number

    217

    Base year

    2024

    Historic period

    2019-2023

    Forecast period

    2025-2029

    Growth momentum & CAGR

    Accelerate at a CAGR of 12.7%

    Market growth 2025-2029

    USD 155.1 billion

    Market structure

    Fragmented

    YoY growth 2024-2025(%)

    12.1

    Key countries

    US, China, UK, Germany, India, France, Japan, Canada, Brazil, and Australia

    Competitive landscape

    Leading Companies, Market Positioning of Companies, Competitive Strategies, and Industry Risks

    Request Free Sample

    What are the Key Data Covered in this Insurance Claims Services Market Research and Growth Report?

    • CAGR of the Insurance Claims Services industry during the forecast period
    • Detailed information on factors that will drive the growth and forecasting between 2025 and 2029
    • Precise estimation of the size of the market and its contribution of the industry in focus to the parent market
    • Accurate predictions about upcoming growth and trends and changes in consumer behaviour
    • Growth of the market across North America, Europe, APAC, South America, and Middle East and Africa
    • Thorough analysis of the market’s competitive landscape and detailed information about companies
    • Comprehensive analysis of factors that will challenge the insurance claims services market growth of industry companies

    We can help! Our analysts can customize this insurance claims services market research report to meet your requirements.

    Get in touch


    1 Executive Summary

    • 1.1 Market overview
      • Executive Summary - Chart on Market Overview
      • Executive Summary - Data Table on Market Overview
      • Executive Summary - Chart on Global Market Characteristics
      • Executive Summary - Chart on Market by Geography
      • Executive Summary - Chart on Market Segmentation by Type
      • Executive Summary - Chart on Market Segmentation by End-user
      • Executive Summary - Chart on Incremental Growth
      • Executive Summary - Data Table on Incremental Growth
      • Executive Summary - Chart on Company Market Positioning

    2 Technavio Analysis

    • 2.1 Analysis of price sensitivity, lifecycle, customer purchase basket, adoption rates, and purchase criteria
      • Analysis of price sensitivity, lifecycle, customer purchase basket, adoption rates, and purchase criteria
    • 2.2 Criticality of inputs and Factors of differentiation
      • Overview on criticality of inputs and factors of differentiation
    • 2.3 Factors of disruption
      • Overview on factors of disruption
    • 2.4 Impact of drivers and challenges
      • Impact of drivers and challenges in 2024 and 2029

    3 Market Landscape

    • 3.1 Market ecosystem
      • Parent Market
      • Data Table on - Parent Market
    • 3.2 Market characteristics
      • Market characteristics analysis
    • 3.3 Value chain analysis
      • Value chain analysis

    4 Market Sizing

    • 4.1 Market definition
      • Offerings of companies included in the market definition
    • 4.2 Market segment analysis
      • Market segments
    • 4.3 Market size 2024
      • 4.4 Market outlook: Forecast for 2024-2029
        • Chart on Global - Market size and forecast 2024-2029 ($ billion)
        • Data Table on Global - Market size and forecast 2024-2029 ($ billion)
        • Chart on Global Market: Year-over-year growth 2024-2029 (%)
        • Data Table on Global Market: Year-over-year growth 2024-2029 (%)

      5 Historic Market Size

      • 5.1 Global Insurance Claims Services Market 2019 - 2023
        • Historic Market Size - Data Table on Global Insurance Claims Services Market 2019 - 2023 ($ billion)
      • 5.2 Type segment analysis 2019 - 2023
        • Historic Market Size - Type Segment 2019 - 2023 ($ billion)
      • 5.3 End-user segment analysis 2019 - 2023
        • Historic Market Size - End-user Segment 2019 - 2023 ($ billion)
      • 5.4 Geography segment analysis 2019 - 2023
        • Historic Market Size - Geography Segment 2019 - 2023 ($ billion)
      • 5.5 Country segment analysis 2019 - 2023
        • Historic Market Size - Country Segment 2019 - 2023 ($ billion)

      6 Qualitative Analysis

      • 6.1 Impact of AI on Global Insurance Claims Services Market

        7 Five Forces Analysis

        • 7.1 Five forces summary
          • Five forces analysis - Comparison between 2024 and 2029
        • 7.2 Bargaining power of buyers
          • Bargaining power of buyers - Impact of key factors 2024 and 2029
        • 7.3 Bargaining power of suppliers
          • Bargaining power of suppliers - Impact of key factors in 2024 and 2029
        • 7.4 Threat of new entrants
          • Threat of new entrants - Impact of key factors in 2024 and 2029
        • 7.5 Threat of substitutes
          • Threat of substitutes - Impact of key factors in 2024 and 2029
        • 7.6 Threat of rivalry
          • Threat of rivalry - Impact of key factors in 2024 and 2029
        • 7.7 Market condition
          • Chart on Market condition - Five forces 2024 and 2029

        8 Market Segmentation by Type

        • 8.1 Market segments
          • Chart on Type - Market share 2024-2029 (%)
          • Data Table on Type - Market share 2024-2029 (%)
        • 8.2 Comparison by Type
          • Chart on Comparison by Type
          • Data Table on Comparison by Type
        • 8.3 Property and casualty claims - Market size and forecast 2024-2029
          • Chart on Property and casualty claims - Market size and forecast 2024-2029 ($ billion)
          • Data Table on Property and casualty claims - Market size and forecast 2024-2029 ($ billion)
          • Chart on Property and casualty claims - Year-over-year growth 2024-2029 (%)
          • Data Table on Property and casualty claims - Year-over-year growth 2024-2029 (%)
        • 8.4 Health insurance claims - Market size and forecast 2024-2029
          • Chart on Health insurance claims - Market size and forecast 2024-2029 ($ billion)
          • Data Table on Health insurance claims - Market size and forecast 2024-2029 ($ billion)
          • Chart on Health insurance claims - Year-over-year growth 2024-2029 (%)
          • Data Table on Health insurance claims - Year-over-year growth 2024-2029 (%)
        • 8.5 Motor insurance claims - Market size and forecast 2024-2029
          • Chart on Motor insurance claims - Market size and forecast 2024-2029 ($ billion)
          • Data Table on Motor insurance claims - Market size and forecast 2024-2029 ($ billion)
          • Chart on Motor insurance claims - Year-over-year growth 2024-2029 (%)
          • Data Table on Motor insurance claims - Year-over-year growth 2024-2029 (%)
        • 8.6 Life insurance claims - Market size and forecast 2024-2029
          • Chart on Life insurance claims - Market size and forecast 2024-2029 ($ billion)
          • Data Table on Life insurance claims - Market size and forecast 2024-2029 ($ billion)
          • Chart on Life insurance claims - Year-over-year growth 2024-2029 (%)
          • Data Table on Life insurance claims - Year-over-year growth 2024-2029 (%)
        • 8.7 Market opportunity by Type
          • Market opportunity by Type ($ billion)
          • Data Table on Market opportunity by Type ($ billion)

        9 Market Segmentation by End-user

        • 9.1 Market segments
          • Chart on End-user - Market share 2024-2029 (%)
          • Data Table on End-user - Market share 2024-2029 (%)
        • 9.2 Comparison by End-user
          • Chart on Comparison by End-user
          • Data Table on Comparison by End-user
        • 9.3 Individual policyholder - Market size and forecast 2024-2029
          • Chart on Individual policyholder - Market size and forecast 2024-2029 ($ billion)
          • Data Table on Individual policyholder - Market size and forecast 2024-2029 ($ billion)
          • Chart on Individual policyholder - Year-over-year growth 2024-2029 (%)
          • Data Table on Individual policyholder - Year-over-year growth 2024-2029 (%)
        • 9.4 Commercial policyholder - Market size and forecast 2024-2029
          • Chart on Commercial policyholder - Market size and forecast 2024-2029 ($ billion)
          • Data Table on Commercial policyholder - Market size and forecast 2024-2029 ($ billion)
          • Chart on Commercial policyholder - Year-over-year growth 2024-2029 (%)
          • Data Table on Commercial policyholder - Year-over-year growth 2024-2029 (%)
        • 9.5 Government and public sector - Market size and forecast 2024-2029
          • Chart on Government and public sector - Market size and forecast 2024-2029 ($ billion)
          • Data Table on Government and public sector - Market size and forecast 2024-2029 ($ billion)
          • Chart on Government and public sector - Year-over-year growth 2024-2029 (%)
          • Data Table on Government and public sector - Year-over-year growth 2024-2029 (%)
        • 9.6 Market opportunity by End-user
          • Market opportunity by End-user ($ billion)
          • Data Table on Market opportunity by End-user ($ billion)

        10 Customer Landscape

        • 10.1 Customer landscape overview
          • Analysis of price sensitivity, lifecycle, customer purchase basket, adoption rates, and purchase criteria

        11 Geographic Landscape

        • 11.1 Geographic segmentation
          • Chart on Market share by geography 2024-2029 (%)
          • Data Table on Market share by geography 2024-2029 (%)
        • 11.2 Geographic comparison
          • Chart on Geographic comparison
          • Data Table on Geographic comparison
        • 11.3 North America - Market size and forecast 2024-2029
          • Chart on North America - Market size and forecast 2024-2029 ($ billion)
          • Data Table on North America - Market size and forecast 2024-2029 ($ billion)
          • Chart on North America - Year-over-year growth 2024-2029 (%)
          • Data Table on North America - Year-over-year growth 2024-2029 (%)
        • 11.4 Europe - Market size and forecast 2024-2029
          • Chart on Europe - Market size and forecast 2024-2029 ($ billion)
          • Data Table on Europe - Market size and forecast 2024-2029 ($ billion)
          • Chart on Europe - Year-over-year growth 2024-2029 (%)
          • Data Table on Europe - Year-over-year growth 2024-2029 (%)
        • 11.5 APAC - Market size and forecast 2024-2029
          • Chart on APAC - Market size and forecast 2024-2029 ($ billion)
          • Data Table on APAC - Market size and forecast 2024-2029 ($ billion)
          • Chart on APAC - Year-over-year growth 2024-2029 (%)
          • Data Table on APAC - Year-over-year growth 2024-2029 (%)
        • 11.6 South America - Market size and forecast 2024-2029
          • Chart on South America - Market size and forecast 2024-2029 ($ billion)
          • Data Table on South America - Market size and forecast 2024-2029 ($ billion)
          • Chart on South America - Year-over-year growth 2024-2029 (%)
          • Data Table on South America - Year-over-year growth 2024-2029 (%)
        • 11.7 Middle East and Africa - Market size and forecast 2024-2029
          • Chart on Middle East and Africa - Market size and forecast 2024-2029 ($ billion)
          • Data Table on Middle East and Africa - Market size and forecast 2024-2029 ($ billion)
          • Chart on Middle East and Africa - Year-over-year growth 2024-2029 (%)
          • Data Table on Middle East and Africa - Year-over-year growth 2024-2029 (%)
        • 11.8 US - Market size and forecast 2024-2029
          • Chart on US - Market size and forecast 2024-2029 ($ billion)
          • Data Table on US - Market size and forecast 2024-2029 ($ billion)
          • Chart on US - Year-over-year growth 2024-2029 (%)
          • Data Table on US - Year-over-year growth 2024-2029 (%)
        • 11.9 China - Market size and forecast 2024-2029
          • Chart on China - Market size and forecast 2024-2029 ($ billion)
          • Data Table on China - Market size and forecast 2024-2029 ($ billion)
          • Chart on China - Year-over-year growth 2024-2029 (%)
          • Data Table on China - Year-over-year growth 2024-2029 (%)
        • 11.10 UK - Market size and forecast 2024-2029
          • Chart on UK - Market size and forecast 2024-2029 ($ billion)
          • Data Table on UK - Market size and forecast 2024-2029 ($ billion)
          • Chart on UK - Year-over-year growth 2024-2029 (%)
          • Data Table on UK - Year-over-year growth 2024-2029 (%)
        • 11.11 Germany - Market size and forecast 2024-2029
          • Chart on Germany - Market size and forecast 2024-2029 ($ billion)
          • Data Table on Germany - Market size and forecast 2024-2029 ($ billion)
          • Chart on Germany - Year-over-year growth 2024-2029 (%)
          • Data Table on Germany - Year-over-year growth 2024-2029 (%)
        • 11.12 India - Market size and forecast 2024-2029
          • Chart on India - Market size and forecast 2024-2029 ($ billion)
          • Data Table on India - Market size and forecast 2024-2029 ($ billion)
          • Chart on India - Year-over-year growth 2024-2029 (%)
          • Data Table on India - Year-over-year growth 2024-2029 (%)
        • 11.13 France - Market size and forecast 2024-2029
          • Chart on France - Market size and forecast 2024-2029 ($ billion)
          • Data Table on France - Market size and forecast 2024-2029 ($ billion)
          • Chart on France - Year-over-year growth 2024-2029 (%)
          • Data Table on France - Year-over-year growth 2024-2029 (%)
        • 11.14 Japan - Market size and forecast 2024-2029
          • Chart on Japan - Market size and forecast 2024-2029 ($ billion)
          • Data Table on Japan - Market size and forecast 2024-2029 ($ billion)
          • Chart on Japan - Year-over-year growth 2024-2029 (%)
          • Data Table on Japan - Year-over-year growth 2024-2029 (%)
        • 11.15 Canada - Market size and forecast 2024-2029
          • Chart on Canada - Market size and forecast 2024-2029 ($ billion)
          • Data Table on Canada - Market size and forecast 2024-2029 ($ billion)
          • Chart on Canada - Year-over-year growth 2024-2029 (%)
          • Data Table on Canada - Year-over-year growth 2024-2029 (%)
        • 11.16 Brazil - Market size and forecast 2024-2029
          • Chart on Brazil - Market size and forecast 2024-2029 ($ billion)
          • Data Table on Brazil - Market size and forecast 2024-2029 ($ billion)
          • Chart on Brazil - Year-over-year growth 2024-2029 (%)
          • Data Table on Brazil - Year-over-year growth 2024-2029 (%)
        • 11.17 Australia - Market size and forecast 2024-2029
          • Chart on Australia - Market size and forecast 2024-2029 ($ billion)
          • Data Table on Australia - Market size and forecast 2024-2029 ($ billion)
          • Chart on Australia - Year-over-year growth 2024-2029 (%)
          • Data Table on Australia - Year-over-year growth 2024-2029 (%)
        • 11.18 Market opportunity by geography
          • Market opportunity by geography ($ billion)
          • Data Tables on Market opportunity by geography ($ billion)

        12 Drivers, Challenges, and Opportunity/Restraints

        • 12.1 Market drivers
          • 12.2 Market challenges
            • 12.3 Impact of drivers and challenges
              • Impact of drivers and challenges in 2024 and 2029
            • 12.4 Market opportunities/restraints

              13 Competitive Landscape

              • 13.1 Overview
                • 13.2 Competitive Landscape
                  • Overview on criticality of inputs and factors of differentiation
                • 13.3 Landscape disruption
                  • Overview on factors of disruption
                • 13.4 Industry risks
                  • Impact of key risks on business

                14 Competitive Analysis

                • 14.1 Companies profiled
                  • Companies covered
                • 14.2 Company ranking index
                  • Company ranking index
                • 14.3 Market positioning of companies
                  • Matrix on companies position and classification
                • 14.4 Accenture PLC
                  • Accenture PLC - Overview
                  • Accenture PLC - Business segments
                  • Accenture PLC - Key news
                  • Accenture PLC - Key offerings
                  • Accenture PLC - Segment focus
                  • SWOT
                • 14.5 Capgemini Services SAS
                  • Capgemini Services SAS - Overview
                  • Capgemini Services SAS - Business segments
                  • Capgemini Services SAS - Key news
                  • Capgemini Services SAS - Key offerings
                  • Capgemini Services SAS - Segment focus
                  • SWOT
                • 14.6 CGI Inc.
                  • CGI Inc. - Overview
                  • CGI Inc. - Business segments
                  • CGI Inc. - Key news
                  • CGI Inc. - Key offerings
                  • CGI Inc. - Segment focus
                  • SWOT
                • 14.7 Cognizant Technology Solutions Corp.
                  • Cognizant Technology Solutions Corp. - Overview
                  • Cognizant Technology Solutions Corp. - Business segments
                  • Cognizant Technology Solutions Corp. - Key news
                  • Cognizant Technology Solutions Corp. - Key offerings
                  • Cognizant Technology Solutions Corp. - Segment focus
                  • SWOT
                • 14.8 Conduent Inc.
                  • Conduent Inc. - Overview
                  • Conduent Inc. - Business segments
                  • Conduent Inc. - Key offerings
                  • Conduent Inc. - Segment focus
                  • SWOT
                • 14.9 DXC Technology Co.
                  • DXC Technology Co. - Overview
                  • DXC Technology Co. - Business segments
                  • DXC Technology Co. - Key news
                  • DXC Technology Co. - Key offerings
                  • DXC Technology Co. - Segment focus
                  • SWOT
                • 14.10 Fiserv Inc.
                  • Fiserv Inc. - Overview
                  • Fiserv Inc. - Business segments
                  • Fiserv Inc. - Key news
                  • Fiserv Inc. - Key offerings
                  • Fiserv Inc. - Segment focus
                  • SWOT
                • 14.11 HCL Technologies Ltd.
                  • HCL Technologies Ltd. - Overview
                  • HCL Technologies Ltd. - Business segments
                  • HCL Technologies Ltd. - Key news
                  • HCL Technologies Ltd. - Key offerings
                  • HCL Technologies Ltd. - Segment focus
                  • SWOT
                • 14.12 Infosys Ltd.
                  • Infosys Ltd. - Overview
                  • Infosys Ltd. - Business segments
                  • Infosys Ltd. - Key news
                  • Infosys Ltd. - Key offerings
                  • Infosys Ltd. - Segment focus
                  • SWOT
                • 14.13 International Business Machines Corp.
                  • International Business Machines Corp. - Overview
                  • International Business Machines Corp. - Business segments
                  • International Business Machines Corp. - Key news
                  • International Business Machines Corp. - Key offerings
                  • International Business Machines Corp. - Segment focus
                  • SWOT
                • 14.14 Pegasystems Inc.
                  • Pegasystems Inc. - Overview
                  • Pegasystems Inc. - Product / Service
                  • Pegasystems Inc. - Key offerings
                  • SWOT
                • 14.15 Riddhi Corporate Services Ltd.
                  • Riddhi Corporate Services Ltd. - Overview
                  • Riddhi Corporate Services Ltd. - Product / Service
                  • Riddhi Corporate Services Ltd. - Key offerings
                  • SWOT
                • 14.16 Sutherland
                  • Sutherland - Overview
                  • Sutherland - Product / Service
                  • Sutherland - Key offerings
                  • SWOT
                • 14.17 Tata Consultancy Services Ltd.
                  • Tata Consultancy Services Ltd. - Overview
                  • Tata Consultancy Services Ltd. - Business segments
                  • Tata Consultancy Services Ltd. - Key news
                  • Tata Consultancy Services Ltd. - Key offerings
                  • Tata Consultancy Services Ltd. - Segment focus
                  • SWOT
                • 14.18 WNS Holdings Ltd.
                  • WNS Holdings Ltd. - Overview
                  • WNS Holdings Ltd. - Business segments
                  • WNS Holdings Ltd. - Key news
                  • WNS Holdings Ltd. - Key offerings
                  • WNS Holdings Ltd. - Segment focus
                  • SWOT

                15 Appendix

                • 15.1 Scope of the report
                  • 15.2 Inclusions and exclusions checklist
                    • Inclusions checklist
                    • Exclusions checklist
                  • 15.3 Currency conversion rates for US$
                    • Currency conversion rates for US$
                  • 15.4 Research methodology
                    • Research methodology
                  • 15.5 Data procurement
                    • Information sources
                  • 15.6 Data validation
                    • Data validation
                  • 15.7 Validation techniques employed for market sizing
                    • Validation techniques employed for market sizing
                  • 15.8 Data synthesis
                    • Data synthesis
                  • 15.9 360 degree market analysis
                    • 360 degree market analysis
                  • 15.10 List of abbreviations
                    • List of abbreviations

                  Research Methodology

                  Technavio presents a detailed picture of the market by way of study, synthesis, and summation of data from multiple sources. The analysts have presented the various facets of the market with a particular focus on identifying the key industry influencers. The data thus presented is comprehensive, reliable, and the result of extensive research, both primary and secondary.

                  INFORMATION SOURCES

                  Primary sources

                  • Manufacturers and suppliers
                  • Channel partners
                  • Industry experts
                  • Strategic decision makers

                  Secondary sources

                  • Industry journals and periodicals
                  • Government data
                  • Financial reports of key industry players
                  • Historical data
                  • Press releases

                  DATA ANALYSIS

                  Data Synthesis

                  • Collation of data
                  • Estimation of key figures
                  • Analysis of derived insights

                  Data Validation

                  • Triangulation with data models
                  • Reference against proprietary databases
                  • Corroboration with industry experts

                  REPORT WRITING

                  Qualitative

                  • Market drivers
                  • Market challenges
                  • Market trends
                  • Five forces analysis

                  Quantitative

                  • Market size and forecast
                  • Market segmentation
                  • Geographical insights
                  • Competitive landscape

                  Interested in this report?

                  Get your sample now to see our research methodology and insights!

                  Download Now

                  Frequently Asked Questions

                  Insurance Claims Services market growth will increase by $ 155.1 bn during 2025-2029.

                  The Insurance Claims Services market is expected to grow at a CAGR of 12.7% during 2025-2029.

                  Insurance Claims Services market is segmented by Type( Property and casualty claims, Health insurance claims, Motor insurance claims, Life insurance claims) End-user( Individual policyholder, Commercial policyholder, Government and public sector)

                  Accenture PLC, Capgemini Services SAS, CGI Inc., Cognizant Technology Solutions Corp., Conduent Inc., DXC Technology Co., Fiserv Inc., HCL Technologies Ltd., Infosys Ltd., International Business Machines Corp., Oracle Corp., Pegasystems Inc., Riddhi Corporate Services Ltd., Sedgwick, Sutherland, Tata Consultancy Services Ltd., WNS Holdings Ltd. are a few of the key vendors in the Insurance Claims Services market.

                  North America will register the highest growth rate of 35% among the other regions. Therefore, the Insurance Claims Services market in North America is expected to garner significant business opportunities for the vendors during the forecast period.

                  US, China, UK, Germany, India, France, Japan, Canada, Brazil, Australia

                  • Urbanization and economic developmentUrbanization and economic development are key drivers for the global insurance claims services market. As urban populations grow and economies develop is the driving factor this market.
                  • the demand for insurance products and services increases is the driving factor this market.
                  • leading to a higher volume of claims.In the Asia-Pacific (APAC) region is the driving factor this market.
                  • urbanization is a significant trend is the driving factor this market.
                  • with over 50% of the total population living in urban areas as of 2024. This shift towards urban living drives the need for various insurance products is the driving factor this market.
                  • including property is the driving factor this market.
                  • health is the driving factor this market.
                  • and motor insurance is the driving factor this market.
                  • as more people and businesses seek to protect their assets and manage risks associated with urban environments.The economic development in China is also contributing to the growth of the global insurance claims services market. In 2023 is the driving factor this market.
                  • the per capita disposable income in China reached approximately $5 is the driving factor this market.
                  • 511 is the driving factor this market.
                  • reflecting a nominal increase of 6.3% year-on-year. This rise in disposable income enables more individuals to afford insurance coverage is the driving factor this market.
                  • leading to an increase in the number of insurance policies and subsequent claims. As more people invest in insurance is the driving factor this market.
                  • the demand for efficient claims processing services grows is the driving factor this market.
                  • driving the market forward.The economic progress in India is notable as well is the driving factor this market.
                  • with the per capita Net National Income (NNI) at constant prices increasing by 35.12% from $935 in 2014-15 to $1 is the driving factor this market.
                  • 264 in 2022-23. This significant growth in income levels allows more individuals and families to purchase insurance products is the driving factor this market.
                  • contributing to the expansion of the global insurance claims services market. As insurance penetration increases is the driving factor this market.
                  • so does the volume of claims is the driving factor this market.
                  • necessitating robust claims management services to handle the demand.In South America is the driving factor this market.
                  • household per capita income in Brazil rose by 11.5% in 2023 is the driving factor this market.
                  • reaching a record high of approximately $373. This economic improvement supports higher insurance adoption rates as more households seek financial protection against various risks. The increase in insurance coverage leads to a higher volume of claims is the driving factor this market.
                  • driving the need for effective claims services.In summary is the driving factor this market.
                  • urbanization and economic development are crucial drivers of the global insurance claims services market. As populations become more urbanized and income levels rise is the driving factor this market.
                  • the demand for insurance products and services increases is the driving factor this market.
                  • leading to a higher volume of claims and the need for efficient claims processing solutions. This trend is evident across various regions is the driving factor this market.
                  • including the APAC region is the driving factor this market.
                  • China is the driving factor this market.
                  • India is the driving factor this market.
                  • and South America is the driving factor this market.
                  • highlighting the global impact of these drivers on the global insurance claims services market. is the driving factor this market.

                  The Insurance Claims Services market vendors should focus on grabbing business opportunities from the Property and casualty claims segment as it accounted for the largest market share in the base year.
                  RIA - Research AI Assistant
                  Ask RIA