Internet Of Things (iot) Enabled Industrial Wearables Market Size 2026-2030
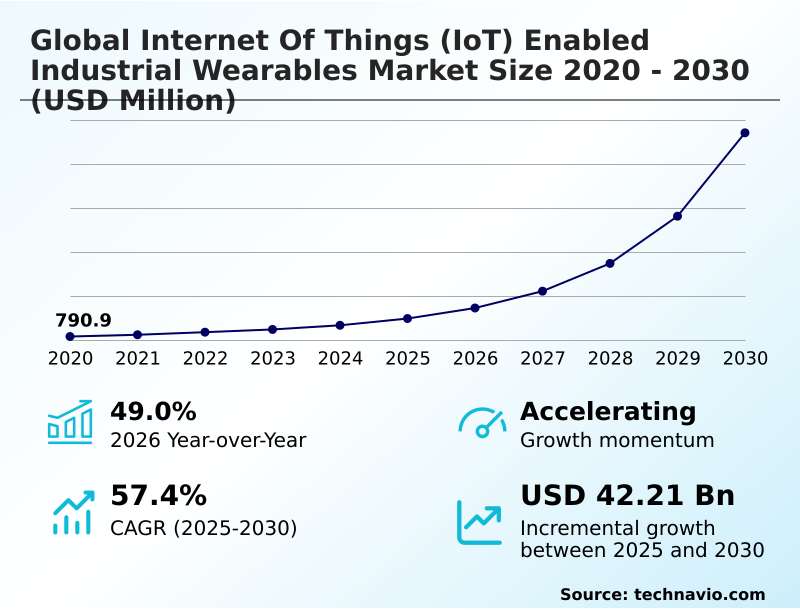
The internet of things (iot) enabled industrial wearables market size is valued to increase by USD 42.21 billion, at a CAGR of 57.4% from 2025 to 2030. Heightened focus on occupational health and safety regulations will drive the internet of things (iot) enabled industrial wearables market.
Major Market Trends & Insights
- North America dominated the market and accounted for a 43% growth during the forecast period.
- By Product - Hand-worn wearables segment was valued at USD 3.05 billion in 2024
- By End-user - Automotive segment accounted for the largest market revenue share in 2024
Market Size & Forecast
- Market Opportunities: USD 46.30 billion
- Market Future Opportunities: USD 42.21 billion
- CAGR from 2025 to 2030 : 57.4%
Market Summary
- The Internet Of Things (IoT) enabled industrial wearables market is evolving from basic monitoring tools to integrated intelligent systems. This shift is driven by the need for enhanced worker safety and operational efficiency in complex industrial environments.
- The adoption of these devices, including augmented reality headsets and biometric sensors, is fueled by stringent workplace safety regulations and the increasing complexity of modern manufacturing and logistics workflows. A key trend shaping the market is the move toward edge computing, which allows for real-time data processing on the device, reducing latency and addressing data privacy concerns.
- For instance, in a large-scale logistics center, workers equipped with smart glasses receive real-time picking instructions and navigation, significantly reducing error rates and improving order fulfillment times. However, the high initial investment in ruggedized hardware and the supporting industrial IoT platform, coupled with challenges in ensuring interoperability and managing workforce resistance to monitoring, remain significant considerations for enterprises.
- Success hinges on creating a connected worker ecosystem that enhances, rather than intrudes upon, the frontline worker's capabilities.
What will be the Size of the Internet Of Things (iot) Enabled Industrial Wearables Market during the forecast period?
Get Key Insights on Market Forecast (PDF) Get Free Sample
How is the Internet Of Things (iot) Enabled Industrial Wearables Market Segmented?
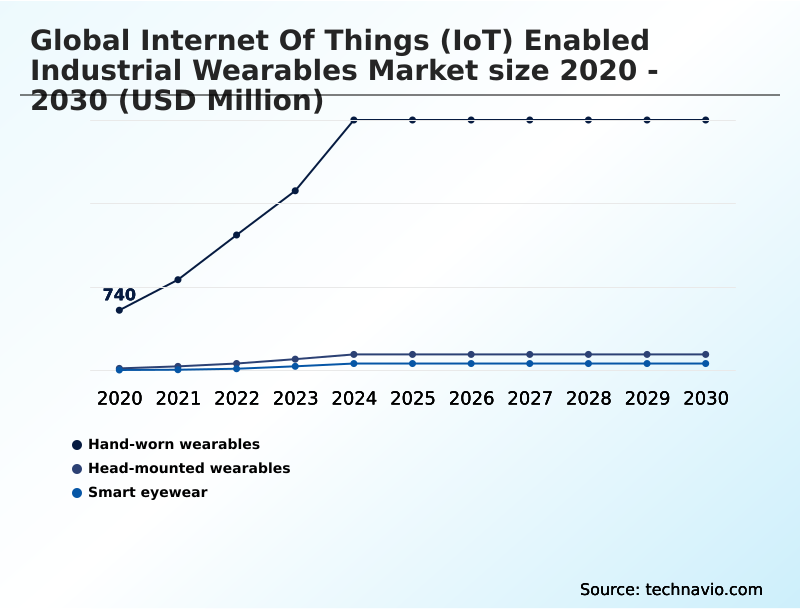
The internet of things (iot) enabled industrial wearables industry research report provides comprehensive data (region-wise segment analysis), with forecasts and estimates in "USD million" for the period 2026-2030, as well as historical data from 2020-2024 for the following segments.
- Product
- Hand-worn wearables
- Head-mounted wearables
- Smart eyewear
- End-user
- Automotive
- Manufacturing
- Aerospace
- Others
- Connectivity
- Bluetooth
- Wi-Fi
- Cellular networks
- NFC
- Geography
- North America
- US
- Canada
- Mexico
- Europe
- Germany
- UK
- France
- APAC
- China
- Japan
- India
- South America
- Brazil
- Argentina
- Middle East and Africa
- Saudi Arabia
- UAE
- South Africa
- Rest of World (ROW)
- North America
By Product Insights
The hand-worn wearables segment is estimated to witness significant growth during the forecast period.
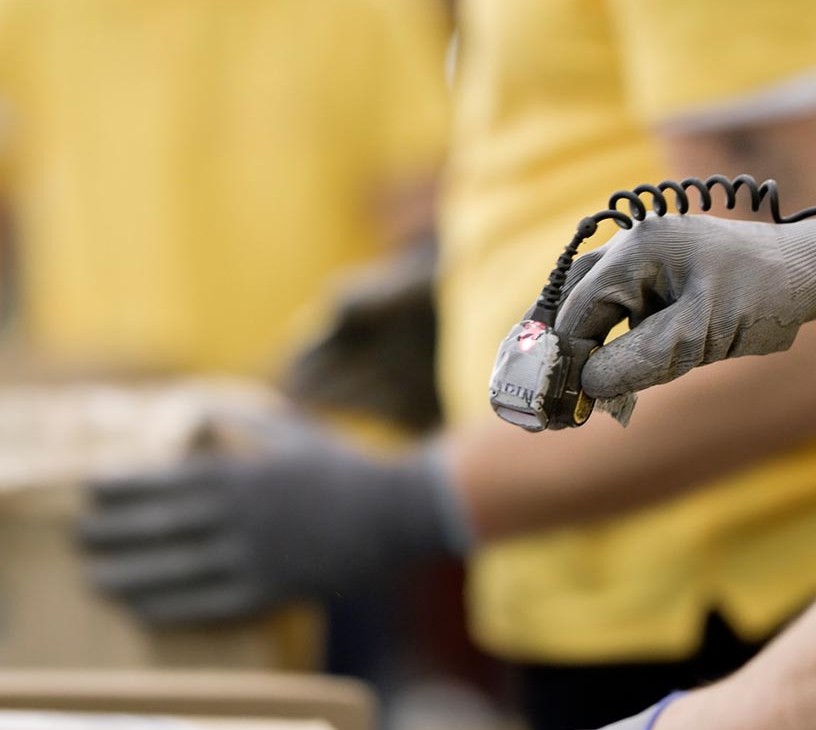
Hand-worn wearables are pivotal for achieving operational efficiency gains in industrial settings. This segment includes devices like the wearable scanning device, which facilitates hands-free data collection and integrates with a manufacturing execution system (MES) for seamless real-time data analytics.
Innovations are leaning toward smart fabrics and incorporating near field communication (nfc) for secure interactions. For instance, a smart glove with computer vision algorithms and object recognition software can validate assembly steps, improving quality control by over 15%.
This hands-free workflow automation also supports geofencing for safety and creates a comprehensive digital audit trail. The evolution of this category supports the broader connected worker ecosystem, where voice-guided headsets further augment worker capabilities without hindering mobility.
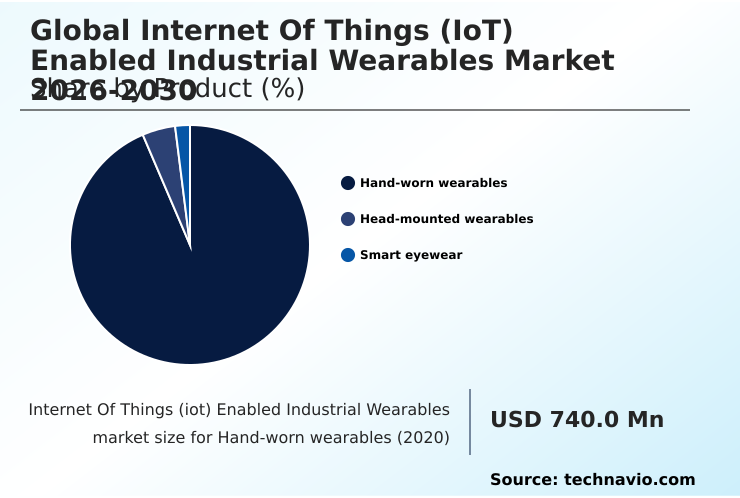
The Hand-worn wearables segment was valued at USD 3.05 billion in 2024 and showed a gradual increase during the forecast period.
Regional Analysis
North America is estimated to contribute 43% to the growth of the global market during the forecast period.Technavio’s analysts have elaborately explained the regional trends and drivers that shape the market during the forecast period.
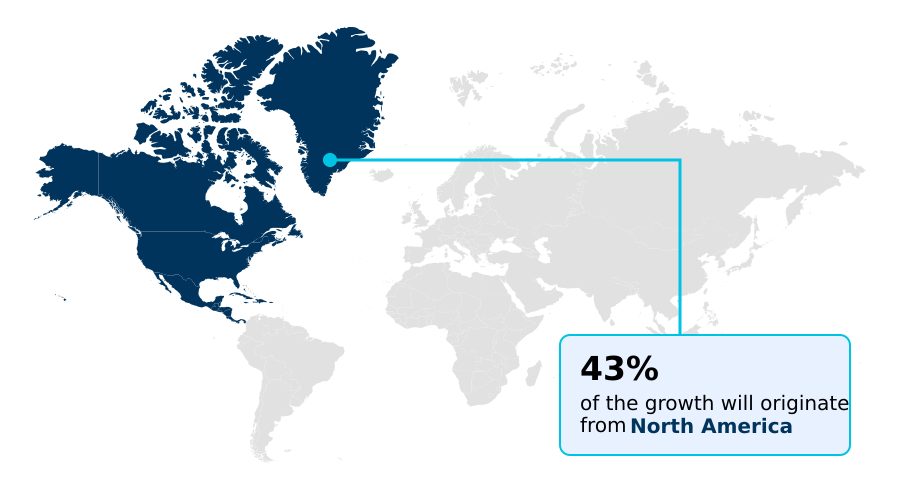
See How Internet Of Things (iot) Enabled Industrial Wearables Market Demand is Rising in North America Get Free Sample
The geographic landscape of the Internet Of Things (IoT) enabled industrial wearables market is led by North America, which accounts for over 40% of new deployments, driven by early adoption in logistics and manufacturing for supply chain optimization.
The APAC region is the fastest-growing market, with adoption rates surging over 60% in key hubs, focusing on industrial digital transformation.
In Europe, the emphasis is on regulatory compliance management under Industry 4.0 frameworks, with a strong focus on high-noise environment communication and frontline worker empowerment.
Across all regions, specialized hardware like ruggedized exoskeleton suits and devices enabling see-what-i-see technology are gaining traction.
Technologies for lone worker protection are critical in the remote operations common in South America and Australia, where thermal imaging wearables are also used for predictive maintenance alerts, delivering significant operational efficiency gains.
Market Dynamics
Our researchers analyzed the data with 2025 as the base year, along with the key drivers, trends, and challenges. A holistic analysis of drivers will help companies refine their marketing strategies to gain a competitive advantage.
- The strategic implementation of IoT enabled industrial wearables is becoming highly specialized, with solutions tailored to specific operational challenges. The use of augmented reality for remote assistance, for instance, is transforming maintenance protocols in heavy industry, allowing on-site technicians to collaborate with off-site experts in real time.
- This is often complemented by thermal imaging smart glasses inspection, which helps in preemptively identifying equipment malfunctions. For workforce well-being, biometric sensors for worker fatigue are crucial in demanding environments, while exoskeletons for ergonomic support are reducing physical strain and injury rates.
- In logistics, wearable technology for logistics optimization is exemplified by wearable scanners for warehouse picking, which have demonstrated efficiency gains nearly double those of traditional handheld systems. The deployment of smart glasses for quality control ensures precision in manufacturing, supported by haptic feedback in smart gloves that confirms task completion.
- On the safety front, real-time gas detection wearables and connected helmets for construction safety are becoming standard. Geofencing for hazardous area alerts provides an additional layer of protection, while voice-controlled headsets in manufacturing enable hands-free operation. The integration of this data is key, with a focus on wearable data integration with MES and leveraging 5G connectivity for wearable video streams.
- However, addressing industrial wearables total cost ownership and data privacy in workplace wearables remains a central challenge.
What are the key market drivers leading to the rise in the adoption of Internet Of Things (iot) Enabled Industrial Wearables Industry?
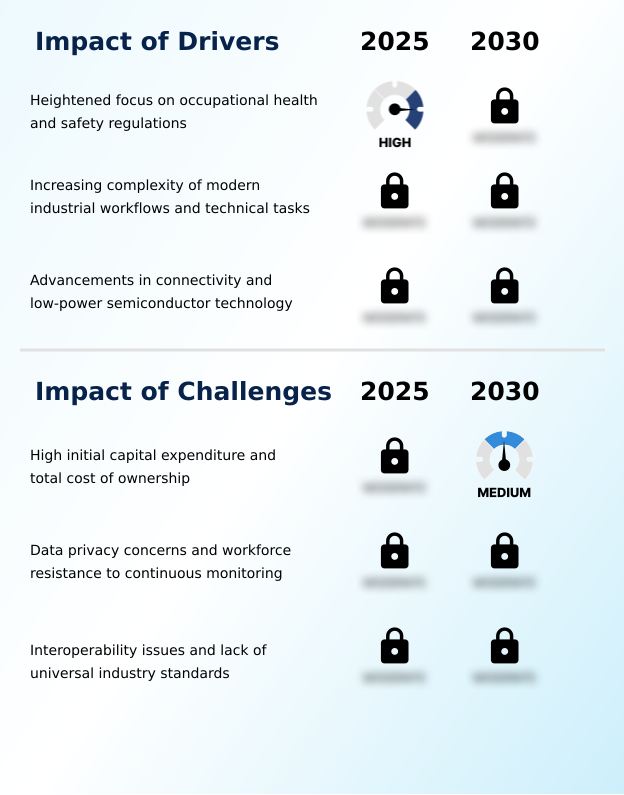
- A heightened focus on occupational health and safety regulations is a key driver for the adoption of IoT enabled industrial wearables.
- The market's growth is primarily driven by an intense focus on workplace safety regulations and the push for zero-accident initiatives.
- This has spurred the adoption of devices with advanced biometric sensors for proactive risk mitigation, with some industries seeing a 15% year-over-year increase in safety-related wearable adoption.
- The use of posture-correcting wearables and devices with haptic feedback helps in musculoskeletal disorder prevention. As industrial workflows become more complex, the need for real-time digital work instructions and hazardous environment monitoring grows.
- Advancements in connectivity, such as private 5G networks, provide the bandwidth to support hundreds of devices simultaneously, enabling reliable real-time location tracking.
- The integration of environmental monitoring sensors and wearable gas detection in connected safety helmets provides a comprehensive safety solution for frontline workers.
What are the market trends shaping the Internet Of Things (iot) Enabled Industrial Wearables Industry?
- The integration of artificial intelligence and machine learning at the edge is an emerging market trend. This development enables real-time data processing directly on wearable devices.
- Key trends are reshaping the Internet Of Things (IoT) enabled industrial wearables market, focusing on enhancing human-machine collaboration and frontline worker productivity. The move toward edge computing is critical, as it enables predictive analysis at the edge, reducing data transmission latency by over 50%.
- This allows assisted reality glasses with a sophisticated voice-operated interface to perform complex tasks like spatial mapping in real time. Another significant trend is the focus on ergonomic form factor, driven by advances in low-power semiconductor technology that improve comfort and encourage industrial wearable adoption.
- Furthermore, the expansion of remote expert assistance is transforming maintenance and training, with some firms cutting machine downtime by up to 25%. This technology-assisted knowledge transfer improves situational awareness enhancement for the entire connected worker ecosystem.
What challenges does the Internet Of Things (iot) Enabled Industrial Wearables Industry face during its growth?
- The high initial capital expenditure and total cost of ownership present a key challenge affecting industry growth.
- Significant challenges hinder widespread adoption in the Internet Of Things (IoT) enabled industrial wearables market, led by data privacy concerns and high total cost of ownership (TCO). The TCO can be two to three times the initial price of the ruggedized hardware, especially when accounting for enterprise resource planning (ERP) integration and an industrial IoT platform.
- Furthermore, workforce resistance monitoring is a critical issue, as over 60% of employees in some surveys express concern over how their data from biometric smart vests is used. A lack of interoperability standards creates fragmented ecosystems, making it difficult to integrate mixed reality headsets featuring digital twin integration with devices using bluetooth low energy or wi-fi 6.
- Enterprises must also invest heavily in cybersecurity protocols for wearables to protect sensitive operational and personal data.
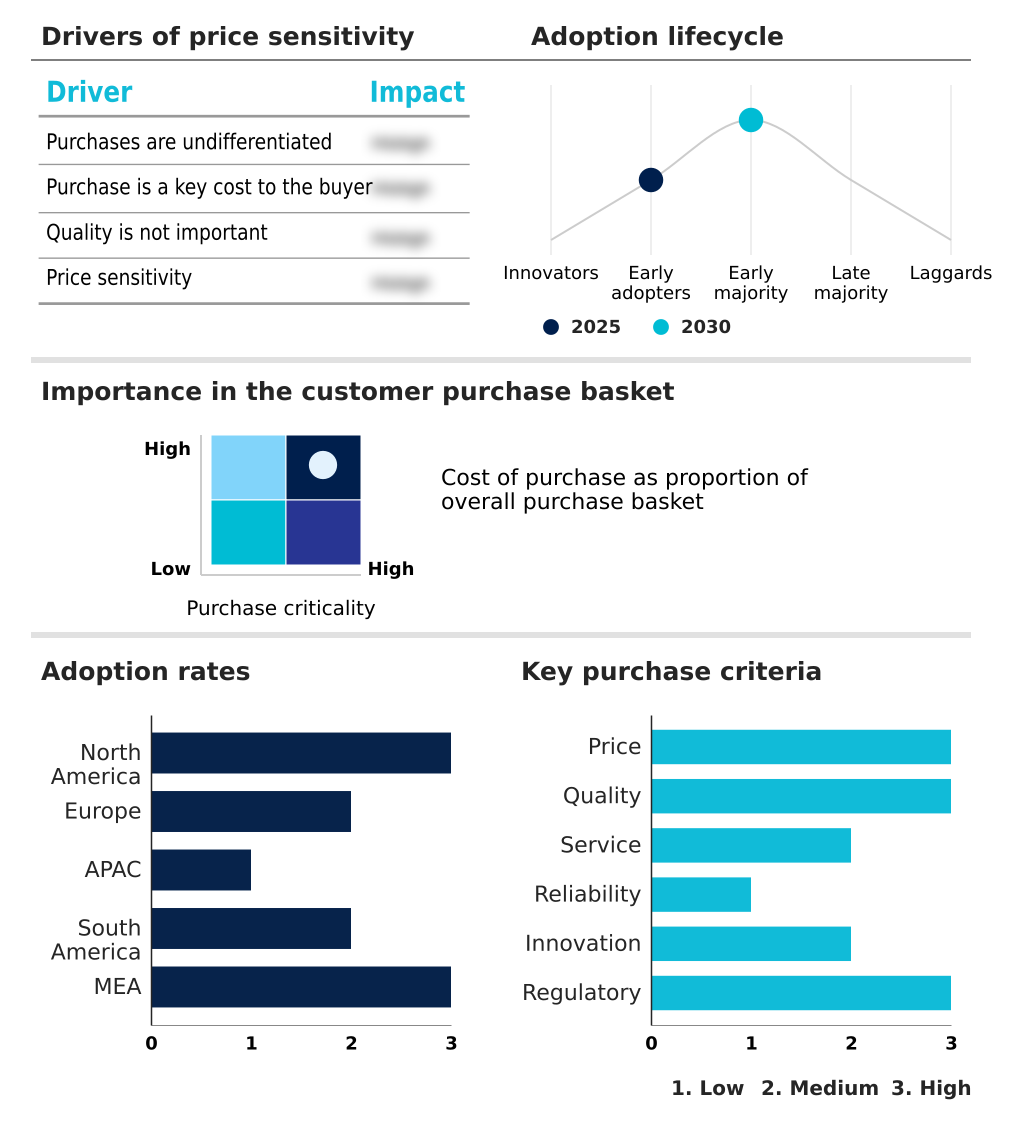
Exclusive Technavio Analysis on Customer Landscape
The internet of things (iot) enabled industrial wearables market forecasting report includes the adoption lifecycle of the market, covering from the innovator’s stage to the laggard’s stage. It focuses on adoption rates in different regions based on penetration. Furthermore, the internet of things (iot) enabled industrial wearables market report also includes key purchase criteria and drivers of price sensitivity to help companies evaluate and develop their market growth analysis strategies.
Customer Landscape of Internet Of Things (iot) Enabled Industrial Wearables Industry
Competitive Landscape
Companies are implementing various strategies, such as strategic alliances, internet of things (iot) enabled industrial wearables market forecast, partnerships, mergers and acquisitions, geographical expansion, and product/service launches, to enhance their presence in the industry.
Aatmunn - Analysis indicates a focus on mixed reality headsets that deliver hands-free holographic guidance, enhancing remote collaboration and operations within regulated industrial environments.
The industry research and growth report includes detailed analyses of the competitive landscape of the market and information about key companies, including:
- Aatmunn
- ASUSTeK Computer Inc.
- Aurora Shenzhen Manufacture Co. Ltd.
- Fujitsu Ltd.
- Generalscan
- Honeywell International Inc.
- Iristick NV
- Magic Leap Inc.
- Microsoft Corp.
- MOKOSmart
- MSA Safety Inc.
- Optinvent
- Panasonic Holdings Corp.
- RealWear Inc.
- Samsung Electronics Co. Ltd.
- Seiko Epson Corp.
- Sony Group Corp.
- ThirdEye Gen Inc.
- Thread In Motion
- Vuzix Corp.
Qualitative and quantitative analysis of companies has been conducted to help clients understand the wider business environment as well as the strengths and weaknesses of key industry players. Data is qualitatively analyzed to categorize companies as pure play, category-focused, industry-focused, and diversified; it is quantitatively analyzed to categorize companies as dominant, leading, strong, tentative, and weak.
Recent Development and News in Internet of things (iot) enabled industrial wearables market
- In October 2024, RealWear Inc. launched its Navigator Z1, an intrinsically safe assisted reality headset designed for frontline professionals in hazardous oil and gas environments, featuring enhanced processing and voice control.
- In January 2025, Vuzix Corp. announced a strategic partnership with a major ERP software provider to integrate its M-Series smart glasses directly into warehouse management system workflows, enabling real-time, hands-free picking instructions.
- In March 2025, a leading private equity firm acquired Iristick NV for an undisclosed sum, signaling strong investor confidence in the market for rugged smart safety glasses aimed at remote assistance.
- In May 2025, Microsoft Corp. confirmed a large-scale deployment of its HoloLens 2 Industrial Edition across a global automotive manufacturer's assembly plants to streamline quality control and training processes.
Dive into Technavio’s robust research methodology, blending expert interviews, extensive data synthesis, and validated models for unparalleled Internet Of Things (iot) Enabled Industrial Wearables Market insights. See full methodology.
| Market Scope | |
|---|---|
| Page number | 305 |
| Base year | 2025 |
| Historic period | 2020-2024 |
| Forecast period | 2026-2030 |
| Growth momentum & CAGR | Accelerate at a CAGR of 57.4% |
| Market growth 2026-2030 | USD 42212.8 million |
| Market structure | Fragmented |
| YoY growth 2025-2026(%) | 49.0% |
| Key countries | US, Canada, Mexico, Germany, UK, France, Italy, Spain, The Netherlands, China, Japan, India, South Korea, Australia, Indonesia, Brazil, Argentina, Chile, Saudi Arabia, UAE, South Africa, Israel and Turkey |
| Competitive landscape | Leading Companies, Market Positioning of Companies, Competitive Strategies, and Industry Risks |
Research Analyst Overview
- The Internet Of Things (IoT) enabled industrial wearables market is characterized by the convergence of advanced hardware and intelligent software to redefine frontline work. The technical landscape is built upon innovations such as low-power semiconductor design, enabling the creation of devices with an ergonomic form factor that can last entire shifts.
- Core technologies like biometric sensors, augmented reality headsets, and haptic feedback systems are no longer niche but are becoming integral to industrial operations. Boardroom decisions are increasingly influenced by the potential of these devices to ensure compliance with workplace safety regulations and mitigate risks.
- For example, the use of posture-correcting wearables and exoskeleton suits directly addresses long-term worker health, impacting insurance costs and productivity. Early adopters of see-what-i-see technology for remote expert assistance have reported up to a 40% reduction in machine downtime.
- The market is also seeing a push toward proactive safety with environmental monitoring sensors, wearable gas detection, and connected safety helmets providing real-time alerts. As private 5G networks become more common, the capacity for real-time location tracking and high-bandwidth digital twin integration will further accelerate adoption.
What are the Key Data Covered in this Internet Of Things (iot) Enabled Industrial Wearables Market Research and Growth Report?
-
What is the expected growth of the Internet Of Things (iot) Enabled Industrial Wearables Market between 2026 and 2030?
-
USD 42.21 billion, at a CAGR of 57.4%
-
-
What segmentation does the market report cover?
-
The report is segmented by Product (Hand-worn wearables, Head-mounted wearables, and Smart eyewear), End-user (Automotive, Manufacturing, Aerospace, and Others), Connectivity (Bluetooth, Wi-Fi, Cellular networks, and NFC) and Geography (North America, Europe, APAC, South America, Middle East and Africa)
-
-
Which regions are analyzed in the report?
-
North America, Europe, APAC, South America and Middle East and Africa
-
-
What are the key growth drivers and market challenges?
-
Heightened focus on occupational health and safety regulations, High initial capital expenditure and total cost of ownership
-
-
Who are the major players in the Internet Of Things (iot) Enabled Industrial Wearables Market?
-
Aatmunn, ASUSTeK Computer Inc., Aurora Shenzhen Manufacture Co. Ltd., Fujitsu Ltd., Generalscan, Honeywell International Inc., Iristick NV, Magic Leap Inc., Microsoft Corp., MOKOSmart, MSA Safety Inc., Optinvent, Panasonic Holdings Corp., RealWear Inc., Samsung Electronics Co. Ltd., Seiko Epson Corp., Sony Group Corp., ThirdEye Gen Inc., Thread In Motion and Vuzix Corp.
-
Market Research Insights
- The market for Internet Of Things (IoT) enabled industrial wearables is defined by a push for greater frontline worker productivity and tangible operational efficiency gains. The industrial wearable adoption is accelerating, driven by the need for technology-assisted knowledge transfer in an era of a shifting workforce.
- Deployments are demonstrating clear ROI, with some enterprises reporting up to a 30% reduction in errors for complex tasks and a 20% improvement in inspection times. This progress is closely tied to better human-machine collaboration, which enhances situational awareness enhancement.
- As organizations pursue industrial digital transformation, these devices become critical for enabling a connected worker ecosystem, moving beyond simple monitoring to active operational improvement and proactive risk mitigation, ultimately supporting zero-accident initiatives.
We can help! Our analysts can customize this internet of things (iot) enabled industrial wearables market research report to meet your requirements.
 RIA -
RIA - 
