
UK IoT Market Size 2025-2029
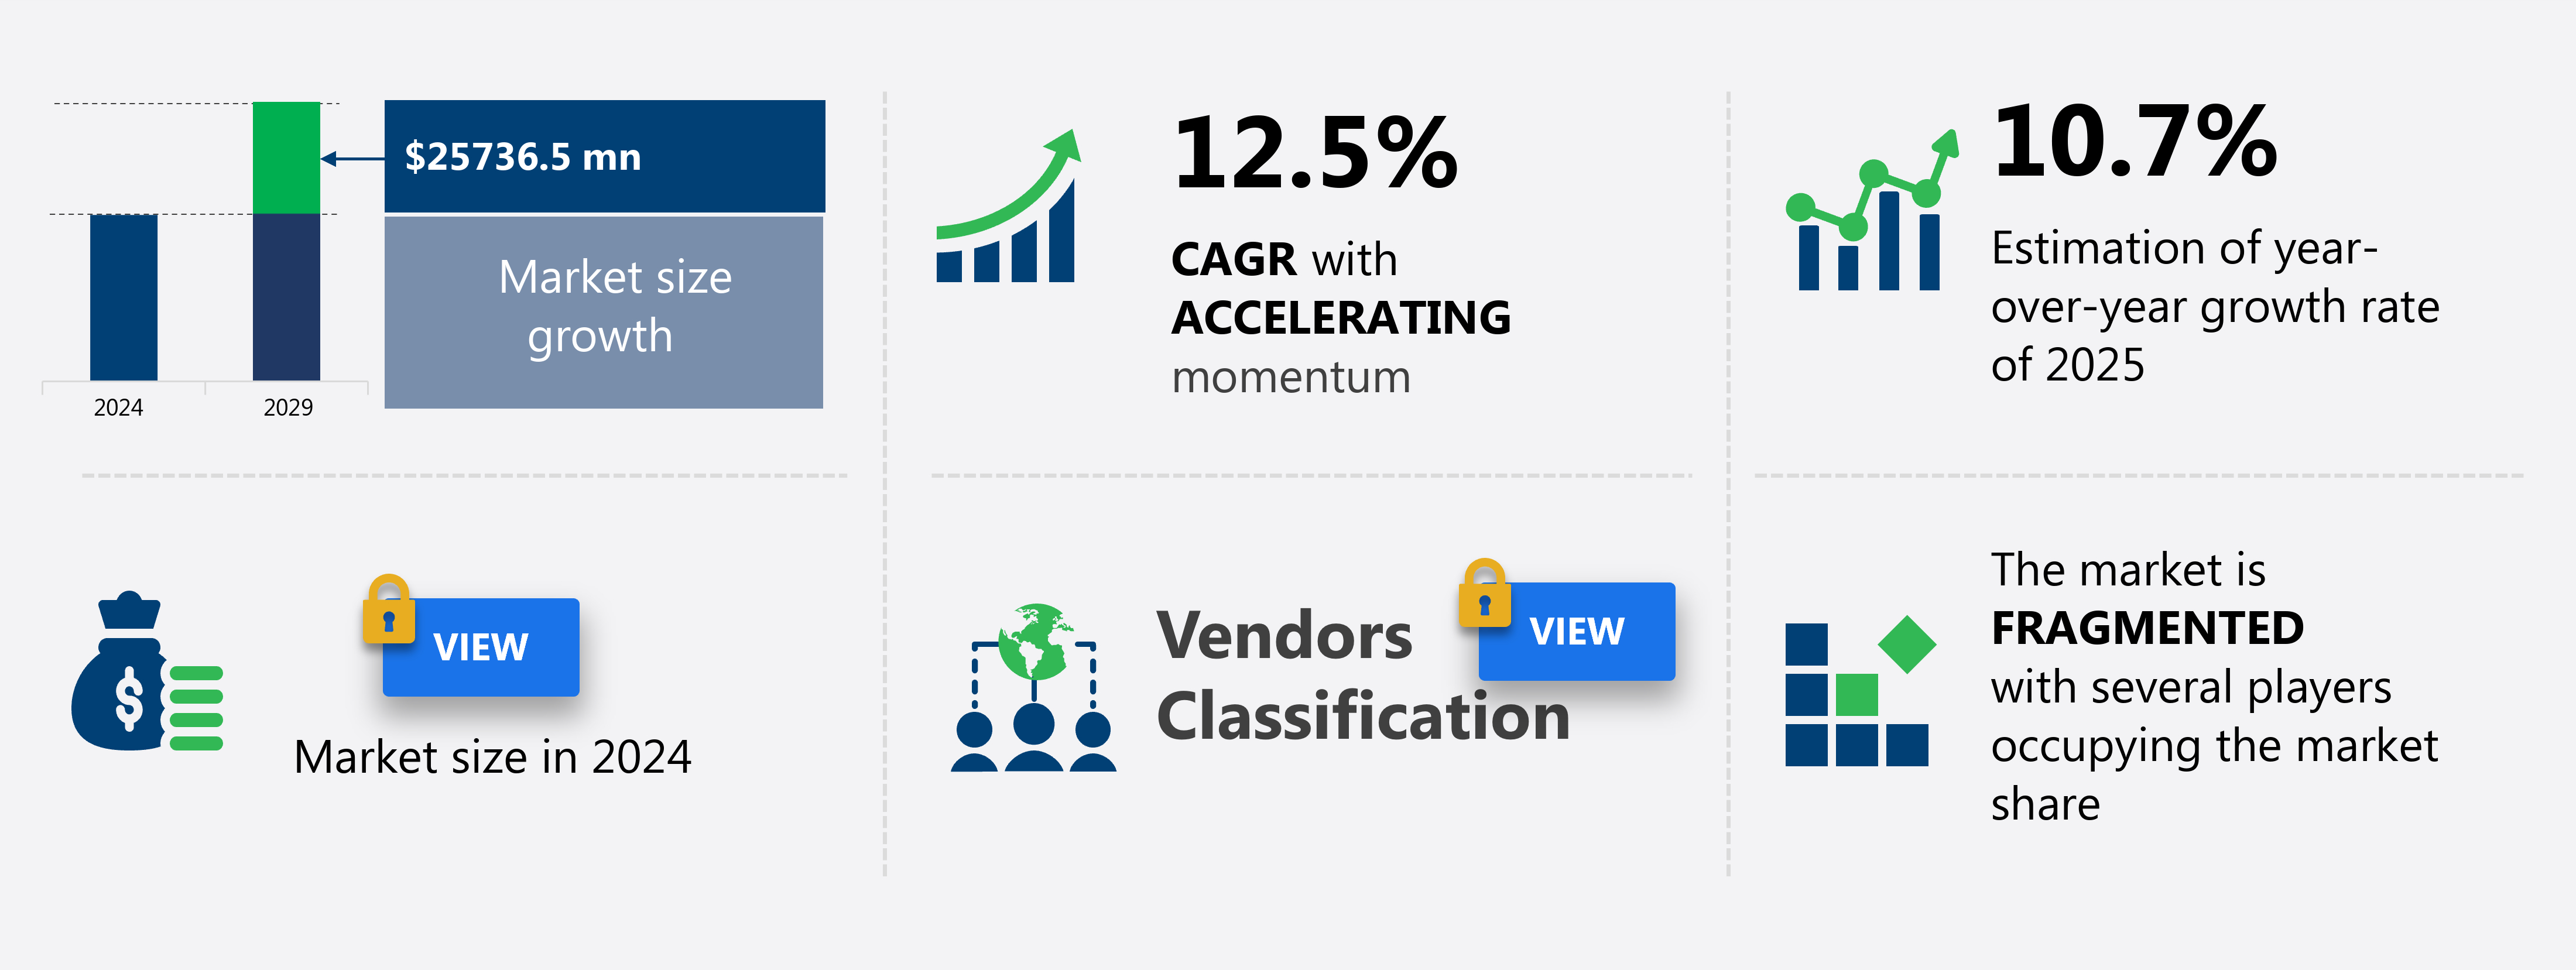
The IoT market size in UK is forecast to increase by USD 25.74 billion at a CAGR of 12.5% between 2024 and 2029.
- The Internet of Things (IoT) market is experiencing significant growth, driven by the implementation of Industry 4.0 and the increasing diversity in IoT standards. Industry 4.0, the fourth industrial revolution, is transforming industries by integrating physical and digital systems, creating new opportunities for IoT devices. Meanwhile, the growing diversity in IoT standards presents both challenges and opportunities, as businesses navigate the complex landscape of interoperability and compatibility. However, the lack of awareness about IoT devices among some organizations and individuals may hinder market growth. Advancements in technologies such as 5G networks, edge computing, big data, AI, and Industry 4.0 are transforming the IoT landscape. Moreover, the expansion of mobile network infrastructure and the increasing adoption of cloud computing in North America are major drivers for the market.
- These trends and challenges highlight the need for a deep understanding of the IoT market dynamics, which this market trends and analysis report aims to provide. By exploring the key drivers, trends, and challenges shaping the IoT market, businesses can make informed decisions and capitalize on the opportunities presented by this rapidly evolving technology.
What will be the Size of the market During the Forecast Period?
-
The Internet of Things (IoT) market is experiencing significant growth and innovation, with various sectors integrating IoT solutions to enhance operations and customer experiences. Smart building technologies are revolutionizing commercial real estate, while connected customer experiences are transforming retail and education. IoT solutions providers are addressing risk management in smart city infrastructure, enabling remote asset tracking in connected manufacturing, and providing predictive analytics for precision agriculture and supply chain visibility. The IoT ecosystem is expanding, with industrial IoT driving digital transformation in industries, building automation systems optimizing business processes, and telehealth solutions improving healthcare delivery. Renewable energy integration, personalized learning, connected logistics, and fraud detection are among the numerous applications of IoT.
IoT implementation requires robust security solutions, with IoT strategy becoming a priority for businesses in finance, retail, and education. Smart home automation, smart city infrastructure, and smart energy grids are redefining urban living, while IoT in agriculture and connected car technology are revolutionizing rural and transportation sectors, respectively.
How is this market segmented and which is the largest segment?
The market research report provides comprehensive data (region-wise segment analysis), with forecasts and estimates in "USD million" for the period 2025-2029, as well as historical data from 2019-2023 for the following segments.
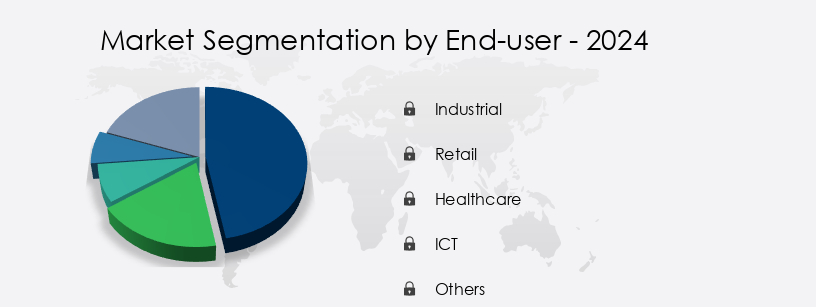
- End-user
- Industrial
- Retail
- Healthcare
- ICT
- Others
- Technology
- RFID
- Sensors
- NFC
- Cloud services
- Others
- Component
- Hardware
- Software
- Services
- Deployment
- Cloud-based
- On-premises
- Geography
- Europe
- UK
- Europe
By End-user Insights
- The industrial segment is estimated to witness significant growth during the forecast period.
In the dynamic IoT market, various sectors are leveraging this technology to enhance productivity and gain a competitive edge. The industrial segment holds the largest market share, with the integration of location-based sensors for inventory management being a major trend. Globally, manufacturers are utilizing IoT to optimize their production processes through predictive maintenance and real-time data analysis. IoT applications in industries span across power management, quality control, and smart logistics. Software development enables machines and devices to connect to the Internet, while firmware updates ensure seamless functionality. Predictive maintenance and energy management are crucial aspects of IoT implementation in industries.
Edge computing and data visualization facilitate efficient data processing and analysis. Data privacy and network security are essential considerations in the implementation of IoT systems. Industrial automation, machine learning, and artificial intelligence are key technologies driving the industrial IoT market. IoT hubs and connectivity protocols facilitate seamless communication between devices and systems. Sensor networks and connected devices enable data collection and analysis in real-time. In the realm of industrial IoT, the focus is on optimizing supply chain operations, enhancing energy management, and improving overall efficiency.
Get a glance at the market report of share of various segments Request Free Sample
Market Dynamics
Our UK Iot Market researchers analyzed the data with 2024 as the base year, along with the key drivers, trends, and challenges. A holistic analysis of drivers will help companies refine their marketing strategies to gain a competitive advantage.
What are the key market drivers leading to the rise in adoption of UK IoT Market?
- Industry 4.0 implementation is the key driver of the market. The Internet of Things (IoT) market in the UK is experiencing significant growth as businesses adopt Industry 4.0 to automate industrial processes and boost efficiency. IoT solutions, such as predictive maintenance systems and real-time data analytics, enable manufacturers to enhance productivity, resulting in a 30% increase in operational efficiency. Artificial intelligence (AI) integrated IoT sensors identify equipment anomalies to prevent failures, ensuring uninterrupted production. Additionally, connected logistics optimize inventory control and streamline distribution networks. The integration of APIs and edge computing facilitates over-the-air updates and data visualization, allowing businesses to make informed decisions based on real-time data.
-
Data privacy remains a priority, with low-power communication and data encryption ensuring secure data transmission. The UK IoT market's expansion is expected to continue as businesses prioritize digital transformation and seek to leverage the benefits of Industry 4.0.
What are the market trends shaping the UK IoT Market?
- Growing diversity in IoT standards is the upcoming trend in the market. The Internet of Things (IoT) market is experiencing significant growth as various industries embrace the integration of smart technologies. Hardware design companies, service providers, retailers, enterprise technology firms, innovative startups, and chipset manufacturers are collaborating to advance IoT through open-source software projects, such as AllJon. This platform, developed by Intel, Samsung, Broadcom, Atmel, and Dell, enables interoperability among IoT devices and applications across industries, including smart cities, healthcare, agriculture, and energy management.
-
By utilizing real-time data from connected devices and sensor networks, analytics dashboards provide valuable insights for businesses, enhancing decision-making processes. The Open Interconnect Consortium's primary goal is to establish a standard for interoperability, ensuring seamless communication and collaboration among IoT devices, regardless of brand or category.
What challenges doesUK Iot Market face during the growth?
- Lack of awareness about IoT devices is a key challenge affecting the market growth. The Internet of Things (IoT) market is experiencing significant growth, driven by advancements in machine learning, wireless communication, and sensor fusion. Companies are investing in IoT hubs to manage and connect various embedded systems, leading to supply chain optimization and improved device management. IoT applications, such as connected cars, are emphasizing connectivity protocols for seamless communication. However, the market is still in its development stage, with a lack of standardization posing a challenge. Consumers are cautious about the value proposition of IoT solutions, despite increasing awareness through marketing efforts by leading technology companies. As a result, the market dynamics are complex, requiring a deep understanding of the technology and its potential benefits.
-
Machine learning algorithms are being integrated into IoT devices to enhance their functionality and improve user experience. The IoT market is poised for growth, but requires continued investment in standardization and consumer education to fully realize its potential.
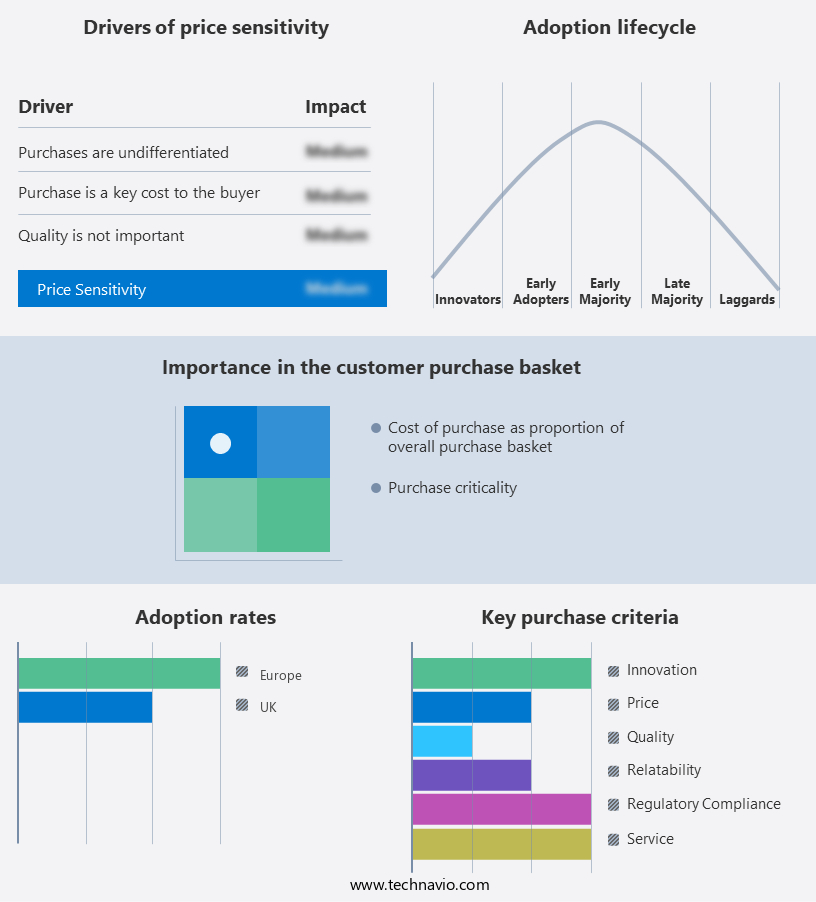
Exclusive Customer Landscape
The market forecasting report includes the adoption lifecycle of the market, covering from the innovator's stage to the laggard's stage. It focuses on adoption rates in different regions based on penetration. Furthermore, the market report also includes key purchase criteria and drivers of price sensitivity to help companies evaluate and develop their market growth analysis strategies.
Customer Landscape
Key Companies & Market Insights
Companies are implementing various strategies, such as strategic alliances, market forecast , partnerships, mergers and acquisitions, geographical expansion, and product/service launches, to enhance their presence in the market.
8power Ltd. - This organization specializes in Internet of Things (IoT) technology, providing innovative solutions for energy harvesting through products like Vibration Energy Harvesters.
The market research and growth report includes detailed analyses of the competitive landscape of the market and information about key companies, including:
- 8power Ltd.
- Adaptive Wireless Solutions Ltd.
- Altiux Innovations Pvt. Ltd.
- Amazon.com Inc.
- Apple Inc.
- Arm Ltd.
- AT and T Inc.
- Cognizant Technology Solutions Corp.
- Eseye Ltd.
- EVRYTHNG Ltd.
- General Electric Co.
- Hewlett Packard Enterprise Co.
- Intel Corp.
- Microsoft Corp.
- Oracle Corp.
- Robert Bosch GmbH
- Toshiba Corp.
- Waymo LLC
Qualitative and quantitative analysis of companies has been conducted to help clients understand the wider business environment as well as the strengths and weaknesses of key market players. Data is qualitatively analyzed to categorize companies as pure play, category-focused, industry-focused, and diversified; it is quantitatively analyzed to categorize companies as dominant, leading, strong, tentative, and weak.
Recent Development and News in IoT Market In UK
- In February 2023, IBM announced the launch of its new Watson IoT Data Catalog, which uses AI and machine learning to help businesses manage and analyze IoT data more effectively (IBM Press Release). This development signifies a significant advancement in IoT data management and analytics.
- In May 2024, Microsoft and Amazon Web Services (AWS) formed a strategic partnership to integrate their IoT services, allowing businesses to use both Microsoft Azure and AWS IoT Core together (Microsoft News Center). This collaboration represents a major shift in the IoT market, as two leading tech giants join forces to offer a more comprehensive IoT solution.
- In August 2024, Siemens completed the acquisition of Sensix, a Belgian IoT startup specializing in wireless sensor technology (Siemens Press Release). This acquisition marks a key expansion for Siemens in the IoT sector, providing them with innovative technology and a stronger presence in the European market.
Research Analyst Overview
The Internet of Things (IoT) market continues to evolve, with new applications and technologies shaping its dynamics. Remote monitoring and API integration are increasingly crucial, enabling real-time data exchange between connected devices and systems. Artificial intelligence (AI) and data analytics are key components, providing predictive capabilities and insights for various sectors. Over-the-air updates ensure seamless integration of new features and functionalities. Edge computing and data visualization facilitate faster decision-making, while data privacy remains a top concern, necessitating robust security measures. Low-power communication protocols and industrial automation are transforming industries, from manufacturing to agriculture. Machine learning and IoT hubs optimize supply chain operations, and standards development ensures interoperability. Similarly, industrial IoT (IIoT) applications include smart manufacturing, infrastructure, and transportation, relying on IOT connectivity and analytics platforms.
Embedded systems and hardware design advancements fuel the growth of wearable technology and connected cars. Sensor fusion and device management enable network security, ensuring the integrity of data transmitted. Wireless communication and connectivity protocols enable smart homes, cities, and healthcare, enhancing user experience and interface. Energy management and real-time data analytics dashboard are essential for optimizing resource utilization. The ongoing evolution of IoT continues to reshape industries and create new opportunities.
|
Market Scope |
|
|
Report Coverage |
Details |
|
Page number |
190 |
|
Base year |
2024 |
|
Historic period |
2019-2023 |
|
Forecast period |
2025-2029 |
|
Growth momentum & CAGR |
Accelerate at a CAGR of 12.5% |
|
Market growth 2025-2029 |
USD 25736.5 million |
|
Market structure |
Fragmented |
|
YoY growth 2024-2025(%) |
10.7 |
|
Key countries |
UK |
|
Competitive landscape |
Leading Companies, Market Positioning of Companies, Competitive Strategies, and Industry Risks |
What are the Key Data Covered in this Market Research and Growth Report?
- CAGR of the market during the forecast period
- Detailed information on factors that will drive the market growth and forecasting between 2025 and 2029
- Precise estimation of the size of the market and its contribution of the market in focus to the parent market
- Accurate predictions about upcoming market growth and trends and changes in consumer behaviour
- Growth of the market across UK
- Thorough analysis of the market's competitive landscape and detailed information about companies
- Comprehensive analysis of factors that will challenge the growth of market companies
We can help! Our analysts can customize this market research report to meet your requirements. Get in touch
 RIA -
RIA - 
