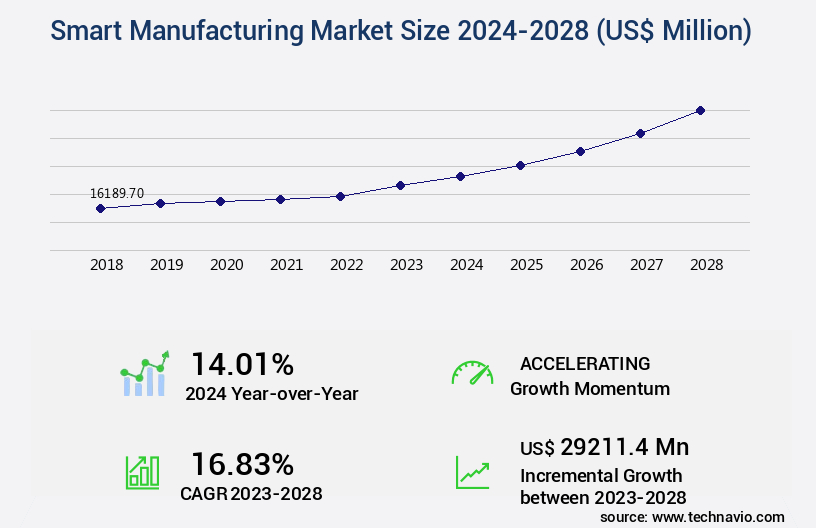
Smart Manufacturing Market Size 2024-2028
The smart manufacturing market size is valued to increase USD 29.21 billion, at a CAGR of 16.83% from 2023 to 2028. Need for simplification of complex manufacturing activities will drive the smart manufacturing market.
Major Market Trends & Insights
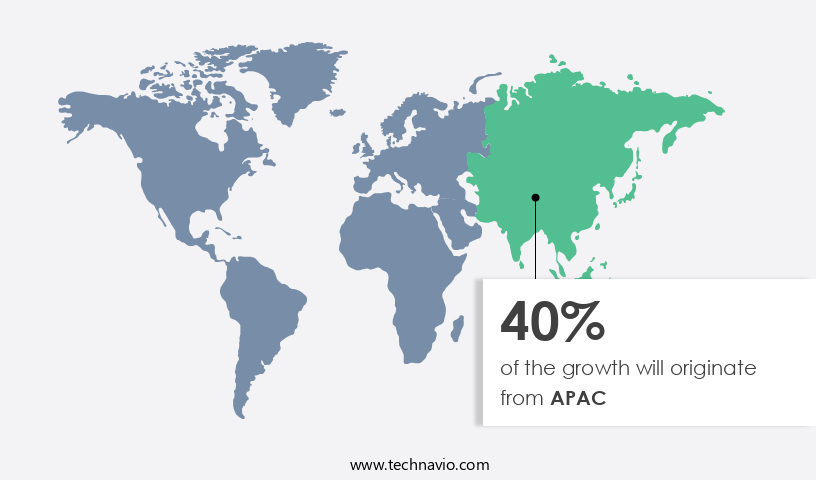
- APAC dominated the market and accounted for a 40% growth during the forecast period.
- By Industry Application - Process segment was valued at USD 9.05 billion in 2022
- By Technology - Human-machine interface segment accounted for the largest market revenue share in 2022
Market Size & Forecast
- Market Opportunities: USD 233.84 million
- Market Future Opportunities: USD 29211.40 million
- CAGR : 16.83%
- APAC: Largest market in 2022
Market Summary
- The market represents a dynamic and evolving landscape shaped by advanced technologies and innovative applications. Core technologies, such as Artificial Intelligence (AI) and the Internet of Things (IoT), are revolutionizing manufacturing processes by enabling real-time monitoring, predictive maintenance, and automated production. According to recent reports, the global AI in manufacturing market is projected to reach a 30% compound annual growth rate (CAGR) by 2026. Smart manufacturing applications span various sectors, including automotive, electronics, and healthcare, with predictive maintenance leading the adoption rate at over 50%. Service types and product categories, such as consulting and software solutions, are essential components of this market, ensuring seamless implementation and optimization of smart manufacturing systems.
- Regulations, particularly those addressing data privacy and security, are increasingly influencing the market, with the European Union's General Data Protection Regulation (GDPR) being a notable example. Regional markets, including North America and Asia Pacific, are experiencing significant growth due to factors like technological advancements and favorable government initiatives. Despite these opportunities, challenges such as high implementation costs and data security concerns persist. However, the need for simplification of complex manufacturing activities and the potential for increased efficiency and productivity make the market an attractive proposition for businesses seeking to remain competitive in the digital age.
What will be the Size of the Smart Manufacturing Market during the forecast period?
Get Key Insights on Market Forecast (PDF) Request Free Sample
How is the Smart Manufacturing Market Segmented and what are the key trends of market segmentation?
The smart manufacturing industry research report provides comprehensive data (region-wise segment analysis), with forecasts and estimates in "USD million" for the period 2024-2028, as well as historical data from 2018-2022 for the following segments.
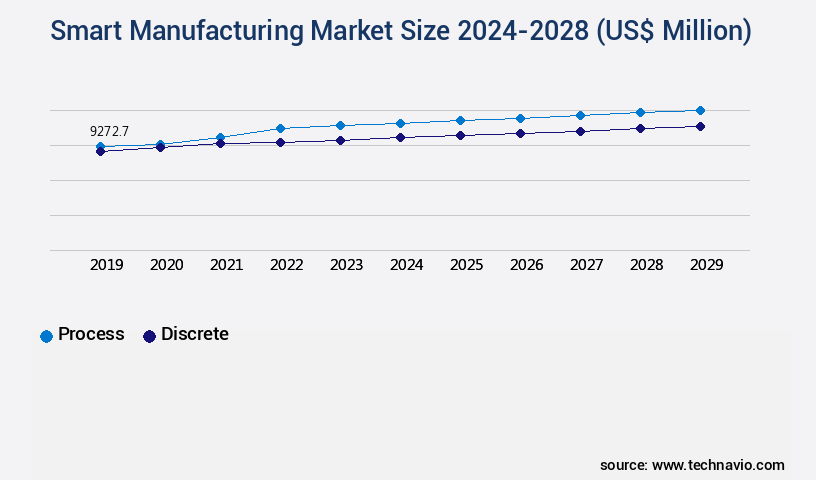
- Industry Application
- Process
- Discrete
- Technology
- Human-machine interface
- Manufacturing execution system
- Plant asset management
- Warehouse management system
- Geography
- North America
- US
- Europe
- Germany
- UK
- APAC
- China
- Japan
- Rest of World (ROW)
- North America
By Industry Application Insights
The process segment is estimated to witness significant growth during the forecast period.
In the dynamic and evolving landscape of modern manufacturing, the integration of advanced technologies is revolutionizing industries, driving growth and enhancing operational efficiency. According to recent reports, the process industry segment dominates The market, holding a significant share in 2023. This segment, further divided into sub-segments such as pharmaceuticals, mining and metals, energy and power, chemicals, pulp and paper, and oil and gas, is witnessing substantial growth. Technologies like Industrial Internet of Things (IIoT), data analytics, predictive maintenance, and digital thread implementation are transforming these industries. Process industries, characterized by continuous or batch production, are reaping the benefits of these advancements, including cost savings, increased scalability, and higher-quality products.
IIoT, for instance, enables data-driven decision-making, while data analytics and predictive maintenance models optimize processes and minimize downtime. Real-time data analytics and digital twin technology facilitate efficient production line management, ensuring energy efficiency measures and enhancing overall productivity. Moreover, the implementation of blockchain technology, edge computing deployment, lean manufacturing principles, and six sigma methodologies further streamlines operations and strengthens cybersecurity protocols. Human-machine interface (HMI) and inventory management systems provide additional advantages, allowing for seamless integration and improved supply chain optimization. Looking ahead, the market is expected to continue its growth trajectory, with numerous opportunities arising from the adoption of additive manufacturing processes, machine learning algorithms, and industrial IoT platforms.
The integration of these technologies is set to revolutionize manufacturing processes, leading to increased process optimization techniques and enhanced quality control systems. In summary, the market is undergoing significant transformation, with various industries embracing advanced technologies to drive growth, improve efficiency, and enhance overall productivity. The process industry, with its continuous and batch production processes, is at the forefront of this revolution, leading to substantial growth and numerous opportunities for businesses.
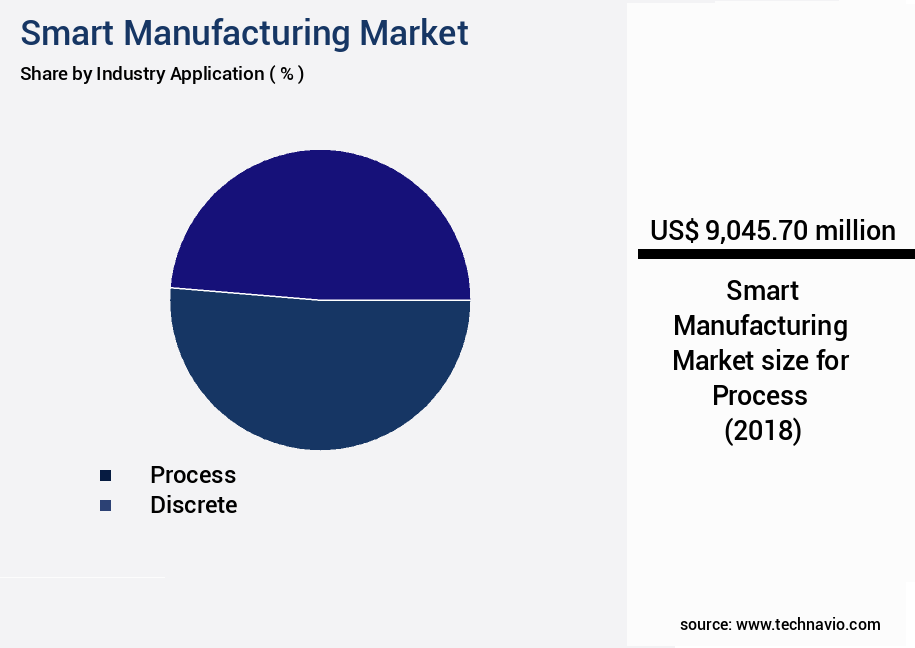
The Process segment was valued at USD 9.05 billion in 2018 and showed a gradual increase during the forecast period.
Regional Analysis
APAC is estimated to contribute 40% to the growth of the global market during the forecast period.Technavio’s analysts have elaborately explained the regional trends and drivers that shape the market during the forecast period.
See How Smart Manufacturing Market Demand is Rising in APAC Request Free Sample
The market in APAC is experiencing significant growth, driven primarily by the implementation of Industry 4.0 technologies such as IoT, cloud computing, and automation in the industrial sector. One of the key industries expected to fuel this growth is oil and gas, with several new chemical and petrochemical projects planned in the region. For instance, Haldia Petrochemicals Limited announced a USD10 billion investment for the establishment of propylene, phenol, and acetone plants in October 2023. This investment, along with others like it, is anticipated to increase the demand for industrial automation, leading to the expansion of the market in APAC.
This market growth is a result of the increasing adoption of advanced technologies to streamline manufacturing processes and enhance operational efficiency.
Market Dynamics
Our researchers analyzed the data with 2023 as the base year, along with the key drivers, trends, and challenges. A holistic analysis of drivers will help companies refine their marketing strategies to gain a competitive advantage.
The market is experiencing robust growth as businesses increasingly implement advanced process control systems to optimize production lines and enhance efficiency. Machine learning algorithms are deployed for predictive maintenance, enabling early identification and resolution of potential issues, reducing downtime and improving overall equipment effectiveness. Digital twin technology is integrated into production lines, providing real-time insights into manufacturing processes and enabling remote monitoring and control. Cloud-based manufacturing execution systems are gaining traction, offering flexibility and scalability, while AI algorithms are used to optimize supply chain operations, reducing lead times and improving inventory management. Robotics and automation are leveraged for process improvement, with human-machine interfaces designed to facilitate seamless interaction between operators and machines.
Real-time data analytics is enhancing production line efficiency, enabling businesses to make data-driven decisions and respond quickly to market demands. Quality control is improved through automated inspection, while cybersecurity protocols are implemented for industrial IoT devices to ensure data security and protect against potential threats. Augmented reality is adopted for training and maintenance, providing workers with real-time guidance and improving knowledge transfer. Virtual reality is utilized for manufacturing simulation, enabling businesses to test and optimize production processes before implementation. Data visualization dashboards are used to improve production planning, providing a clear and actionable view of manufacturing processes. Big data from industrial IoT sensors is managed using edge computing for real-time data processing, while blockchain technology is integrated for supply chain traceability, ensuring transparency and accountability.
Artificial intelligence is applied to factory automation, improving decision-making and enabling predictive maintenance. Six sigma methodologies and lean manufacturing principles are employed to reduce waste and improve manufacturing processes. Compared to traditional manufacturing methods, the adoption of smart manufacturing technologies is resulting in significant improvements in efficiency, productivity, and quality. For instance, more than 80% of new product developments in the automotive industry now incorporate smart manufacturing technologies, compared to less than 40% a decade ago. This shift towards smart manufacturing is set to continue, as businesses seek to remain competitive in an increasingly digital world.
What are the key market drivers leading to the rise in the adoption of Smart Manufacturing Industry?
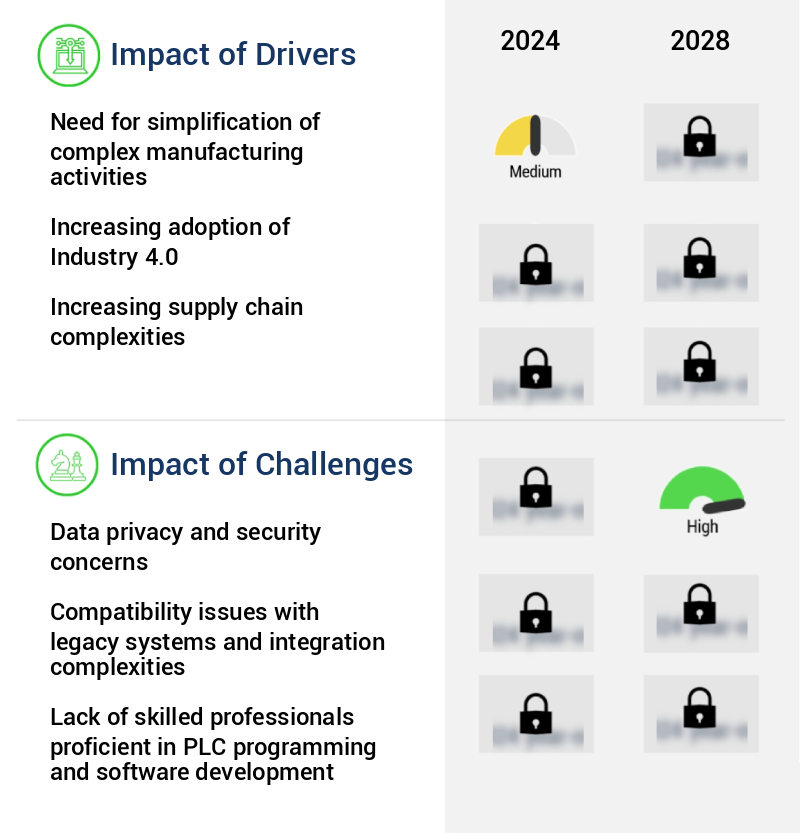
- The necessity of simplifying intricate manufacturing processes serves as the primary market catalyst.
- In the ever-evolving industrial landscape, managing plant assets has emerged as a critical priority for operators. The production process has grown intricate due to the customized manufacturing of various products in response to fluctuating demand. This intricate relationship between production equipment, inventory, and support systems in diverse industries, such as oil and gas, food and beverage, and water treatment, necessitates advanced tools and mechanisms. Industrial automation solutions, including SCADA, distributed control systems (DCS), and programmable logic controllers (PLC), play a pivotal role in overseeing multiple complex processes, operations, and systems within industrial plants.
- By leveraging these technologies, industrial operators can effectively monitor and optimize their asset-intensive processes, ensuring efficiency and productivity in the face of complex production models.
What are the market trends shaping the Smart Manufacturing Industry?
- The emergence of Industrial Internet of Things (IIoT) represents the latest market trend. This technological advancement is set to revolutionize industries by enhancing operational efficiency and productivity.
- The Industrial Internet of Things (IIoT) and technological advancements have significantly boosted the implementation of smart machines across both industrial and service sectors. The increasing popularity and utilization of intelligent devices, wireless connectivity, and cloud technology are anticipated to expand the scope and functionality of smart machines in the coming years. In response to heightened competition, companies are introducing services and control modules that enable remote management through smart devices and Wi-Fi technology.
- These innovations offer increased flexibility and efficiency, allowing a single operator to manage multiple machines concurrently. The adoption of smart machines is a testament to the continuous evolution of technology and its applications in various industries.
What challenges does the Smart Manufacturing Industry face during its growth?
- Data privacy and security concerns represent a significant challenge to the industry's growth, as organizations must balance the need to collect and utilize data with the imperative to protect sensitive information from unauthorized access or breaches.
- In the realm of industrial automation, the integration of smart manufacturing solutions brings about significant productivity enhancements and efficiency improvements. However, this increased reliance on automated systems introduces new challenges, particularly in the realm of cyber security. Industries managing critical infrastructure, such as oil and gas, power, and water and wastewater, are particularly vulnerable to cyberattacks. Data breaches in these sectors can have severe consequences, leading to operational failures and unethical data usage or manipulation.
- For instance, in the oil and gas industry, cyberattacks on infrastructure components like pipelines, drilling rigs, and refinery processes can cause operational disruptions and compromise sensitive data. The evolving nature of cyber threats necessitates constant vigilance and proactive measures to safeguard against potential risks.
Exclusive Technavio Analysis on Customer Landscape
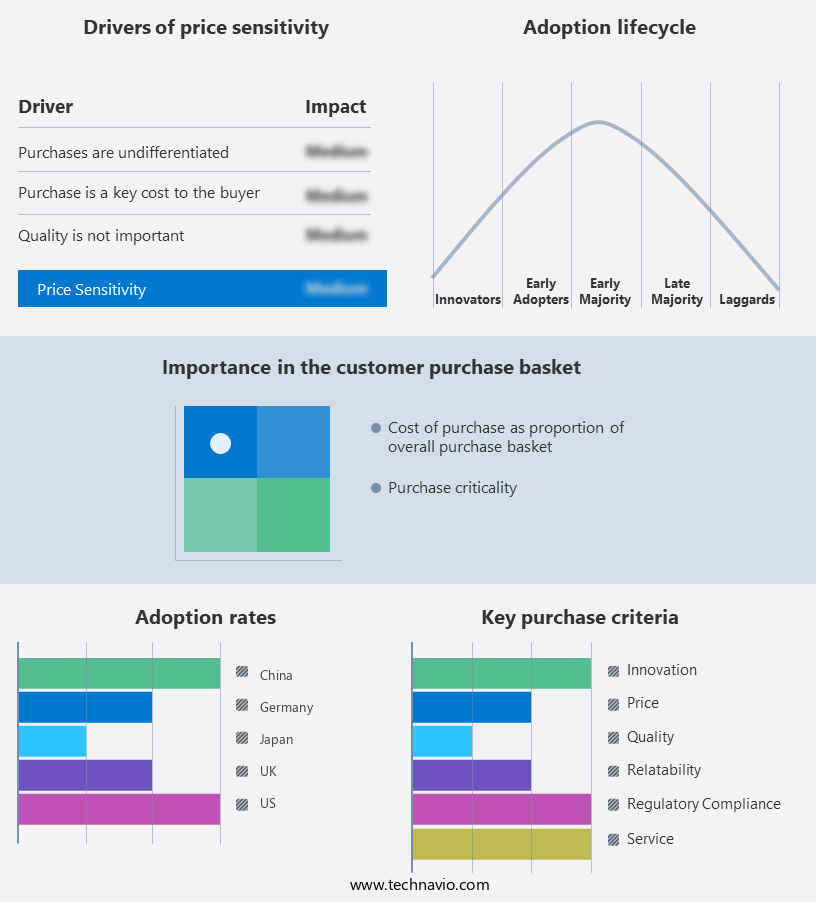
The smart manufacturing market forecasting report includes the adoption lifecycle of the market, covering from the innovator’s stage to the laggard’s stage. It focuses on adoption rates in different regions based on penetration. Furthermore, the smart manufacturing market report also includes key purchase criteria and drivers of price sensitivity to help companies evaluate and develop their market growth analysis strategies.
Customer Landscape of Smart Manufacturing Industry
Competitive Landscape
Companies are implementing various strategies, such as strategic alliances, smart manufacturing market forecast, partnerships, mergers and acquisitions, geographical expansion, and product/service launches, to enhance their presence in the industry.
ABB Ltd. - This company specializes in providing advanced manufacturing solutions, encompassing discrete, cement, and battery manufacturing industries. Their offerings leverage innovative technologies to optimize production processes and enhance efficiency.
The industry research and growth report includes detailed analyses of the competitive landscape of the market and information about key companies, including:
- ABB Ltd.
- Cisco Systems Inc.
- Dassault Systemes SE
- Emerson Electric Co.
- FANUC Corp.
- General Electric Co.
- Hewlett Packard Enterprise Co.
- Honeywell International Inc.
- International Business Machines Corp.
- Microsoft Corp.
- Mitsubishi Electric Corp.
- Oracle Corp.
- PTC Inc.
- Robert Bosch GmbH
- Rockwell Automation Inc.
- SAP SE
- Schneider Electric SE
- Siemens AG
- Texas Instruments Inc.
- Yokogawa Electric Corp.
Qualitative and quantitative analysis of companies has been conducted to help clients understand the wider business environment as well as the strengths and weaknesses of key industry players. Data is qualitatively analyzed to categorize companies as pure play, category-focused, industry-focused, and diversified; it is quantitatively analyzed to categorize companies as dominant, leading, strong, tentative, and weak.
Recent Development and News in Smart Manufacturing Market
- In January 2024, Siemens and Microsoft announced a strategic partnership to integrate Microsoft Azure IoT and Siemens' MindSphere industrial IoT platforms, aiming to enhance Smart Manufacturing solutions for industrial customers (Microsoft Press Release, 2024).
- In March 2024, General Electric (GE) completed the acquisition of Servigistics, a leading provider of after-sales service and supply chain optimization software, strengthening GE's digital industrial offerings and expanding its Smart Manufacturing capabilities (GE Press Release, 2024).
- In April 2025, Siemens Gamesa Renewable Energy, a global leader in wind energy, showcased its Smart Wind Factory in Denmark, which integrates advanced automation, digitalization, and robotics to increase production efficiency and reduce costs (Siemens Gamesa Press Release, 2025).
- In May 2025, Bosch and Amazon Web Services (AWS) announced a collaboration to develop a new Smart Manufacturing System, combining Bosch's manufacturing expertise and AWS's cloud services, aiming to create more flexible, efficient, and connected manufacturing systems (Bosch Press Release, 2025).
Dive into Technavio’s robust research methodology, blending expert interviews, extensive data synthesis, and validated models for unparalleled Smart Manufacturing Market insights. See full methodology.
|
Market Scope |
|
|
Report Coverage |
Details |
|
Page number |
182 |
|
Base year |
2023 |
|
Historic period |
2018-2022 |
|
Forecast period |
2024-2028 |
|
Growth momentum & CAGR |
Accelerate at a CAGR of 16.83% |
|
Market growth 2024-2028 |
USD 29211.4 million |
|
Market structure |
Fragmented |
|
YoY growth 2023-2024(%) |
14.01 |
|
Key countries |
US, China, UK, Germany, and Japan |
|
Competitive landscape |
Leading Companies, Market Positioning of Companies, Competitive Strategies, and Industry Risks |
Research Analyst Overview
- In the dynamic and evolving landscape of modern manufacturing, the integration of advanced technologies is revolutionizing operations and driving significant improvements in efficiency, productivity, and quality. One such area of focus is the effective management of big data generated by various sources, including sensor data, to optimize production lines and enhance overall performance. The implementation of blockchain technology is another key trend, providing secure data sharing and traceability, while edge computing enables real-time data analytics and faster decision-making. Predictive maintenance models, powered by machine learning algorithms and digital twin technology, enable proactive maintenance and minimize downtime.
- Moreover, the adoption of lean manufacturing principles, supply chain optimization, and inventory management systems contribute to streamlined processes and reduced waste. Cybersecurity protocols ensure data protection, and energy efficiency measures reduce operational costs. Real-time data analytics, digital thread implementation, and human-machine interface (HMI) enhance the manufacturing process by providing valuable insights and improving communication between humans and machines. Process optimization techniques, such as six sigma methodologies and additive manufacturing processes, further contribute to increased efficiency and improved product quality. Industrial IoT platforms facilitate seamless integration of various manufacturing technologies, enabling the collection, analysis, and utilization of data to optimize production and improve overall performance.
- As the market continues to evolve, these trends and technologies will shape the future of manufacturing, driving innovation and growth.
What are the Key Data Covered in this Smart Manufacturing Market Research and Growth Report?
-
What is the expected growth of the Smart Manufacturing Market between 2024 and 2028?
-
USD 29.21 billion, at a CAGR of 16.83%
-
-
What segmentation does the market report cover?
-
The report segmented by Industry Application (Process and Discrete), Technology (Human-machine interface, Manufacturing execution system, Plant asset management, and Warehouse management system), and Geography (APAC, North America, Europe, South America, and Middle East and Africa)
-
-
Which regions are analyzed in the report?
-
APAC, North America, Europe, South America, and Middle East and Africa
-
-
What are the key growth drivers and market challenges?
-
Need for simplification of complex manufacturing activities, Data privacy and security concerns
-
-
Who are the major players in the Smart Manufacturing Market?
-
Key Companies ABB Ltd., Cisco Systems Inc., Dassault Systemes SE, Emerson Electric Co., FANUC Corp., General Electric Co., Hewlett Packard Enterprise Co., Honeywell International Inc., International Business Machines Corp., Microsoft Corp., Mitsubishi Electric Corp., Oracle Corp., PTC Inc., Robert Bosch GmbH, Rockwell Automation Inc., SAP SE, Schneider Electric SE, Siemens AG, Texas Instruments Inc., and Yokogawa Electric Corp.
-
Market Research Insights
- The market encompasses a range of advanced technologies and strategies that optimize production processes, enhance supply chain visibility, and improve overall operational efficiency. Two key areas of focus are factory automation and predictive analytics. According to recent estimates, the global factory automation market is projected to reach USD309.5 billion by 2025, growing at a compound annual growth rate (CAGR) of 6.3% from 2020. In contrast, the predictive analytics tools market is anticipated to expand at a faster pace, with a CAGR of 12.2%, reaching USD118.6 billion by 2027. The integration of IoT device connectivity, digital factory design, and real-time data acquisition systems enables manufacturers to implement root cause analysis, identify defects, and improve process performance.
- Additionally, smart sensors deployment, automated quality inspection, and compliance regulations drive the adoption of safety protocols and cost optimization strategies. Furthermore, the implementation of capacity planning, resource allocation, and performance monitoring tools contributes to waste reduction and demand forecasting capabilities. The deployment of cobots collaboration, 3D printing technology, and MES integration facilitate process improvement and sustainability initiatives.
We can help! Our analysts can customize this smart manufacturing market research report to meet your requirements.
 RIA -
RIA - 
