Isopropyl Alcohol Market Size 2025-2029
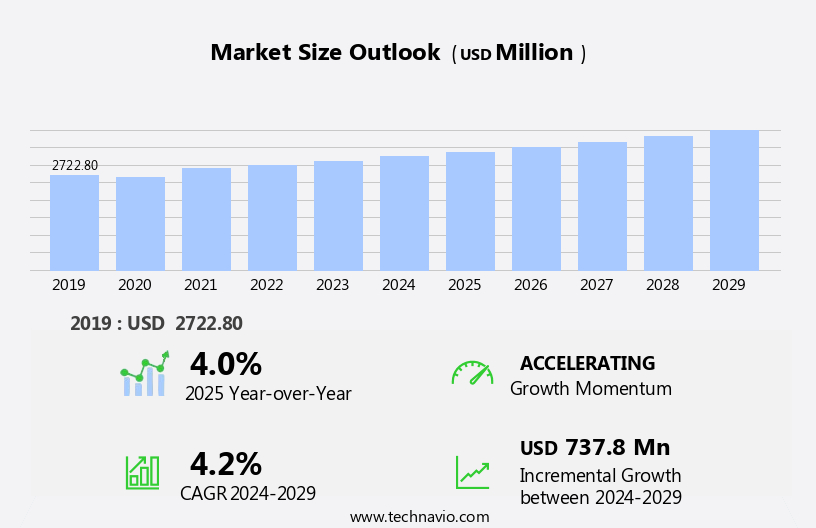
The isopropyl alcohol market size is forecast to increase by USD 737.8 million at a CAGR of 4.2% between 2024 and 2029.
- The market exhibits growth, driven by its high volume consumption in various industries, including pharmaceuticals, cosmetics, and solvents. The market's expansion is further fueled by capacity expansions and new plant announcements by key players to meet the surging demand. However, the market's growth trajectory is not without challenges. The volatility in crude oil prices significantly impacts the production cost, making it a critical factor to watch. As such, companies must navigate this price volatility to maintain their competitive edge and capitalize on the market's opportunities effectively. The market is witnessing significant growth due to its extensive applications in various industries, particularly in the production of high-purity grades for use in solvents, pharmaceuticals, and personal care products.
- In summary, the market presents significant growth potential, underpinned by its diverse applications and capacity expansions. However, market participants must be agile in managing the risks associated with crude oil price fluctuations to maximize their profits and market share. However, the market faces challenges such as volatility in crude oil prices, which impact the production costs.
What will be the Size of the Isopropyl Alcohol Market during the forecast period?
- A versatile solvent plays a significant role in various industries due to its unique properties. In spectrophotometric analysis, it serves as an essential reagent for measuring the absorption of light by substances. Waste minimization is a key trend in usage, with solvent evaporation techniques employed for efficient recovery and reuse. Bioremediation processes utilize in flammability rating reduction and as a solvent for extracting pollutants. Bulk packaging and product development cater to end-use applications, such as electronic components, laboratory reagents, cosmetic ingredients, food processing equipment, and high purity standards in pharmaceuticals and biotechnology research. IPA is a versatile solvent used in numerous applications, including as a raw material in the production of acetone, glycerol, and isopropyl acetate. In the plastics industry, IPA acts as a solvent and a plasticizer
- Regulatory approvals and stringent industry standards ensure the antimicrobial properties and virucidal efficacy of in surface disinfection and sterilization techniques. Emerging applications include fungicidal effects, aerospace applications, and microfluidic devices. Technological trends favor material compatibility, bio-based production, and solvent purity testing. Renewable resources and solvent applications contribute to supply chain management and storage and handling. Non-toxic alternatives and sterilization techniques further expand market reach. Industrial solvents, analytical techniques, and antimicrobial properties continue to drive demand. Its role in pharmaceutical formulation, biodegradable materials, and various industries underscores its importance as a valuable industrial commodity. IPA is also used as an astringent in various cosmetics and skincare products. As a chemical intermediate, IPA is used in the production of agrochemicals, contributing to the agricultural sector's growth.
How is this Isopropyl Alcohol Industry segmented?
The report provides comprehensive data (region-wise segment analysis), with forecasts and estimates in "USD million" for the period 2025-2029, as well as historical data from 2019-2023 for the following segments.
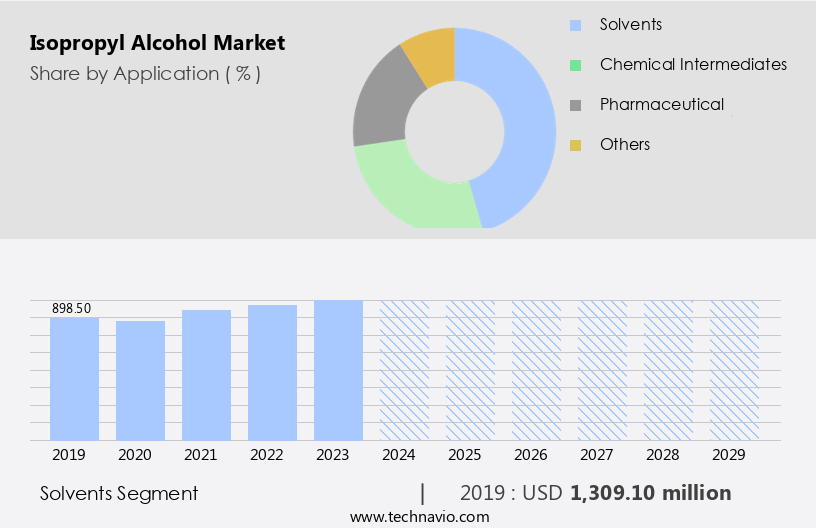
- Application
- Solvents
- Chemical intermediates
- Pharmaceutical
- Others
- End-user
- Cosmetics and personal care
- Cleaning agent
- Food and beverages
- Others
- Technology
- Indirect hydration
- Direct hydration
- Grade Type
- Industrial grade IPA
- Pharmaceutical grade IPA
- Cosmetic grade IPA
- Geography
- APAC
- Australia
- China
- India
- Japan
- South Korea
- North America
- US
- Canada
- Europe
- Germany
- UK
- South America
- Brazil
- Middle East and Africa
- APAC
By Application Insights
The solvents segment is estimated to witness significant growth during the forecast period. It is a versatile solvent utilized extensively across various industries for diverse applications. In surface coatings, it functions as a solvent for paint stripping and an alcohol carrier in the production of paints and coatings. Its role extends to acting as a common solvent in refractory coatings. In the realm of solvent applications, it is employed as a solvent for inks and processing agents for natural products such as fats, gums, vegetable and animal oils, and waxes. Additionally, it is used in the manufacture of cleaning and disinfectant solutions for household and commercial uses. Industrial manufacturing sectors leverage for its solvent properties, particularly in the production of chemicals, adhesives, and textiles.
Its high purity level makes it suitable for use in laboratory research and electronic grade applications. Food processing industries employ as a trace metal analysis agent and a solvent in various food and beverage applications. Regulatory compliance is a crucial aspect of the market, with stringent environmental and government regulations governing its production, storage, and usage. Sustainable production methods and renewable resources are increasingly being adopted to reduce the environmental footprint of production. Pharmaceutical and medical industries utilize as a solvent, cleaning agent, and disinfectant. Its high evaporation rate makes it an ideal choice for use in hand sanitizers and surface cleaning applications. With population growth and increasing demand for plastics, resins, fertilizers, pesticides, and other chemical products, the market is poised for expansion
The cosmetics industry also relies for its use as a cosmetic grade solvent. Industry standards, such as Green Chemistry and Pharmaceutical Grade, ensure quality control for various applications. Solvent recovery and recycling techniques are employed to mitigate price volatility and reduce the overall cost of production. In the realm of end-use industries, isopropyl alcohol finds applications in medical devices, printing, and gas chromatography. Its safety data sheet is a critical document that outlines its handling, storage, and disposal guidelines.
Get a glance at the market report of share of various segments Request Free Sample
The solvents segment was valued at USD 1.31 billion in 2019 and showed a gradual increase during the forecast period.
Regional Analysis
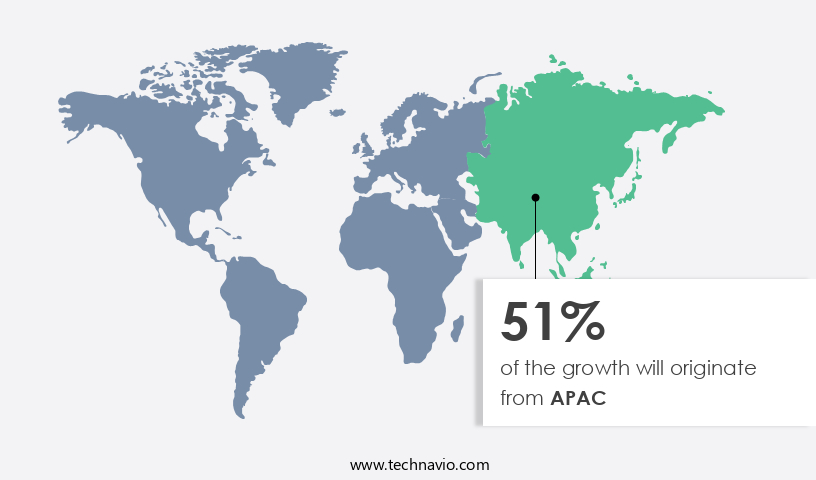
APAC is estimated to contribute 51% to the growth of the global market during the forecast period. Technavio's analysts have elaborately explained the regional trends and drivers that shape the market during the forecast period.
For more insights on the market size of various regions, Request Free Sample
Isopropyl alcohol, a versatile organic compound, plays a significant role in various industries, including pharmaceuticals, food processing, cosmetics, and industrial manufacturing. The market for isopropyl alcohol is driven by several factors. The pharmaceutical sector's expansion, particularly in Asia Pacific (APAC), fuels the demand due to its extensive usage in the production of pharmaceutical intermediates and drugs. The food and beverages industry's growth, particularly in APAC, contributes to the market's upward trend, as isopropyl alcohol is used as a solvent and preservative. The cosmetics and personal care sector also boosts the market, as isopropyl alcohol serves as a solvent, preservative, and denaturant in various cosmetic products.
The industrial manufacturing sector's increasing demand for isopropyl alcohol is due to its solvent properties and its use as a cleaning agent in various applications. The market is also influenced by regulatory compliance, as isopropyl alcohol is used in trace metal analysis and surface cleaning. Price volatility and supply chain challenges can impact the market's growth. However, the adoption of sustainable production methods, renewable resources, and green chemistry practices can mitigate these challenges. The evaporation rate and high purity of isopropyl alcohol make it an ideal solvent for applications such as gas chromatography and medical devices. The pharmaceutical and medical industries' stringent quality control requirements necessitate the use of high-purity isopropyl alcohol.
The market's end-use industries are subject to various regulations, including environmental and government regulations, which can impact production and pricing. Product innovation and solvent recovery technologies can help mitigate these challenges and drive the market's growth. In summary, the market is driven by the expanding pharmaceutical, food processing, cosmetics, and industrial manufacturing sectors in APAC. The market's growth is influenced by regulatory compliance, price volatility, and supply chain challenges, while sustainable production practices and product innovation offer opportunities for growth.
Market Dynamics
Our researchers analyzed the data with 2024 as the base year, along with the key drivers, trends, and challenges. A holistic analysis of drivers will help companies refine their marketing strategies to gain a competitive advantage.
What are the key market drivers leading to the rise in the adoption of Isopropyl Alcohol Industry?
- High volume consumption in solvents is the key driver of the market. Isopropyl alcohol is a widely utilized solvent in various industries due to its superior solvency properties. This colorless, flammable liquid is extensively applied in surface coatings, inks, pesticides and herbicides formulations, resin production, disinfectants, and cleaning products. Among these applications, the coatings and ink industries hold a significant market share. Isopropyl alcohol's unique property of being highly miscible in water and non-polar solvents makes it an indispensable solvent in surface coatings. It is employed in acrylic emulsions and resins to generate diverse textures. Furthermore, it is used in the formulation of polyvinyl butyral (PVB), alkaloids, and oils. Isopropyl alcohol's versatility and effectiveness make it an essential component in numerous industries. In the realm of surface coatings, it is employed for paint stripping and as a solvent in the production of paints and coatings.
What are the market trends shaping the Isopropyl Alcohol Industry?
- Capacity expansions and new plants is the upcoming market trend. The market has experienced significant expansion in production capacities over the past few years. China and India have emerged as key contributors to this growth, with increasing production capacities from local producers. The demand for isopropyl alcohol in consumer products, pharmaceuticals, and household cleaning solutions continues to rise, driving the need for greater production. Historically, production of isopropyl alcohol has been concentrated in developed economies, leading some end-use industries to rely on imports. China, the fastest-growing country, exhibits a rising demand from the downstream construction and automobile industries, making it the largest producer of isopropyl alcohol due to the presence of numerous local and regional companies, affordable labor, and abundant raw materials. As both supply and consumption continue to grow, producers are expected to increase their production capacities to meet the global demand.
What challenges does the Isopropyl Alcohol Industry face during its growth?
- Volatility in crude oil prices is a key challenge affecting the industry growth. The market is currently experiencing challenges due to the volatility of crude oil prices. As propylene, the primary raw material for isopropyl alcohol production, is derived from oil or its by-products, such as naphtha or liquefied petroleum gas, fluctuations in crude oil prices negatively impact the production capacity and cost of propylene. The oil and gas industry, which directly produces propylene, has been compelled to implement cost-cutting measures in response to declining oil prices in recent years, including workforce reductions. Although Brent and WTI crude oil prices have risen, the Energy Information Administration (EIA) anticipates a decrease in the coming months. This uncertainty in crude oil prices poses a significant challenge for the market. It is also used in formulating polyvinyl butyral (PVB), alkaloids, and essential oils. The oil and gas industry, which directly produces propylene from oil or its derivatives like naphtha or liquefied petroleum gas, has been compelled to implement cost-cutting measures due to the decline in oil prices in recent years.
Exclusive Customer Landscape
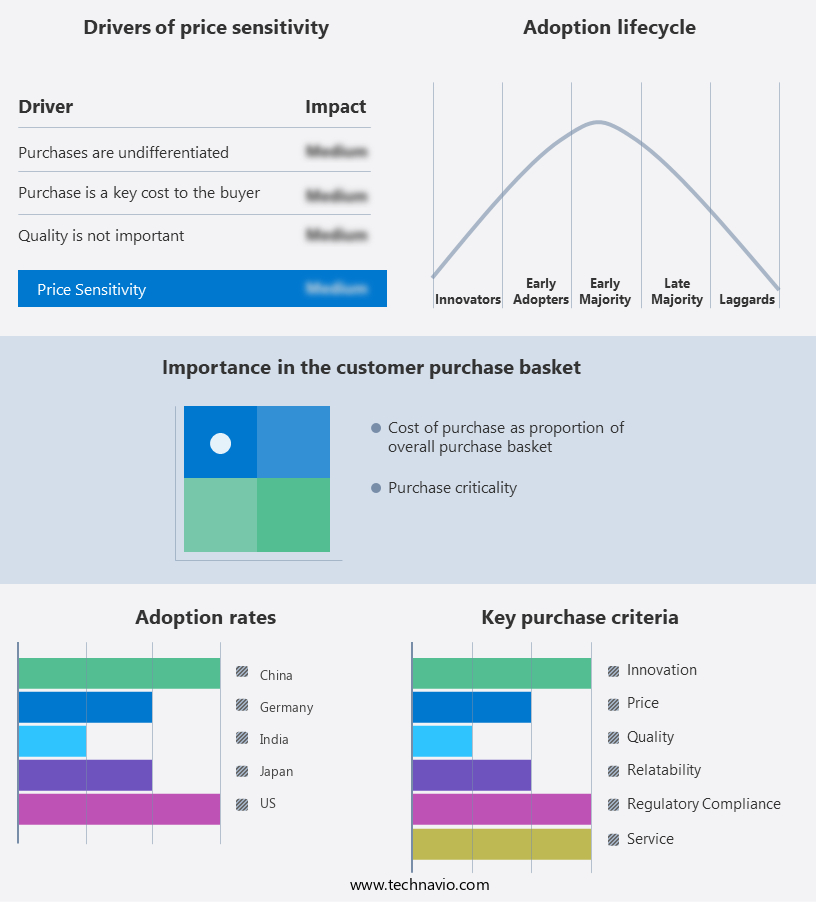
The isopropyl alcohol market forecasting report includes the adoption lifecycle of the market, covering from the innovator's stage to the laggard's stage. It focuses on adoption rates in different regions based on penetration. Furthermore, the isopropyl alcohol market report also includes key purchase criteria and drivers of price sensitivity to help companies evaluate and develop their market growth analysis strategies.
Customer Landscape
Key Companies & Market Insights
Companies are implementing various strategies, such as strategic alliances, isopropyl alcohol market forecast, partnerships, mergers and acquisitions, geographical expansion, and product/service launches, to enhance their presence in the industry.
Deepak Fertilisers and Petrochemicals Corp. Ltd. - The company specializes in the production and supply of isopropyl alcohol, a versatile chemical essential in various industries.
The industry research and growth report includes detailed analyses of the competitive landscape of the market and information about key companies, including:
- Deepak Fertilisers and Petrochemicals Corp. Ltd.
- ENEOS Holdings Inc.
- Exxon Mobil Corp.
- GJ Chemical
- Greenfield Global Inc.
- Honeywell International Inc.
- INEOS Group Holdings S.A.
- LCY Chemical Corp.
- LG Chem Ltd.
- LyondellBasell Industries NV
- Mitsui Chemicals Inc.
- Penta s.r.o
- Sasol Ltd.
- SEQENS GROUP
- Shell plc
- Soft Jamb Co.
- Spectrum Laboratory Products Inc.
- Tokuyama Corp.
- Tokyo Chemical Industry Co. Ltd.
- Vizag Chemical International
Qualitative and quantitative analysis of companies has been conducted to help clients understand the wider business environment as well as the strengths and weaknesses of key industry players. Data is qualitatively analyzed to categorize companies as pure play, category-focused, industry-focused, and diversified; it is quantitatively analyzed to categorize companies as dominant, leading, strong, tentative, and weak.
Research Analyst Overview
Isopropyl alcohol, a versatile organic compound, plays a significant role in various industries due to its unique properties as a solvent and a cleaning agent. This market encompasses a wide range of applications, including electronic grade, laboratory research, and industrial manufacturing. The demand for high-purity isopropyl alcohol in electronic grade and laboratory research applications is driven by the increasing emphasis on sustainable production methods and regulatory compliance. The need for trace metal analysis and maintaining stringent quality control standards necessitates the use of isopropyl alcohol with superior solvent properties and evaporation rate. Price volatility is a common challenge in the market due to the dependence on non-renewable resources for its production.
However, the shift towards renewable resources, such as bio-based IPA, is gaining traction as an alternative to traditional production methods. This trend aligns with the growing emphasis on green chemistry and environmental regulations in various end-use industries. Food processing and pharmaceutical industries are significant consumers of isopropyl alcohol, with the former utilizing it as a cleaning agent and the latter for its use in medical devices and hand sanitizers. The regulatory compliance requirements in these industries necessitate the use of isopropyl alcohol that adheres to industry standards. The supply chain for isopropyl alcohol is complex, with multiple stages from raw material sourcing to production, distribution, and end-use industries.
The evaporation rate and safety data sheet requirements for isopropyl alcohol are crucial factors that impact its handling and storage, particularly in industrial manufacturing and bulk storage applications. Product innovation and solvent recovery are essential aspects of the market, with ongoing research focusing on improving its production efficiency and reducing waste. The solvent properties of isopropyl alcohol make it an attractive alternative to other solvents in various applications, including surface cleaning and gas chromatography. The market is subject to various government regulations, which can impact its production, pricing, and distribution. Compliance with these regulations is crucial for market participants to maintain their market position and ensure the safety and quality of their products.
The market is a dynamic and complex ecosystem that caters to various industries and applications. The demand for high-purity isopropyl alcohol, driven by regulatory compliance and sustainable production methods, is a significant trend in the market. The shift towards renewable resources and product innovation is also gaining traction, with ongoing research focusing on improving production efficiency and reducing waste. The market is subject to various regulations and supply chain complexities, necessitating a focus on quality control and safety data sheet requirements.
|
Market Scope |
|
|
Report Coverage |
Details |
|
Page number |
250 |
|
Base year |
2024 |
|
Historic period |
2019-2023 |
|
Forecast period |
2025-2029 |
|
Growth momentum & CAGR |
Accelerate at a CAGR of 4.2% |
|
Market growth 2025-2029 |
USD 737.8 million |
|
Market structure |
Fragmented |
|
YoY growth 2024-2025(%) |
4.0 |
|
Key countries |
US, China, India, Japan, Germany, Canada, South Korea, UK, Australia, and Brazil |
|
Competitive landscape |
Leading Companies, Market Positioning of Companies, Competitive Strategies, and Industry Risks |
What are the Key Data Covered in this Isopropyl Alcohol Market Research and Growth Report?
- CAGR of the Isopropyl Alcohol industry during the forecast period
- Detailed information on factors that will drive the growth and forecasting between 2025 and 2029
- Precise estimation of the size of the market and its contribution of the industry in focus to the parent market
- Accurate predictions about upcoming growth and trends and changes in consumer behaviour
- Growth of the market across APAC, North America, Europe, South America, and Middle East and Africa
- Thorough analysis of the market's competitive landscape and detailed information about companies
- Comprehensive analysis of factors that will challenge the isopropyl alcohol market growth of industry companies
We can help! Our analysts can customize this isopropyl alcohol market research report to meet your requirements.
 RIA -
RIA - 
