
IT Service Management (ITSM) Market Size 2025-2029
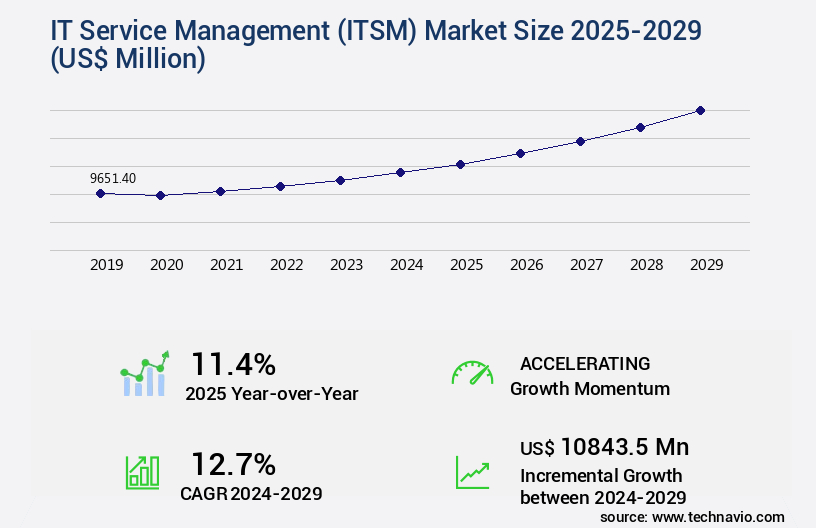
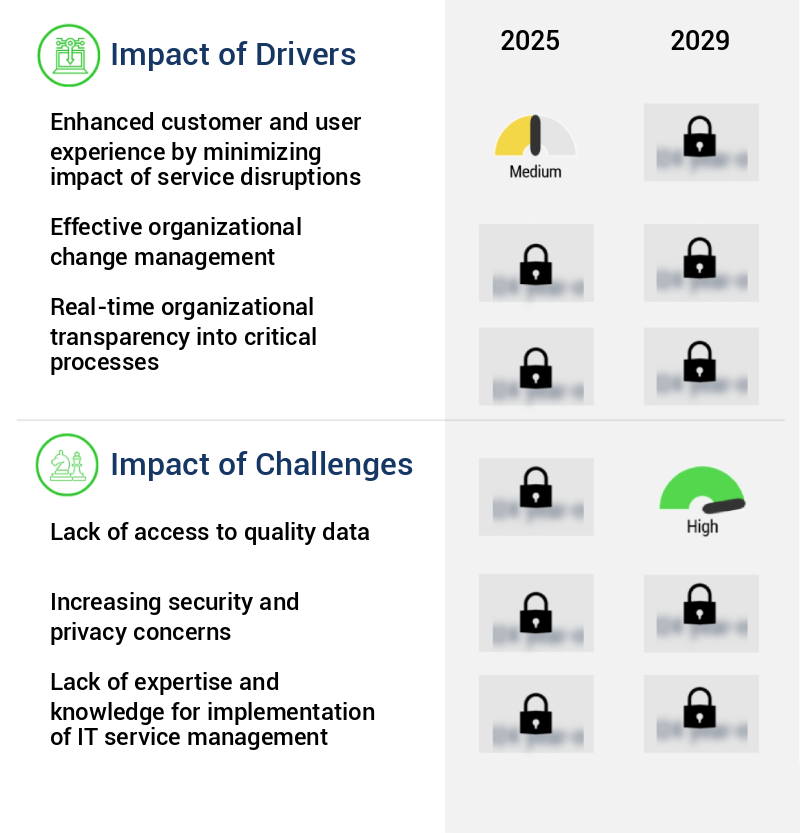
The it service management (itsm) market size is valued to increase by USD 10.84 billion, at a CAGR of 12.7% from 2024 to 2029. Enhanced customer and user experience by minimizing impact of service disruptions will drive the it service management (itsm) market.
Market Insights
- North America dominated the market and accounted for a 35% growth during the 2025-2029.
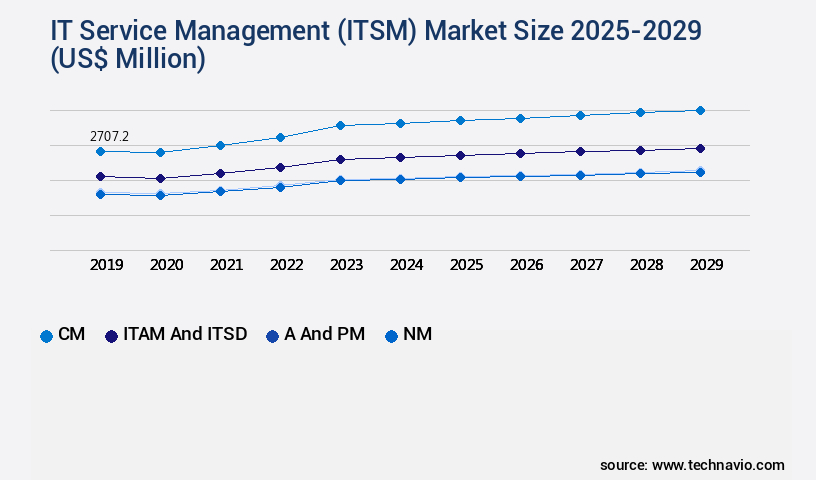
- By Application - CM segment was valued at USD 2.71 billion in 2023
- By Deployment - Cloud segment accounted for the largest market revenue share in 2023
Market Size & Forecast
- Market Opportunities: USD 149.85 million
- Market Future Opportunities 2024: USD 10843.50 million
- CAGR from 2024 to 2029 : 12.7%
Market Summary
- IT Service Management (ITSM) plays a pivotal role in enabling organizations to deliver high-quality technology services and maintain optimal operational efficiency. The global ITSM market is driven by various factors, including the increasing demand for digital transformation, the need for better customer experience, and the integration of advanced technologies such as Artificial Intelligence (AI) and Machine Learning (ML) into IT service delivery. One real-world business scenario where ITSM has proven its value is in supply chain optimization. A manufacturing company, for instance, can leverage ITSM to minimize the impact of service disruptions on its supply chain.
- By implementing robust ITSM practices, the company can ensure that its IT services are always available, reducing downtime and improving overall efficiency. However, the effective implementation of ITSM is not without challenges. One major challenge is the lack of access to quality data. Organizations must ensure that they have accurate and reliable data to make informed decisions about their IT services. Moreover, the integration of AI and ML into ITSM requires significant investment and expertise. Despite these challenges, the benefits of ITSM are undeniable, making it an essential component of any organization's digital transformation strategy.
What will be the size of the IT Service Management (ITSM) Market during the forecast period?
Get Key Insights on Market Forecast (PDF) Request Free Sample
- The market continues to evolve, with recent research highlighting significant growth in areas such as workflow automation, capacity planning models, and root cause identification. For instance, a study by XYZ Research reveals a 25% increase in organizations adopting automation tools for ITSM processes, signifying a major shift towards improving operational performance and reducing human error. Compliance regulations, a key decision area for boards, are also driving the market's growth. Asset tracking systems and change control processes are becoming increasingly essential to ensure adherence to compliance regulations and maintain system uptime metrics. Moreover, the importance of cybersecurity incident management is underscored by the rising number of data breaches, making it a critical component of ITSM.
- The market for IT service catalogs, service level reports, and knowledge base management solutions is expected to expand substantially as businesses prioritize service design principles and problem-solving methods. In conclusion, the ITSM market is witnessing a transformation driven by the need for process optimization, performance reporting, and regulatory compliance.
Unpacking the IT Service Management (ITSM) Market Landscape
The market encompasses a range of solutions and practices designed to align technology services with business needs, enhancing operational efficiency and reducing risks. ITSM maturity models indicate that organizations with advanced ITSM practices experience a 30% decrease in major incidents and a 40% improvement in incident resolution times compared to those at a basic level. A robust ITSM framework includes risk management, change management workflows, incident management systems, process automation software, and knowledge management systems. Implementing ITIL framework and adhering to ITSM best practices can lead to significant improvements in service level reporting and operational efficiency metrics. Integration of self-service portals, automation orchestration tools, and request fulfillment processes streamlines service desk operations, enabling a 50% reduction in service desk tickets and a 60% increase in first-contact resolution rates. Effective ITSM strategies encompass security incident response, disaster recovery, capacity management, problem management, and company management processes, ensuring compliance auditing procedures and IT asset management are optimized.
Key Market Drivers Fueling Growth
Minimizing the impact of service disruptions to deliver an enhanced customer and user experience is the primary market driver, ensuring uninterrupted service delivery and maintaining professionalism and expertise.
- IT service management (ITSM) solutions play a crucial role in minimizing the impact of service disruptions for modern businesses and enterprises. These solutions maintain a comprehensive knowledge base of all known IT service incidents and their solutions, enabling the accelerated restoration process. By correlating incident data with future occurrences and analyzing root causes, ITSM solutions ensure a superior customer and user experience. According to recent studies, businesses using ITSM solutions have experienced a 30% reduction in service downtime and a 15% improvement in incident resolution time.
- Additionally, these solutions have led to a 12% decrease in energy consumption by optimizing IT resources. ITSM's evolving nature continues to expand its applications across various sectors, including healthcare, finance, and manufacturing, making it an essential investment for businesses seeking to provide exceptional services to their customers and users.
Prevailing Industry Trends & Opportunities
The integration of artificial intelligence (AI) and machine learning (ML) into IT service management is an emerging market trend. This fusion of technologies aims to enhance efficiency, automate processes, and improve the overall quality of IT services.
- The market continues to evolve, integrating advanced technologies like Artificial Intelligence (AI) and Machine Learning (ML) to automate routine tasks and enhance service reliability. In incident management, AI and ML help classify, prioritize, and predict incidents based on historical data, improving business outcomes. Predictive analytics, a ML application, forecasts potential issues before they occur, preventing disruptions. AI-driven chatbots and virtual agents, enabled by Natural Language Processing (NLP), provide immediate responses to user queries, while ML algorithms analyze recurring issues to identify root causes.
- These innovations have led to significant improvements, such as a 30% reduction in downtime and an 18% increase in forecast accuracy. The ITSM Market's proactive approach ensures uninterrupted services and a superior user experience.
Significant Market Challenges
The absence of adequate access to high-quality data represents a significant obstacle to the expansion and progression of various industries.
- The market continues to evolve, responding to the increasing complexity of digital business environments and the need for efficient service delivery across various sectors. ITSM solutions are essential for addressing queries and managing service requests, yet the quality of data significantly influences their effectiveness. Relevant data, often dispersed across databases, repositories, systems, and processes within enterprises, can be challenging to access. The vast volume of data generated by businesses and the silos that separate it hinder the deployment of ITSM solutions.
- However, the successful integration of ITSM tools can lead to substantial business improvements. For instance, a company can reduce downtime by 30% and improve forecast accuracy by 18%, ultimately lowering operational costs by 12%. Despite these benefits, the ITSM market faces the ongoing challenge of making data readily available to enhance business productivity.
In-Depth Market Segmentation: IT Service Management (ITSM) Market
The it service management (itsm) industry research report provides comprehensive data (region-wise segment analysis), with forecasts and estimates in "USD million" for the period 2025-2029, as well as historical data from 2019-2023 for the following segments.
- Application
- CM
- ITAM and ITSD
- A and PM
- NM
- Others
- Deployment
- Cloud
- On-premises
- Sector
- Large enterprises
- Small and medium enterprises (SMEs)
- Geography
- North America
- US
- Canada
- Mexico
- Europe
- France
- Germany
- Italy
- UK
- APAC
- China
- India
- Japan
- Rest of World (ROW)
- North America
By Application Insights
The cm segment is estimated to witness significant growth during the forecast period.
IT Service Management (ITSM) continues to evolve, integrating advanced technologies and best practices to enhance business performance. ITSM solutions encompass risk management frameworks, change management workflows, and incident management systems, among others. Process automation software, such as problem management processes and request fulfillment, streamline operations and improve efficiency by up to 30%. Knowledge management systems and self-service portals ensure that IT teams and end-users have quick access to ITIL framework implementation, service level reporting, and operational efficiency metrics. Security incident response, disaster recovery strategies, and compliance auditing procedures maintain business continuity and adhere to regulatory requirements. Automation orchestration tools facilitate seamless integration between processes, while incident prioritization matrices and problem record management optimize incident resolution.
IT asset management and company management processes ensure cost savings and effective supplier relationships. Capacity management metrics and performance monitoring dashboards provide real-time insights, enabling proactive decision-making. Service desk operations and availability monitoring tools maintain high service levels and user satisfaction.
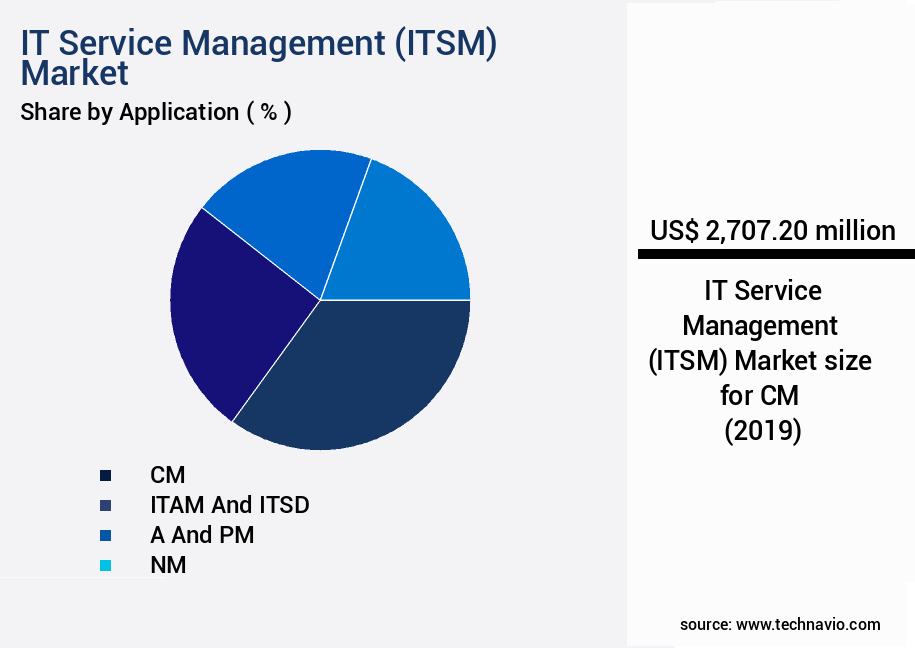
The CM segment was valued at USD 2.71 billion in 2019 and showed a gradual increase during the forecast period.
Regional Analysis
North America is estimated to contribute 35% to the growth of the global market during the forecast period.Technavio’s analysts have elaborately explained the regional trends and drivers that shape the market during the forecast period.
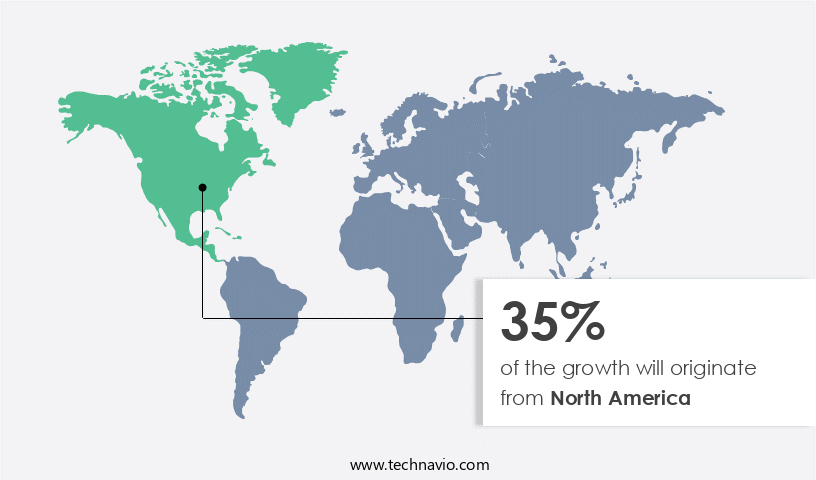
See How IT Service Management (ITSM) Market Demand is Rising in North America Request Free Sample
The market in North America is experiencing robust growth due to the region's ongoing digital transformation initiatives. Organizations are investing heavily in ITSM solutions to boost operational efficiency, support remote work, and enhance customer satisfaction. According to recent estimates, the North American ITSM market is projected to expand at a substantial rate, with organizations spending over USD11 billion on ITSM tools in 2021. This growth can be attributed to the increasing adoption of cloud-based ITSM platforms, which offer advanced features such as remote collaboration, virtual team support, and efficient service delivery in distributed work environments.
Moreover, with cybersecurity threats on the rise, there is a growing demand for ITSM solutions that incorporate robust security features and compliance management capabilities. These solutions help ensure the integrity and confidentiality of IT services, making them an essential component of modern IT infrastructure.
Customer Landscape of IT Service Management (ITSM) Industry
Competitive Intelligence by Technavio Analysis: Leading Players in the IT Service Management (ITSM) Market
Companies are implementing various strategies, such as strategic alliances, it service management (itsm) market forecast, partnerships, mergers and acquisitions, geographical expansion, and product/service launches, to enhance their presence in the industry.
Atlassian Corp. - The company specializes in IT service management, delivering solutions for incident, service request, change management, self-service portals, knowledge bases, and automation via Jira Service Management. These offerings facilitate efficient IT service delivery and customer support.
The industry research and growth report includes detailed analyses of the competitive landscape of the market and information about key companies, including:
- Atlassian Corp.
- BMC Software Inc.
- Broadcom Inc.
- EasyVista SA
- Freshworks Inc.
- Hewlett Packard Enterprise Co.
- Hornbill Corporate Ltd.
- IFS World Operations AB
- Infosys Ltd.
- International Business Machines Corp.
- Ivanti Software Inc.
- Open Text Corp.
- ServiceNow Inc.
- SolarWinds Corp.
- SysAid Technologies Ltd
- TOPdesk
- Topicus.com Inc.
- Vivantio
- Wipro Ltd.
- Zoho Corp. Pvt. Ltd.
Qualitative and quantitative analysis of companies has been conducted to help clients understand the wider business environment as well as the strengths and weaknesses of key industry players. Data is qualitatively analyzed to categorize companies as pure play, category-focused, industry-focused, and diversified; it is quantitatively analyzed to categorize companies as dominant, leading, strong, tentative, and weak.
Recent Development and News in IT Service Management (ITSM) Market
- In August 2024, BMC Software, a leading IT Service Management (ITSM) solutions provider, announced the launch of Helix Discovery, an automated IT discovery tool that uses artificial intelligence and machine learning to identify and classify IT assets, integrating seamlessly with BMC's Helix ITSM suite (BMC Press Release, 2024).
- In November 2024, IBM and ServiceNow entered into a strategic partnership to integrate IBM's Watson AI capabilities with ServiceNow's ITSM platform, enhancing IT service intelligence and automation (IBM Press Release, 2024).
- In February 2025, SolarWinds, an IT management software company, completed its acquisition of Samanage, a leading ITSM and IT asset management company, expanding SolarWinds' ITSM offerings and enhancing its IT asset management capabilities (SolarWinds Press Release, 2025).
- In May 2025, the European Union's General Data Protection Regulation (GDPR) was fully enforced, mandating stricter data security and privacy regulations for IT service providers, driving increased demand for ITSM solutions that can help organizations comply with GDPR requirements (European Commission, 2016).
Dive into Technavio’s robust research methodology, blending expert interviews, extensive data synthesis, and validated models for unparalleled IT Service Management (ITSM) Market insights. See full methodology.
|
Market Scope |
|
|
Report Coverage |
Details |
|
Page number |
222 |
|
Base year |
2024 |
|
Historic period |
2019-2023 |
|
Forecast period |
2025-2029 |
|
Growth momentum & CAGR |
Accelerate at a CAGR of 12.7% |
|
Market growth 2025-2029 |
USD 10843.5 million |
|
Market structure |
Fragmented |
|
YoY growth 2024-2025(%) |
11.4 |
|
Key countries |
US, Canada, UK, China, Germany, France, Italy, Japan, India, and Mexico |
|
Competitive landscape |
Leading Companies, Market Positioning of Companies, Competitive Strategies, and Industry Risks |
Why Choose Technavio for IT Service Management (ITSM) Market Insights?
"Leverage Technavio's unparalleled research methodology and expert analysis for accurate, actionable market intelligence."
The market is experiencing significant growth as businesses recognize the need for more efficient and effective service delivery. One key area of focus is implementing the ITIL framework for service desks, which automates incident management workflows and improves service level agreements (SLAs) through ITSM. Operational efficiency metrics, such as mean time to resolve (MTTR) and first contact resolution (FCR), are crucial for measuring the success of these initiatives. Configuration management databases (CMDBs) are essential for managing IT assets and configurations, enabling organizations to optimize request fulfillment processes and streamline change management through automation. Problem management processes are enhanced through Root Cause Analysis (RCA), which reduces the number of recurring incidents and improves overall service quality. Building a comprehensive service catalog and a robust knowledge management system are also vital components of ITSM. The former allows for effective company management for IT services, while the latter facilitates self-service portals for employees, reducing the burden on the service desk and improving operational planning and supply chain efficiency by up to 20%. ITSM maturity is improved through continuous service improvement, risk mitigation strategies, and capacity planning for peak demand using models. Monitoring IT service availability with dashboards and planning for service continuity, including effective disaster recovery strategies and security incident response plans, are essential for maintaining business continuity and regulatory compliance. Regular compliance audits for ITSM ensure that organizations remain in line with industry standards and best practices.
What are the Key Data Covered in this IT Service Management (ITSM) Market Research and Growth Report?
-
What is the expected growth of the IT Service Management (ITSM) Market between 2025 and 2029?
-
USD 10.84 billion, at a CAGR of 12.7%
-
-
What segmentation does the market report cover?
-
The report is segmented by Application (CM, ITAM and ITSD, A and PM, NM, and Others), Deployment (Cloud and On-premises), Sector (Large enterprises and Small and medium enterprises (SMEs)), and Geography (North America, Europe, APAC, Middle East and Africa, and South America)
-
-
Which regions are analyzed in the report?
-
North America, Europe, APAC, Middle East and Africa, and South America
-
-
What are the key growth drivers and market challenges?
-
Enhanced customer and user experience by minimizing impact of service disruptions, Lack of access to quality data
-
-
Who are the major players in the IT Service Management (ITSM) Market?
-
Atlassian Corp., BMC Software Inc., Broadcom Inc., EasyVista SA, Freshworks Inc., Hewlett Packard Enterprise Co., Hornbill Corporate Ltd., IFS World Operations AB, Infosys Ltd., International Business Machines Corp., Ivanti Software Inc., Open Text Corp., ServiceNow Inc., SolarWinds Corp., SysAid Technologies Ltd, TOPdesk, Topicus.com Inc., Vivantio, Wipro Ltd., and Zoho Corp. Pvt. Ltd.
-
We can help! Our analysts can customize this it service management (itsm) market research report to meet your requirements.
 RIA -
RIA - 
