
Intravenous Fluid Monitoring Devices Market Size 2025-2029
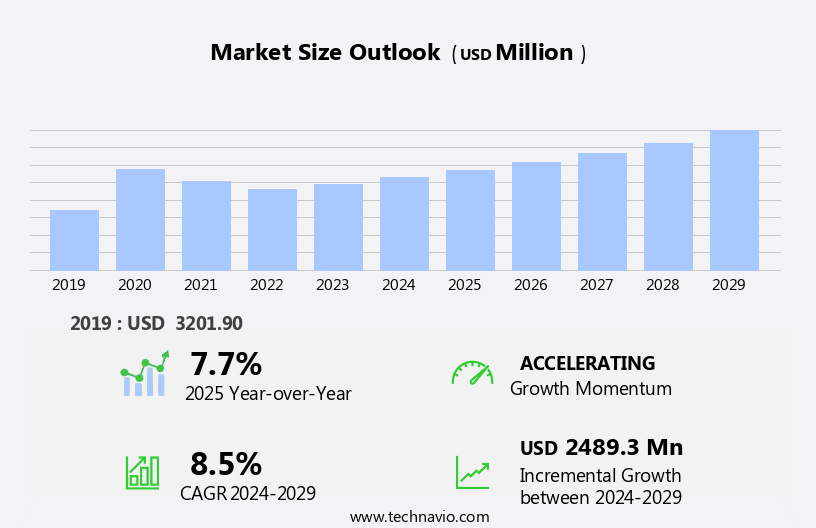
The intravenous (IV) fluid monitoring devices market size is forecast to increase by USD 2.49 billion at a CAGR of 8.5% between 2024 and 2029.
- The market is experiencing significant growth due to the increasing number of hospitalizations and the rising incidence of diseases requiring intravenous fluid therapy. According to various reports, the global hospitalization rate is projected to increase by 2% annually, leading to a swell in demand for advanced IV fluid monitoring systems. These devices enable healthcare professionals to closely monitor patients' fluid intake and output, ensuring optimal hydration and preventing complications such as dehydration, electrolyte imbalances, and sepsis. However, the market growth is not without challenges. Technical limitations of IV fluid monitoring systems, such as inaccurate readings and calibration issues, continue to pose significant hurdles.
- Manufacturers must invest in research and development to address these challenges and introduce more accurate and reliable devices. The integration of computers and electronic health records (EHRs) into medical systems is becoming increasingly important, enabling better data management, device integration, and clinical decision-making. Additionally, infusion systems are evolving with advancements in automation and connectivity, enhancing patient safety and treatment precision. The use of specialized materials such as rubber in medical device components is also essential for ensuring durability, flexibility, and biocompatibility.
What will be the Size of the Intravenous (IV) Fluid Monitoring Devices Market during the forecast period?
- The market encompasses a range of medical devices used to assess and manage fluid volume status in patients undergoing intravenous infusion therapy. This market is driven by the growing demand for hydration management in various clinical settings, including hospitals and home care. Product development in this space is focused on enhancing clinical workflow efficiency, improving patient engagement, and ensuring regulatory compliance. Clinical trials and research continue to advance the use of IV fluid monitoring devices in areas such as drug dosing, patient outcomes, and personalized medicine. Emerging technologies, including artificial intelligence (AI), medical informatics, and data visualization, are increasingly being integrated into IV fluid monitoring systems to facilitate early detection and predictive analytics.
- Cost-effective care and patient-centric care are key priorities in the healthcare industry, leading to increased adoption of IV fluid monitoring devices that offer remote patient monitoring capabilities and cloud computing for data storage and access. FDA approval, data security, and data privacy are critical considerations in the development and implementation of these devices. Additionally, the integration of machine learning (ML) and big data analytics is enabling more precise pharmacokinetic monitoring and clinical outcomes. Point-of-care diagnostics and clinical informatics are also playing an essential role in the advancement of IV fluid therapy. Overall, the IV fluid monitoring devices market is poised for significant growth, driven by the need for accurate and efficient hydration management and the integration of emerging technologies to enhance patient care.
How is this Intravenous (IV) Fluid Monitoring Devices Industry segmented?
The intravenous (IV) fluid monitoring devices industry research report provides comprehensive data (region-wise segment analysis), with forecasts and estimates in "USD million" for the period 2025-2029, as well as historical data from 2019-2023 for the following segments.
- End-user
- Hospitals and clinics
- ASCs
- Home care
- Type
- Desktop
- Portable
- Technology
- Smart devices
- Traditional monitoring systems
- Geography
- North America
- US
- Canada
- Europe
- France
- Germany
- Italy
- UK
- Asia
- China
- India
- Japan
- Rest of World (ROW)
- North America
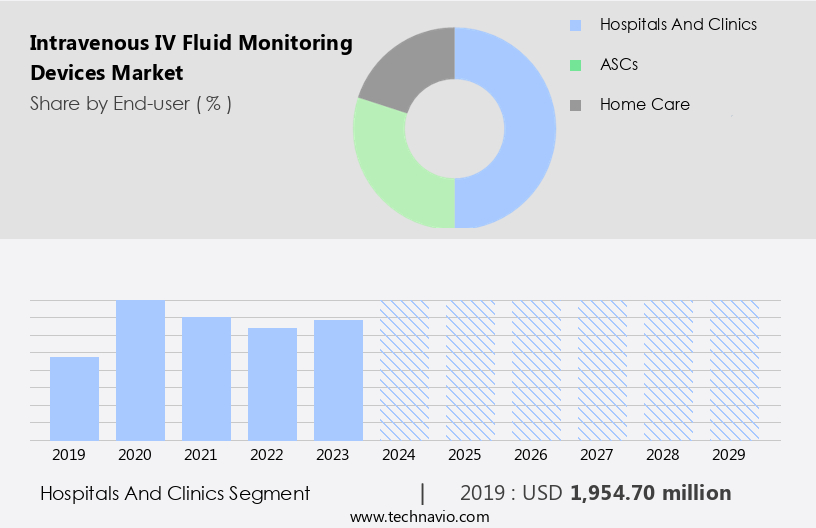
By End-user Insights
The hospitals and clinics segment is estimated to witness significant growth during the forecast period. Intravenous (IV) Fluid Monitoring Devices are essential tools in hospitals and clinics, enabling efficient and effective patient care. Hospitals and clinics, particularly large multispecialty hospitals and hospital groups, are the primary end-users of these devices due to their advanced medical infrastructure and high patient volume. These institutions offer various inpatient and outpatient services, including critical care, acute care, ambulatory care, and home healthcare. IV Fluid Monitoring Devices offer several benefits, including Data Analytics for clinical decision support, workflow optimization, and medication administration. Smart IV Lines and Smart Infusion Pumps with real-time monitoring capabilities ensure infusion rate control, fluid balance monitoring, and fluid overload detection.
Alert systems for medication errors, dehydration prevention, and patient compliance enhance patient safety. Non-invasive monitoring using biometric data, pressure sensors, and impedance sensors facilitate early detection of fluid overload and electrolyte imbalances. Portable devices and wearable technology with wireless connectivity enable remote monitoring and cost reduction. Compliance monitoring and fluid volume monitoring are crucial in preventing adverse events and improving patient outcomes. The market dynamics for IV Fluid Monitoring Devices are driven by the increasing demand for patient safety, efficiency improvements, and cost reduction. The integration of clinical data, drug delivery, and real-time monitoring enhances the overall quality of care.
The future of IV Fluid Monitoring Devices lies in advanced technologies such as wireless technology, wearable technology, and biometric sensors, which offer remote monitoring capabilities and improved patient outcomes.
Get a glance at the market report of share of various segments Request Free Sample
The Hospitals and clinics segment was valued at USD 1.95 billion in 2019 and showed a gradual increase during the forecast period.
Regional Analysis
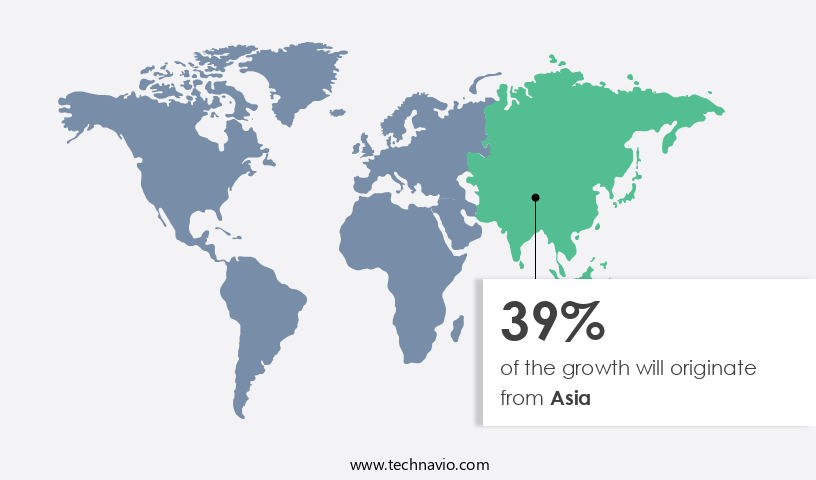
Asia is estimated to contribute 39% to the growth of the global market during the forecast period.Technavio's analysts have elaborately explained the regional trends and drivers that shape the market during the forecast period.
For more insights on the market size of various regions, Request Free Sample
The market in North America is experiencing significant growth due to several factors. Chronic diseases such as diabetes, cancer, and arthritis, which require extensive IV fluid management, are increasingly prevalent among the region's population. Furthermore, the aging population, with an estimated 71.5 million adults aged 65 and above by 2030, according to the CDC, necessitates advanced IV fluid monitoring solutions. Innovative devices, including smart IV lines, smart infusion pumps, and portable devices, are being developed to optimize workflow, enhance patient safety, and improve efficiency in hospital care. These devices offer features such as data analytics, alert systems, medication administration, and real-time monitoring, enabling clinicians to make informed decisions and prevent medication errors, dehydration, and fluid overload.
Moreover, the market is witnessing the adoption of wearable technology and wireless communication for non-invasive monitoring and remote patient care in outpatient and ambulatory settings. Cost reduction and compliance monitoring are also essential considerations, driving the market's growth. Fluid balance monitoring, infusion rate control, and electrolyte monitoring are critical aspects of IV fluid management, addressed by these advanced devices. The market is further bolstered by the integration of clinical decision support systems, biometric data, and pressure sensors for fluid volume monitoring. These technologies enable healthcare providers to improve patient outcomes, reduce hospital readmissions, and enhance patient satisfaction. Overall, the market in North America is poised for continued growth, driven by the need for advanced IV fluid management solutions in acute care, critical care, and home healthcare settings.
Market Dynamics
Our researchers analyzed the data with 2024 as the base year, along with the key drivers, trends, and challenges. A holistic analysis of drivers will help companies refine their marketing strategies to gain a competitive advantage.
What are the key market drivers leading to the rise in the adoption of Intravenous (IV) Fluid Monitoring Devices Industry?
- Increase in number of hospitalizations is the key driver of the market. The global population growth and the rising prevalence of chronic and acute diseases are leading to an increase in hospitalizations worldwide. Chronic diseases, such as hypertension, spinal abnormalities, cardiovascular diseases, GI diseases, urological diseases, diabetes, cancer, and orthopedic deformities, are becoming increasingly common due to sedentary lifestyles, environmental issues, alcohol consumption, lack of physical activity, smoking, and unhealthy eating habits. This trend is driving the demand for infusion therapy devices, which help reduce mortality rates caused by these diseases. Infusion therapy devices, including intravenous (IV) fluid monitoring devices, enable efficient and accurate administration of fluids, medications, and nutrients directly into a patient's bloodstream.
- These devices are essential in hospitals and healthcare settings for managing various medical conditions, making them indispensable in modern healthcare. The increasing incidence of infectious diseases and the need for effective disease management are further fueling the demand for advanced IV fluid monitoring devices.
What are the market trends shaping the Intravenous (IV) Fluid Monitoring Devices Industry?
- Increasing incidence of diseases is the upcoming market trend. The global IV fluid monitoring devices market is experiencing significant growth due to several factors. The rising prevalence of chronic diseases and conditions, such as colorectal and bladder cancer, inflammatory bowel diseases like Crohn's disease and ulcerative colitis, and diverticular disease, is driving the demand for these devices.
- According to the International Diabetes Federation, the global diabetes prevalence rate was approximately 589 million people in 2021, and it is projected to increase to around 853 million by 2050. The high prevalence of diabetes significantly contributes to the market's growth. Sedentary lifestyles and changing climatic conditions also play a role in market expansion. These factors underscore the importance of IV fluid monitoring devices in ensuring patient safety and improving clinical outcomes.
What challenges does the Intravenous (IV) Fluid Monitoring Devices Industry face during its growth?
- Technical limitations of IV fluid monitoring systems is a key challenge affecting the industry growth. Class II intravenous (IV) fluid monitoring devices, which include subcutaneous, implanted, infusion pumps, percutaneous, and long-term IV catheters, are subject to stringent regulations by the Food and Drug Administration (FDA) due to their increased risk compared to Class I devices. The FDA imposes special controls in addition to general controls to ensure the safety and effectiveness of these devices. These controls mandate special labeling, adherence to international and mandatory performance standards, and post-market surveillance. Manufacturers must submit a 510(k) clearance to market application and undergo FDA review prior to marketing these devices.
- The FDA categorizes these devices as Class II medical devices due to their potential to cause harm if not properly used or maintained. Ensuring regulatory compliance is essential for manufacturers to enter and maintain a presence in this market.
Exclusive Customer Landscape
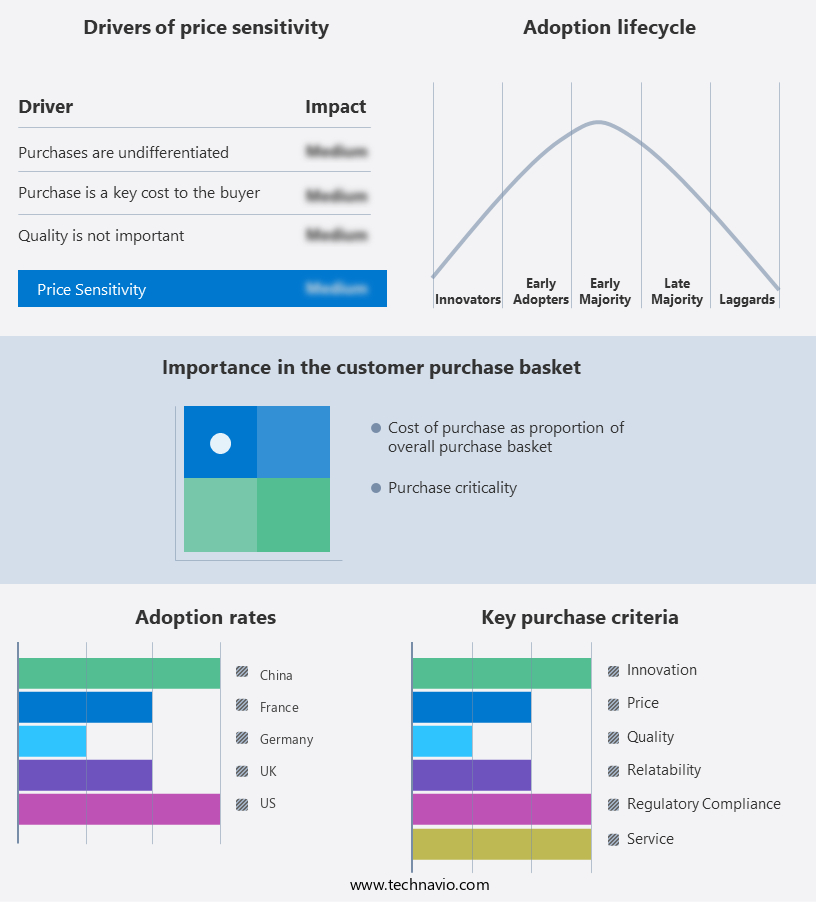
The intravenous (IV) fluid monitoring devices market forecasting report includes the adoption lifecycle of the market, covering from the innovator's stage to the laggard's stage. It focuses on adoption rates in different regions based on penetration. Furthermore, the intravenous (IV) fluid monitoring devices market report also includes key purchase criteria and drivers of price sensitivity to help companies evaluate and develop their market growth analysis strategies.
Customer Landscape
Key Companies & Market Insights
Companies are implementing various strategies, such as strategic alliances, intravenous (IV) fluid monitoring devices market forecast, partnerships, mergers and acquisitions, geographical expansion, and product/service launches, to enhance their presence in the industry.
B.Braun SE -The company offers IV fluid monitoring devices such as the Infusomat Space and Perfusor Space, smart infusion pumps with integrated monitoring capabilities.
The industry research and growth report includes detailed analyses of the competitive landscape of the market and information about key companies, including:
- B.Braun SE
- Baxter International Inc.
- BC Group International Inc.
- Becton Dickinson and Co.
- Datrend Systems Inc.
- EVELABS TECHNOLOGIES Pvt. Ltd.
- FIVAmed Inc.
- Fortive Corp.
- Gossen Metrawatt GmbH
- ICU Medical Inc.
- IRadimed Corp.
- ivWatch LLC
- Micrel Medical Devices SA
- MONIDOR Oy Ltd.
- NETECH Corp.
- Pentland Medical Ltd.
- Pronk Technologies Inc.
- Seaward Electronic Ltd.
- Shift Labs Inc.
- Sino Medical Device Technology Co. Ltd.
Qualitative and quantitative analysis of companies has been conducted to help clients understand the wider business environment as well as the strengths and weaknesses of key industry players. Data is qualitatively analyzed to categorize companies as pure play, category-focused, industry-focused, and diversified; it is quantitatively analyzed to categorize companies as dominant, leading, strong, tentative, and weak.
Research Analyst Overview
The intravenous (IV) fluid monitoring market encompasses a range of advanced devices designed to optimize the delivery and management of IV fluids in various healthcare settings. These technologies aim to enhance patient safety, improve clinical outcomes, and reduce costs through data analytics, workflow optimization, and real-time monitoring. Smart IV lines and infusion pumps are at the forefront of this market, integrating advanced features such as alert systems, compliance monitoring, and medication administration. These devices enable healthcare providers to maintain precise fluid balance, prevent fluid overload, and ensure accurate medication dosages. The increasing prevalence of outpatient care and ambulatory settings has led to the development of portable and wearable IV fluid monitoring devices.
These devices offer the benefits of IV fluid management in a more convenient and cost-effective manner, making them an attractive option for both patients and healthcare providers. Fluid balance monitoring is a critical aspect of IV fluid management, and various technologies are employed to achieve this goal. Pressure sensors, impedance sensors, and biometric data analysis are among the techniques used to monitor fluid volume and detect fluid overload in real-time. Wireless technology and wearable devices have revolutionized IV fluid monitoring, enabling remote monitoring and real-time data access. This allows for more efficient clinical decision-making, improved patient safety, and reduced healthcare costs.
Cost reduction is a significant driver in the IV fluid monitoring market, with many devices designed to minimize the overall cost of care. Smart infusion pumps, for example, offer cost savings through improved medication efficiency and reduced waste. The integration of clinical data and drug delivery systems into IV fluid monitoring devices further enhances their value. Real-time access to patient data enables healthcare providers to make informed decisions regarding fluid management and medication administration, leading to improved patient outcomes and reduced medication errors. Electrolyte monitoring is another essential feature of advanced IV fluid monitoring devices.
These devices allow for the continuous monitoring of essential electrolytes, ensuring proper fluid balance and preventing dehydration or electrolyte imbalances. In critical care settings, IV fluid monitoring plays a crucial role in managing acute care patients. These devices provide real-time data on fluid balance, infusion rates, and patient status, enabling healthcare providers to respond quickly to changes in patient condition and optimize care. The intravenous fluid monitoring market is characterized by continuous innovation and advancement, driven by the need for improved patient safety, cost reduction, and clinical efficiency. The integration of data analytics, workflow optimization, and real-time monitoring into IV fluid management devices is transforming the way healthcare is delivered, ultimately leading to better patient outcomes and more cost-effective care.
|
Market Scope |
|
|
Report Coverage |
Details |
|
Page number |
214 |
|
Base year |
2024 |
|
Historic period |
2019-2023 |
|
Forecast period |
2025-2029 |
|
Growth momentum & CAGR |
Accelerate at a CAGR of 8.5% |
|
Market growth 2025-2029 |
USD 2.50 billion |
|
Market structure |
Fragmented |
|
YoY growth 2024-2025(%) |
7.7 |
|
Key countries |
US, Canada, Germany, France, UK, China, Japan, Brazil, Italy, and India |
|
Competitive landscape |
Leading Companies, Market Positioning of Companies, Competitive Strategies, and Industry Risks |
What are the Key Data Covered in this Intravenous (IV) Fluid Monitoring Devices Market Research and Growth Report?
- CAGR of the Intravenous (IV) Fluid Monitoring Devices industry during the forecast period
- Detailed information on factors that will drive the growth and forecasting between 2025 and 2029
- Precise estimation of the size of the market and its contribution of the industry in focus to the parent market
- Accurate predictions about upcoming growth and trends and changes in consumer behaviour
- Growth of the market across North America, Europe, Asia, and Rest of World (ROW)
- Thorough analysis of the market's competitive landscape and detailed information about companies
- Comprehensive analysis of factors that will challenge the intravenous (IV) fluid monitoring devices market growth and forecasting
We can help! Our analysts can customize this intravenous (IV) fluid monitoring devices market research report to meet your requirements.
 RIA -
RIA - 
