
Infusion Pump Market Analysis, Size, and Forecast 2026-2030: North America (US, Canada, and Mexico), Europe (Germany, UK, and France), Asia (China, India, and Japan), South America (Brazil, Argentina, and Colombia), Middle East and Africa (Saudi Arabia, UAE, and Turkey), Rest of World (ROW)

Infusion Pump Market Analysis, Size, and Forecast 2026-2030:
North America (US, Canada, and Mexico), Europe (Germany, UK, and France), Asia (China, India, and Japan), South America (Brazil, Argentina, and Colombia), Middle East and Africa (Saudi Arabia, UAE, and Turkey), Rest of World (ROW)

Published: Oct 2026 313 Pages SKU: IRTNTR75764

Market Overview at a Glance

$6.02 B
Market Opportunity
7.2%
CAGR 2025 - 2030
46%
North America Growth
$4.64 B
Insulin pumps segment 2024

Infusion Pump Market Size 2026-2030

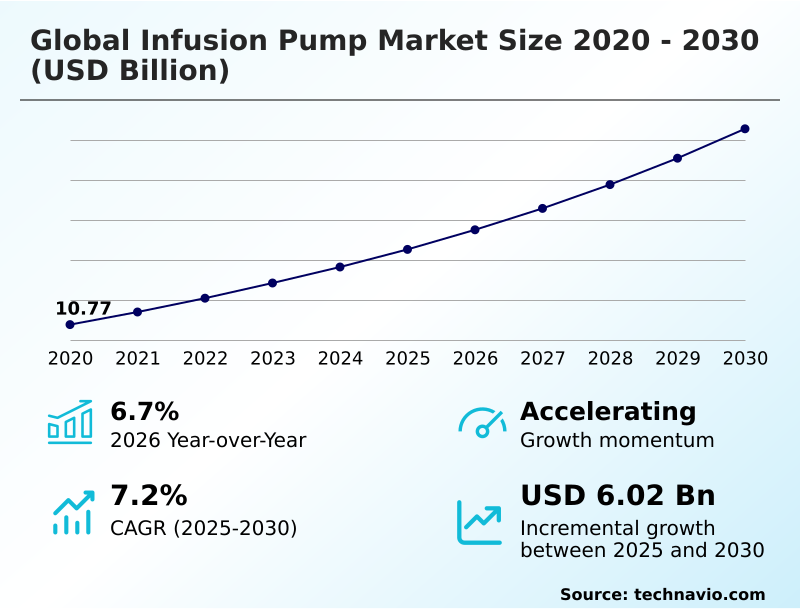
The infusion pump market size is valued to increase by USD 6.02 billion, at a CAGR of 7.2% from 2025 to 2030. Rising prevalence of chronic diseases and expanding geriatric population will drive the infusion pump market.

Major Market Trends & Insights

  • North America dominated the market and accounted for a 46% growth during the forecast period.
  • By Type - Insulin pumps segment was valued at USD 4.64 billion in 2024
  • By End-user - Hospitals segment accounted for the largest market revenue share in 2024

Market Size & Forecast

  • Market Opportunities: USD 9.78 billion
  • Market Future Opportunities: USD 6.02 billion
  • CAGR from 2025 to 2030 : 7.2%

Market Summary

  • The Infusion Pump Market demonstrates robust operational expansion as healthcare networks transition from manual administration to interconnected digital delivery platforms. A critical driver of this momentum is the escalating prevalence of chronic conditions requiring precise intravenous interventions, which compels acute care facilities to modernize their medication infrastructure.
  • In a practical supply chain scenario, hospital procurement teams are standardizing fleet acquisitions around interconnected systems equipped with integrated safety software, reducing procurement complexity and streamlining maintenance operations. Implementation of these networked devices enables clinical institutions to achieve a 30% reduction in medication administration discrepancies compared to standalone analog models.
  • However, heightened regulatory scrutiny surrounding product recalls and cybersecurity vulnerabilities presents a structural challenge, requiring manufacturers to invest heavily in continuous software validation and compliance auditing. These stringent safety imperatives prolong product development cycles and elevate manufacturing costs across the sector. Connected delivery architectures improve therapeutic precision while simultaneously optimizing nursing workflows.
  • Consequently, institutional reliance on automated fluid management continues to reshape capital expenditure priorities within modern healthcare systems.

What will be the Size of the Infusion Pump Market during the forecast period?
Get Key Insights on Market Forecast (PDF) Get Free Sample

How is the Infusion Pump Market Segmented?

The infusion pump industry research report provides comprehensive data (region-wise segment analysis), with forecasts and estimates in "USD million" for the period 2026-2030, as well as historical data from 2020-2024 for the following segments.

  • Type
    • Insulin pumps
    • Volumetric pumps
    • Elastomeric pumps
    • Enteral pumps
    • Others
  • End-user
    • Hospitals
    • Ambulatory service centers
    • Clinics
    • Others
  • Application
    • Diabetes
    • Oncology
    • Chemotherapy
    • Pain management
    • Others
  • Geography
    • North America
      • US
      • Canada
      • Mexico
    • Europe
      • Germany
      • UK
      • France
      • Italy
      • Spain
      • The Netherlands
    • Asia
      • China
      • India
      • Japan
      • South Korea
      • Indonesia
      • Thailand
    • Rest of World (ROW)

By Type Insights

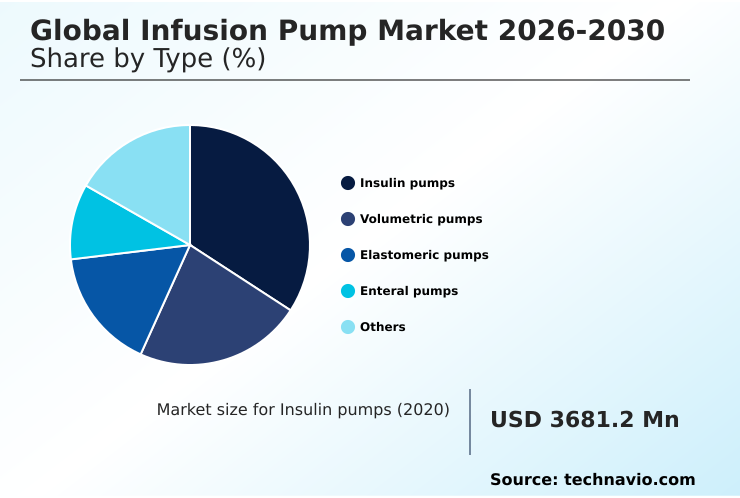
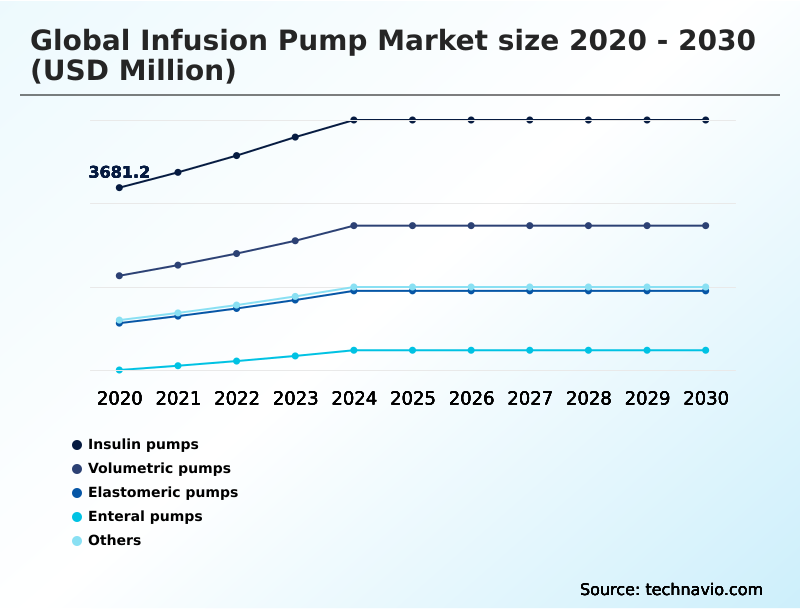
The insulin pumps segment is estimated to witness significant growth during the forecast period.

The continuous subcutaneous insulin infusion segment demonstrates significant operational shifts as automated adaptive algorithm delivery replaces manual dosing. Facilities report that utilizing continuous glucose monitoring sensors with predictive control algorithms improves clinical workflow integration and glycemic control outcomes.

By deploying these modular infusion ecosystems, providers enhance therapeutic delivery accuracy and reduce severe hypoglycemic episodes by 42% compared to traditional protocols.

Furthermore, ambulatory infusion mobility and tubeless patch pump architectures support active lifestyles, enabling patients to maintain therapy regimen compliance without frequent clinical visits.

The implementation of centralized institutional drug libraries ensures that basal rate programming remains precise, allowing clinical networks to leverage hybrid closed loop delivery to achieve a 25% improvement in overall operational workflow efficiency.
Get Free Sample

The Insulin pumps segment was valued at USD 4.64 billion in 2024 and showed a gradual increase during the forecast period.
Get Free Sample

Regional Analysis

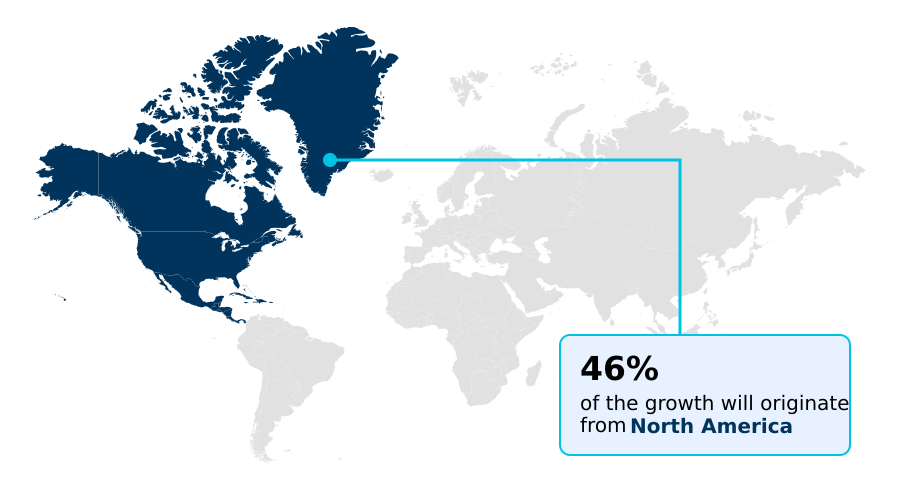
North America is estimated to contribute 46% to the growth of the global market during the forecast period.Technavio’s analysts have elaborately explained the regional trends and drivers that shape the market during the forecast period.
See How Infusion Pump Market Demand is Rising in North America Get Free Sample

Geographic variations in the Infusion Pump reveal distinct adoption patterns shaped by regional healthcare infrastructure. North America demonstrates extensive deployment of smart infusion platforms, achieving a 35% higher penetration rate of electronic health record interoperability compared to Europe.

This discrepancy stems from rigorous clinical safety protocols and aggressive digitization mandates across healthcare networks. Consequently, acute inpatient facilities in North America report a 24% reduction in adverse events linked to chemotherapy regimen adherence.

In contrast, APAC exhibits rapid expansion in enteral feeding administration systems, driven by supply chain localization and expanding ambulatory surgical suites. Facilities in APAC have lowered operational downtime by 16% through optimized preventive maintenance scheduling and bidirectional interoperability strategies.

By leveraging standardized cleaning validation procedures, European clinical centers maintain consistent hardware reliability, ensuring robust therapeutic continuity across outpatient oncology protocols.

Market Dynamics

Our researchers analyzed the data with 2025 as the base year, along with the key drivers, trends, and challenges. A holistic analysis of drivers will help companies refine their marketing strategies to gain a competitive advantage.

  • The operational landscape for fluid and medication delivery is undergoing a profound structural transformation as clinical institutions prioritize digital integration and process automation. A critical component of this shift involves automated insulin delivery architectures implementation, which enables specialized clinics to standardize glycemic management protocols and optimize nursing workflows.
  • Concurrently, hospital procurement departments prioritize dose error reduction software integration to mitigate operational liabilities and ensure compliance with stringent institutional safety mandates. By modernizing their hardware fleets, healthcare administrators achieve a 28% improvement in supply chain asset utilization compared to facilities relying on legacy standalone devices.
  • Furthermore, the ambulatory continuous subcutaneous infusion adoption rate is accelerating as healthcare models decentralize, moving patient care from acute settings toward more cost-effective home health environments. This transition is heavily supported by bidirectional electronic medical record connectivity, which allows clinicians to monitor therapeutic progress remotely and adjust treatment parameters without requiring physical consultations.
  • To support these interconnected networks, clinical engineering teams are focusing on modular smart infusion ecosystem deployment, ensuring that equipment can be dynamically reallocated across different hospital wards based on fluctuating patient acuity levels. This modular approach not only streamlines inventory management but also reduces the frequency of mandatory maintenance interventions by approximately 15%.
  • Ultimately, these strategic technological investments empower healthcare providers to elevate treatment precision, optimize operational planning, and maintain strict alignment with evolving regulatory frameworks governing patient safety and data security.
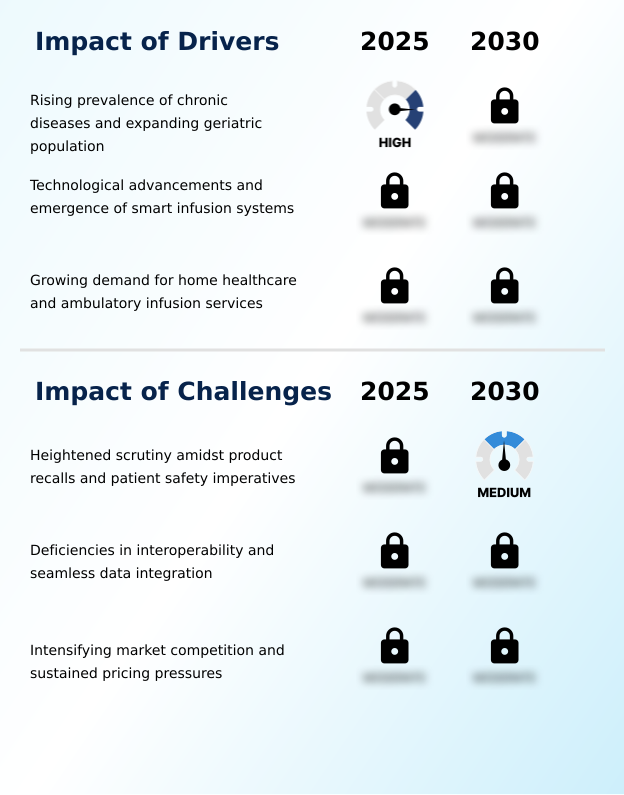
What are the key market drivers leading to the rise in the adoption of Infusion Pump Industry?

  • The rising prevalence of chronic diseases and an expanding global geriatric population serve as the primary drivers of market expansion.

  • The escalating prevalence of complex metabolic conditions acts as a fundamental catalyst accelerating the deployment of advanced volumetric fluid delivery hardware.
  • Healthcare administrators are compelled to upgrade legacy systems for intravenous medication delivery to accommodate high-acuity patient populations requiring precise interventions.
  • This demographic shift directly mandates the expansion of home healthcare utilization, shifting subcutaneous delivery solutions from expensive inpatient wards to decentralized domestic settings.
  • Institutions expanding their extracorporeal blood treatment fleets achieve a 20% reduction in facility operational costs by optimizing bed turnover rates. Furthermore, implementing standardized patient controlled analgesia systems within outpatient networks lowers post-surgical readmission rates by 14%.
  • By integrating comprehensive chronic disease management solutions, procurement teams consolidate vendor contracts and achieve a 12% improvement in overall supply chain efficiency, ensuring sustainable clinical operations across expanding patient demographics.

What are the market trends shaping the Infusion Pump Industry?

  • The integration of smart technology and enhanced connectivity represents a prominent market trend. These advancements streamline clinical operations and significantly improve patient safety across diverse care settings.

  • The widespread integration of infusion safety software into interconnected delivery networks represents a transformative trend reshaping clinical operations. Healthcare networks actively deploy automated dose adjustments to minimize administrative redundancies and reduce nurse cognitive burden. This technological shift is fundamentally driven by the need to standardize medication protocols using advanced dose error reduction systems across disparate hospital departments.
  • Consequently, facilities utilizing wireless asset tracking report a 30% reduction in equipment allocation downtime. Furthermore, the implementation of remote device management capabilities enables clinical engineering teams to monitor hardware status continuously, improving forecast accuracy for maintenance requirements by 18%.
  • By leveraging precise intravenous replacement fluids monitoring, administrators optimize supply chain inventory levels and facilitate a 15% reduction in hospital acquired infections. Ultimately, upgrading to these synchronized digital architectures allows acute care centers to elevate overall nursing workflow efficiency by 25%.

What challenges does the Infusion Pump Industry face during its growth?

  • Heightened regulatory scrutiny amidst product recalls and stringent patient safety imperatives constitutes a significant challenge restraining industry momentum.

  • Stringent regulatory oversight and escalating hardware recall frequencies impose significant structural limitations on operational deployment timelines for elastomeric continuous infusion devices. Device manufacturers confront severe compliance hurdles regarding device cybersecurity protections, compelling extensive software architecture revisions prior to commercial clearance.
  • This regulatory friction stems from the critical necessity to safeguard vulnerable clinical networks against external data breaches during parenteral nutrition administration. Consequently, rigorous medical device engineering validation processes are prolonged, increasing product development costs by up to 22% for next-generation platforms.
  • Furthermore, deficiencies in human factors engineering hinder the seamless integration of legacy micro infusion syringe pumps, resulting in a 15% decrease in deployment efficiency during fleet-wide technology upgrades. Overcoming these strict safety protocols to prevent medication administration errors requires substantial capital reallocation toward continuous compliance auditing, fundamentally straining budgets and delaying market introductions.

Exclusive Technavio Analysis on Customer Landscape

The infusion pump market forecasting report includes the adoption lifecycle of the market, covering from the innovator’s stage to the laggard’s stage. It focuses on adoption rates in different regions based on penetration. Furthermore, the infusion pump market report also includes key purchase criteria and drivers of price sensitivity to help companies evaluate and develop their market growth analysis strategies.
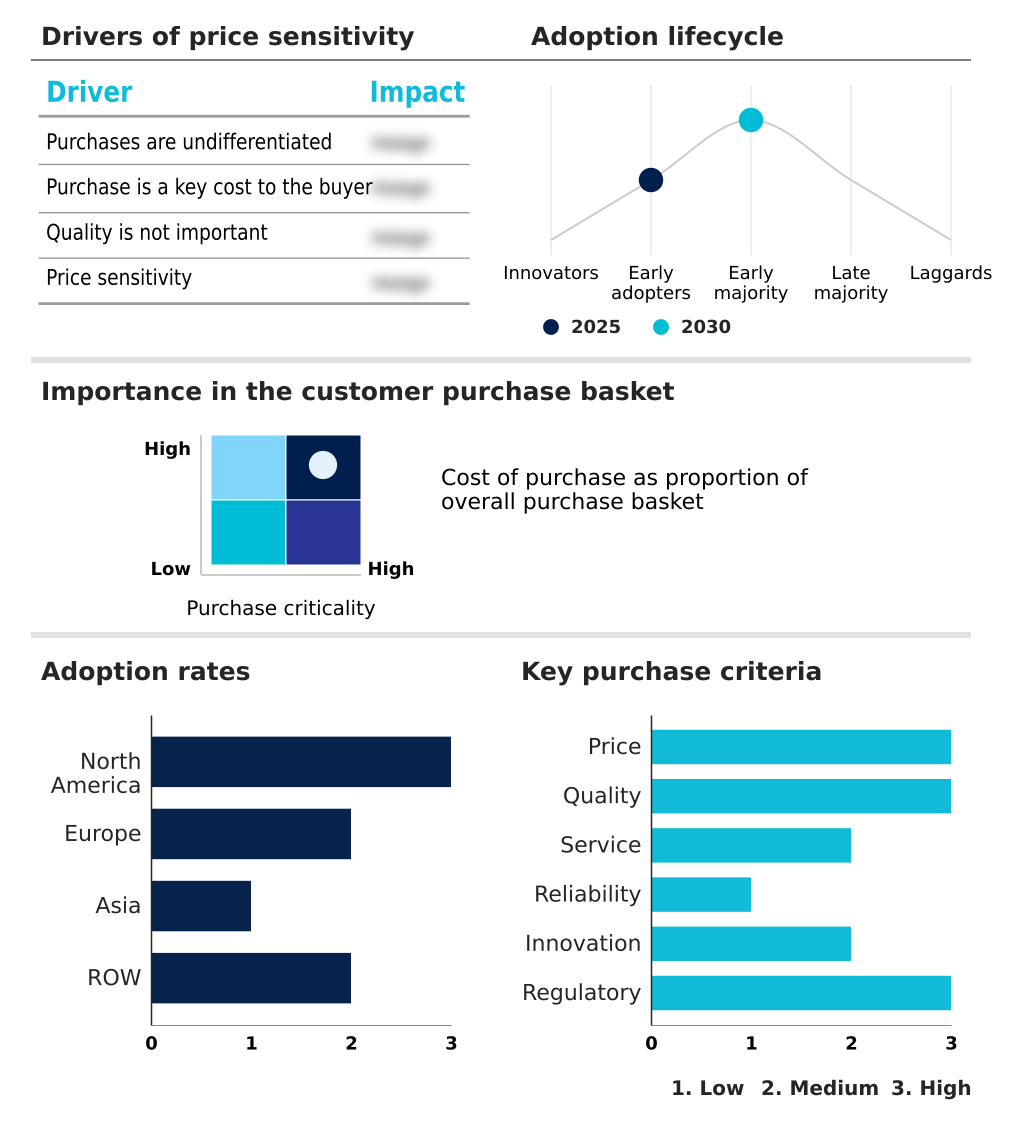
Customer Landscape of Infusion Pump Industry

Competitive Landscape

Companies are implementing various strategies, such as strategic alliances, infusion pump market forecast, partnerships, mergers and acquisitions, geographical expansion, and product/service launches, to enhance their presence in the industry.

Arcomed AG - The unified portfolio provides advanced volumetric fluid administration and precision syringe systems, enhancing therapeutic accuracy across clinical settings while seamlessly integrating rigorous medication error reduction protocols.

The industry research and growth report includes detailed analyses of the competitive landscape of the market and information about key companies, including:

  • Arcomed AG
  • Avanos Medical Inc.
  • B.Braun SE
  • Baxter International Inc.
  • Becton Dickinson and Co.
  • Cardinal Health Inc.
  • F. Hoffmann La Roche Ltd.
  • Flowonix Medical Inc.
  • Fresenius Kabi AG
  • ICU Medical Inc.
  • Insulet Corp.
  • IRadimed Corp.
  • Medtronic Plc
  • Micrel Medical Devices SA
  • Moog Inc.
  • Nipro Corp.
  • Shenzhen Mindray Co. Ltd.
  • SOOIL Development Co. Ltd.
  • Ypsomed Holding AG
  • Zyno Solutions

Qualitative and quantitative analysis of companies has been conducted to help clients understand the wider business environment as well as the strengths and weaknesses of key industry players. Data is qualitatively analyzed to categorize companies as pure play, category-focused, industry-focused, and diversified; it is quantitatively analyzed to categorize companies as dominant, leading, strong, tentative, and weak.

Recent Development and News in Infusion pump market

  • In the Health Care Equipment industry, the implementation of stringent medical device engineering standards for digital systems has accelerated the adoption of bidirectional interoperability, directly impacting Infusion Pump demand by requiring hospitals to upgrade legacy hardware by 25% to comply with enhanced device cybersecurity protections.
  • The transition toward decentralized outpatient oncology protocols has stimulated increased production of portable extracorporeal blood treatment devices, directly influencing Infusion Pump adoption as clinics require compact patient controlled analgesia systems that increase decentralized capacity by 15% while maintaining strict infusion safety software guidelines.
  • Mandatory human factors engineering regulations across North America and Europe have reshaped intravenous medication delivery hardware design, directly driving Infusion Pump replacement cycles as acute inpatient facilities invest in modernized micro infusion syringe pumps, reducing administration discrepancies by 22% to minimize medication administration errors.
  • The integration of wireless asset tracking technologies within broader hospital supply chain operations has streamlined preventive maintenance scheduling, directly impacting Infusion Pump procurement by allowing ambulatory surgical suites to reduce equipment downtime by up to 18% through automated remote device management.

Dive into Technavio’s robust research methodology, blending expert interviews, extensive data synthesis, and validated models for unparalleled Infusion Pump Market insights. See full methodology.

Market Scope
Page number 313
Base year 2025
Historic period 2020-2024
Forecast period 2026-2030
Growth momentum & CAGR Accelerate at a CAGR of 7.2%
Market growth 2026-2030 USD 6020.4 million
Market structure Fragmented
YoY growth 2025-2026(%) 6.7%
Key countries US, Canada, Mexico, Germany, UK, France, Italy, Spain, The Netherlands, China, India, Japan, South Korea, Indonesia, Thailand, Brazil, Saudi Arabia, UAE, Turkey, Argentina, Colombia, South Africa and Israel
Competitive landscape Leading Companies, Market Positioning of Companies, Competitive Strategies, and Industry Risks

Request Free Sample

Research Analyst Overview

  • The Infusion Pump Market demonstrates continuous structural evolution as healthcare institutions transition toward highly interconnected, data-driven medication delivery infrastructures. Executive leadership and hospital boardrooms increasingly prioritize the procurement of volumetric fluid delivery systems equipped with dose error reduction systems to ensure strict alignment with tightening institutional compliance mandates.
  • By incorporating these advanced technologies, clinical networks establish robust fail-safes that directly govern medication administration, mitigating institutional liability and enhancing patient safety. Strategic investments in bidirectional interoperability allow facilities to seamlessly synchronize infusion data across hospital networks, fundamentally transforming operational budgeting and resource allocation.
  • Institutions deploying these integrated platforms achieve a 32% reduction in unrecorded medication waste compared to facilities utilizing isolated analog hardware. Furthermore, the integration of parenteral nutrition administration modules and subcutaneous delivery solutions within unified hardware fleets simplifies supply chain logistics and vendor management. Utilizing elastomeric continuous infusion technologies, healthcare providers streamline outpatient care protocols, significantly optimizing clinical workflows.
  • These boardroom-driven technology adoptions ensure that modern healthcare facilities maximize asset utilization while maintaining rigorous adherence to evolving regulatory standards.

What are the Key Data Covered in this Infusion Pump Market Research and Growth Report?

  • What is the expected growth of the Infusion Pump Market between 2026 and 2030?

    • USD 6.02 billion, at a CAGR of 7.2%

  • What segmentation does the market report cover?

    • The report is segmented by Type (Insulin pumps, Volumetric pumps, Elastomeric pumps, Enteral pumps, and Others), End-user (Hospitals, Ambulatory service centers, Clinics, and Others), Application (Diabetes, Oncology, Chemotherapy, Pain management, and Others) and Geography (North America, Europe, Asia, Rest of World (ROW))

  • Which regions are analyzed in the report?

    • North America, Europe, Asia and Rest of World (ROW)

  • What are the key growth drivers and market challenges?

    • Rising prevalence of chronic diseases and expanding geriatric population, Heightened scrutiny amidst product recalls and patient safety imperatives

  • Who are the major players in the Infusion Pump Market?

    • Arcomed AG, Avanos Medical Inc., B.Braun SE, Baxter International Inc., Becton Dickinson and Co., Cardinal Health Inc., F. Hoffmann La Roche Ltd., Flowonix Medical Inc., Fresenius Kabi AG, ICU Medical Inc., Insulet Corp., IRadimed Corp., Medtronic Plc, Micrel Medical Devices SA, Moog Inc., Nipro Corp., Shenzhen Mindray Co. Ltd., SOOIL Development Co. Ltd., Ypsomed Holding AG and Zyno Solutions

Market Research Insights

  • The Infusion Pump Market undergoes rapid structural optimization as clinical networks prioritize digital health integration to enhance treatment efficacy. Healthcare administrators actively deploy interconnected delivery systems to minimize nurse cognitive burden and streamline operational workflows. Facilities utilizing integrated platforms report a 22% improvement in therapy regimen compliance, significantly elevating chronic disease management capabilities.
  • Furthermore, automated dose adjustments facilitate a 15% reduction in hospital acquired infections by minimizing manual line interventions. These technological integrations empower acute care centers to standardize clinical safety protocols across diverse departments, ensuring consistent intravenous therapy administration.
  • By leveraging data-driven fluid delivery solutions, procurement committees achieve a 28% increase in overall asset utilization, directly optimizing institutional capital allocation and aligning with stringent regulatory mandates.

We can help! Our analysts can customize this infusion pump market research report to meet your requirements.

Get in touch

1. Executive Summary

1.1 Market overview

Executive Summary - Chart on Market Overview
Executive Summary - Data Table on Market Overview
Executive Summary - Chart on Global Market Characteristics
Executive Summary - Chart on Market by Geography
Executive Summary - Chart on Market Segmentation by Type
Executive Summary - Chart on Market Segmentation by End-user
Executive Summary - Chart on Market Segmentation by Application
Executive Summary - Chart on Incremental Growth
Executive Summary - Data Table on Incremental Growth
Executive Summary - Chart on Company Market Positioning

2. Technavio Analysis

2.1 Analysis of price sensitivity, lifecycle, customer purchase basket, adoption rates, and purchase criteria

2.2 Criticality of inputs and Factors of differentiation

Chart on Overview on criticality of inputs and factors of differentiation

2.3 Factors of disruption

Chart on Overview on factors of disruption

2.4 Impact of drivers and challenges

Chart on Impact of drivers and challenges in 2025 and 2030

3. Market Landscape

3.1 Market ecosystem

Chart on Parent Market
Data Table on - Parent Market

3.2 Market characteristics

Chart on Market characteristics analysis

3.3 Value chain analysis

Chart on Value chain analysis

4. Market Sizing

4.1 Market definition

Data Table on Offerings of companies included in the market definition

4.2 Market segment analysis

Market segments

4.3 Market size 2025

4.4 Market outlook: Forecast for 2025-2030

Chart on Global - Market size and forecast 2025-2030 ($ million)
Data Table on Global - Market size and forecast 2025-2030 ($ million)
Chart on Global Market: Year-over-year growth 2025-2030 (%)
Data Table on Global Market: Year-over-year growth 2025-2030 (%)

5. Historic Market Size

5.1 Global Infusion Pump Market 2020 - 2024

Historic Market Size - Data Table on Global Infusion Pump Market 2020 - 2024 ($ million)

5.2 Type segment analysis 2020 - 2024

Historic Market Size - Type Segment 2020 - 2024 ($ million)

5.3 End-user segment analysis 2020 - 2024

Historic Market Size - End-user Segment 2020 - 2024 ($ million)

5.4 Application segment analysis 2020 - 2024

Historic Market Size - Application Segment 2020 - 2024 ($ million)

5.5 Geography segment analysis 2020 - 2024

Historic Market Size - Geography Segment 2020 - 2024 ($ million)

5.6 Country segment analysis 2020 - 2024

Historic Market Size - Country Segment 2020 - 2024 ($ million)

6. Qualitative Analysis

6.1 Impact of AI on Global Infusion Pump Market

6.2 Impact of Geopolitical Conflicts on Global Infusion Pump Market

7. Five Forces Analysis

7.1 Five forces summary

Five forces analysis - Comparison between 2025 and 2030

7.2 Bargaining power of buyers

Bargaining power of buyers - Impact of key factors 2025 and 2030

7.3 Bargaining power of suppliers

Bargaining power of suppliers - Impact of key factors in 2025 and 2030

7.4 Threat of new entrants

Threat of new entrants - Impact of key factors in 2025 and 2030

7.5 Threat of substitutes

Threat of substitutes - Impact of key factors in 2025 and 2030

7.6 Threat of rivalry

Threat of rivalry - Impact of key factors in 2025 and 2030

7.7 Market condition

Chart on Market condition - Five forces 2025 and 2030

8. Market Segmentation by Type

8.1 Market segments

Chart on Type - Market share 2025-2030 (%)
Data Table on Type - Market share 2025-2030 (%)

8.2 Comparison by Type

Chart on Comparison by Type
Data Table on Comparison by Type

8.3 Insulin pumps - Market size and forecast 2025-2030

Chart on Insulin pumps - Market size and forecast 2025-2030 ($ million)
Data Table on Insulin pumps - Market size and forecast 2025-2030 ($ million)
Chart on Insulin pumps - Year-over-year growth 2025-2030 (%)
Data Table on Insulin pumps - Year-over-year growth 2025-2030 (%)

8.4 Volumetric pumps - Market size and forecast 2025-2030

Chart on Volumetric pumps - Market size and forecast 2025-2030 ($ million)
Data Table on Volumetric pumps - Market size and forecast 2025-2030 ($ million)
Chart on Volumetric pumps - Year-over-year growth 2025-2030 (%)
Data Table on Volumetric pumps - Year-over-year growth 2025-2030 (%)

8.5 Elastomeric pumps - Market size and forecast 2025-2030

Chart on Elastomeric pumps - Market size and forecast 2025-2030 ($ million)
Data Table on Elastomeric pumps - Market size and forecast 2025-2030 ($ million)
Chart on Elastomeric pumps - Year-over-year growth 2025-2030 (%)
Data Table on Elastomeric pumps - Year-over-year growth 2025-2030 (%)

8.6 Enteral pumps - Market size and forecast 2025-2030

Chart on Enteral pumps - Market size and forecast 2025-2030 ($ million)
Data Table on Enteral pumps - Market size and forecast 2025-2030 ($ million)
Chart on Enteral pumps - Year-over-year growth 2025-2030 (%)
Data Table on Enteral pumps - Year-over-year growth 2025-2030 (%)

8.7 Others - Market size and forecast 2025-2030

Chart on Others - Market size and forecast 2025-2030 ($ million)
Data Table on Others - Market size and forecast 2025-2030 ($ million)
Chart on Others - Year-over-year growth 2025-2030 (%)
Data Table on Others - Year-over-year growth 2025-2030 (%)

8.8 Market opportunity by Type

Market opportunity by Type ($ million)
Data Table on Market opportunity by Type ($ million)

9. Market Segmentation by End-user

9.1 Market segments

Chart on End-user - Market share 2025-2030 (%)
Data Table on End-user - Market share 2025-2030 (%)

9.2 Comparison by End-user

Chart on Comparison by End-user
Data Table on Comparison by End-user

9.3 Hospitals - Market size and forecast 2025-2030

Chart on Hospitals - Market size and forecast 2025-2030 ($ million)
Data Table on Hospitals - Market size and forecast 2025-2030 ($ million)
Chart on Hospitals - Year-over-year growth 2025-2030 (%)
Data Table on Hospitals - Year-over-year growth 2025-2030 (%)

9.4 Ambulatory service centers - Market size and forecast 2025-2030

Chart on Ambulatory service centers - Market size and forecast 2025-2030 ($ million)
Data Table on Ambulatory service centers - Market size and forecast 2025-2030 ($ million)
Chart on Ambulatory service centers - Year-over-year growth 2025-2030 (%)
Data Table on Ambulatory service centers - Year-over-year growth 2025-2030 (%)

9.5 Clinics - Market size and forecast 2025-2030

Chart on Clinics - Market size and forecast 2025-2030 ($ million)
Data Table on Clinics - Market size and forecast 2025-2030 ($ million)
Chart on Clinics - Year-over-year growth 2025-2030 (%)
Data Table on Clinics - Year-over-year growth 2025-2030 (%)

9.6 Others - Market size and forecast 2025-2030

Chart on Others - Market size and forecast 2025-2030 ($ million)
Data Table on Others - Market size and forecast 2025-2030 ($ million)
Chart on Others - Year-over-year growth 2025-2030 (%)
Data Table on Others - Year-over-year growth 2025-2030 (%)

9.7 Market opportunity by End-user

Market opportunity by End-user ($ million)
Data Table on Market opportunity by End-user ($ million)

10. Market Segmentation by Application

10.1 Market segments

Chart on Application - Market share 2025-2030 (%)
Data Table on Application - Market share 2025-2030 (%)

10.2 Comparison by Application

Chart on Comparison by Application
Data Table on Comparison by Application

10.3 Diabetes - Market size and forecast 2025-2030

Chart on Diabetes - Market size and forecast 2025-2030 ($ million)
Data Table on Diabetes - Market size and forecast 2025-2030 ($ million)
Chart on Diabetes - Year-over-year growth 2025-2030 (%)
Data Table on Diabetes - Year-over-year growth 2025-2030 (%)

10.4 Oncology - Market size and forecast 2025-2030

Chart on Oncology - Market size and forecast 2025-2030 ($ million)
Data Table on Oncology - Market size and forecast 2025-2030 ($ million)
Chart on Oncology - Year-over-year growth 2025-2030 (%)
Data Table on Oncology - Year-over-year growth 2025-2030 (%)

10.5 Chemotherapy - Market size and forecast 2025-2030

Chart on Chemotherapy - Market size and forecast 2025-2030 ($ million)
Data Table on Chemotherapy - Market size and forecast 2025-2030 ($ million)
Chart on Chemotherapy - Year-over-year growth 2025-2030 (%)
Data Table on Chemotherapy - Year-over-year growth 2025-2030 (%)

10.6 Pain management - Market size and forecast 2025-2030

Chart on Pain management - Market size and forecast 2025-2030 ($ million)
Data Table on Pain management - Market size and forecast 2025-2030 ($ million)
Chart on Pain management - Year-over-year growth 2025-2030 (%)
Data Table on Pain management - Year-over-year growth 2025-2030 (%)

10.7 Others - Market size and forecast 2025-2030

Chart on Others - Market size and forecast 2025-2030 ($ million)
Data Table on Others - Market size and forecast 2025-2030 ($ million)
Chart on Others - Year-over-year growth 2025-2030 (%)
Data Table on Others - Year-over-year growth 2025-2030 (%)

10.8 Market opportunity by Application

Market opportunity by Application ($ million)
Data Table on Market opportunity by Application ($ million)

11. Customer Landscape

11.1 Customer landscape overview

Analysis of price sensitivity, lifecycle, customer purchase basket, adoption rates, and purchase criteria

12. Geographic Landscape

12.1 Geographic segmentation

Chart on Market share by geography 2025-2030 (%)
Data Table on Market share by geography 2025-2030 (%)

12.2 Geographic comparison

Chart on Geographic comparison
Data Table on Geographic comparison

12.3 North America - Market size and forecast 2025-2030

Chart on North America - Market size and forecast 2025-2030 ($ million)
Data Table on North America - Market size and forecast 2025-2030 ($ million)
Chart on North America - Year-over-year growth 2025-2030 (%)
Data Table on North America - Year-over-year growth 2025-2030 (%)
Chart on Regional Comparison - North America
Data Table on Regional Comparison - North America

12.3.1 US - Market size and forecast 2025-2030

Chart on US - Market size and forecast 2025-2030 ($ million)
Data Table on US - Market size and forecast 2025-2030 ($ million)
Chart on US - Year-over-year growth 2025-2030 (%)
Data Table on US - Year-over-year growth 2025-2030 (%)

12.3.2 Canada - Market size and forecast 2025-2030

Chart on Canada - Market size and forecast 2025-2030 ($ million)
Data Table on Canada - Market size and forecast 2025-2030 ($ million)
Chart on Canada - Year-over-year growth 2025-2030 (%)
Data Table on Canada - Year-over-year growth 2025-2030 (%)

12.3.3 Mexico - Market size and forecast 2025-2030

Chart on Mexico - Market size and forecast 2025-2030 ($ million)
Data Table on Mexico - Market size and forecast 2025-2030 ($ million)
Chart on Mexico - Year-over-year growth 2025-2030 (%)
Data Table on Mexico - Year-over-year growth 2025-2030 (%)

12.4 Europe - Market size and forecast 2025-2030

Chart on Europe - Market size and forecast 2025-2030 ($ million)
Data Table on Europe - Market size and forecast 2025-2030 ($ million)
Chart on Europe - Year-over-year growth 2025-2030 (%)
Data Table on Europe - Year-over-year growth 2025-2030 (%)
Chart on Regional Comparison - Europe
Data Table on Regional Comparison - Europe

12.4.1 Germany - Market size and forecast 2025-2030

Chart on Germany - Market size and forecast 2025-2030 ($ million)
Data Table on Germany - Market size and forecast 2025-2030 ($ million)
Chart on Germany - Year-over-year growth 2025-2030 (%)
Data Table on Germany - Year-over-year growth 2025-2030 (%)

12.4.2 UK - Market size and forecast 2025-2030

Chart on UK - Market size and forecast 2025-2030 ($ million)
Data Table on UK - Market size and forecast 2025-2030 ($ million)
Chart on UK - Year-over-year growth 2025-2030 (%)
Data Table on UK - Year-over-year growth 2025-2030 (%)

12.4.3 France - Market size and forecast 2025-2030

Chart on France - Market size and forecast 2025-2030 ($ million)
Data Table on France - Market size and forecast 2025-2030 ($ million)
Chart on France - Year-over-year growth 2025-2030 (%)
Data Table on France - Year-over-year growth 2025-2030 (%)

12.4.4 Italy - Market size and forecast 2025-2030

Chart on Italy - Market size and forecast 2025-2030 ($ million)
Data Table on Italy - Market size and forecast 2025-2030 ($ million)
Chart on Italy - Year-over-year growth 2025-2030 (%)
Data Table on Italy - Year-over-year growth 2025-2030 (%)

12.4.5 Spain - Market size and forecast 2025-2030

Chart on Spain - Market size and forecast 2025-2030 ($ million)
Data Table on Spain - Market size and forecast 2025-2030 ($ million)
Chart on Spain - Year-over-year growth 2025-2030 (%)
Data Table on Spain - Year-over-year growth 2025-2030 (%)

12.4.6 The Netherlands - Market size and forecast 2025-2030

Chart on The Netherlands - Market size and forecast 2025-2030 ($ million)
Data Table on The Netherlands - Market size and forecast 2025-2030 ($ million)
Chart on The Netherlands - Year-over-year growth 2025-2030 (%)
Data Table on The Netherlands - Year-over-year growth 2025-2030 (%)

12.5 Asia - Market size and forecast 2025-2030

Chart on Asia - Market size and forecast 2025-2030 ($ million)
Data Table on Asia - Market size and forecast 2025-2030 ($ million)
Chart on Asia - Year-over-year growth 2025-2030 (%)
Data Table on Asia - Year-over-year growth 2025-2030 (%)
Chart on Regional Comparison - Asia
Data Table on Regional Comparison - Asia

12.5.1 China - Market size and forecast 2025-2030

Chart on China - Market size and forecast 2025-2030 ($ million)
Data Table on China - Market size and forecast 2025-2030 ($ million)
Chart on China - Year-over-year growth 2025-2030 (%)
Data Table on China - Year-over-year growth 2025-2030 (%)

12.5.2 India - Market size and forecast 2025-2030

Chart on India - Market size and forecast 2025-2030 ($ million)
Data Table on India - Market size and forecast 2025-2030 ($ million)
Chart on India - Year-over-year growth 2025-2030 (%)
Data Table on India - Year-over-year growth 2025-2030 (%)

12.5.3 Japan - Market size and forecast 2025-2030

Chart on Japan - Market size and forecast 2025-2030 ($ million)
Data Table on Japan - Market size and forecast 2025-2030 ($ million)
Chart on Japan - Year-over-year growth 2025-2030 (%)
Data Table on Japan - Year-over-year growth 2025-2030 (%)

12.5.4 South Korea - Market size and forecast 2025-2030

Chart on South Korea - Market size and forecast 2025-2030 ($ million)
Data Table on South Korea - Market size and forecast 2025-2030 ($ million)
Chart on South Korea - Year-over-year growth 2025-2030 (%)
Data Table on South Korea - Year-over-year growth 2025-2030 (%)

12.5.5 Indonesia - Market size and forecast 2025-2030

Chart on Indonesia - Market size and forecast 2025-2030 ($ million)
Data Table on Indonesia - Market size and forecast 2025-2030 ($ million)
Chart on Indonesia - Year-over-year growth 2025-2030 (%)
Data Table on Indonesia - Year-over-year growth 2025-2030 (%)

12.5.6 Thailand - Market size and forecast 2025-2030

Chart on Thailand - Market size and forecast 2025-2030 ($ million)
Data Table on Thailand - Market size and forecast 2025-2030 ($ million)
Chart on Thailand - Year-over-year growth 2025-2030 (%)
Data Table on Thailand - Year-over-year growth 2025-2030 (%)

12.6 Rest of World (ROW) - Market size and forecast 2025-2030

Chart on Rest of World (ROW) - Market size and forecast 2025-2030 ($ million)
Data Table on Rest of World (ROW) - Market size and forecast 2025-2030 ($ million)
Chart on Rest of World (ROW) - Year-over-year growth 2025-2030 (%)
Data Table on Rest of World (ROW) - Year-over-year growth 2025-2030 (%)
Chart on Regional Comparison - Rest of World (ROW)
Data Table on Regional Comparison - Rest of World (ROW)

12.6.1 Brazil - Market size and forecast 2025-2030

Chart on Brazil - Market size and forecast 2025-2030 ($ million)
Data Table on Brazil - Market size and forecast 2025-2030 ($ million)
Chart on Brazil - Year-over-year growth 2025-2030 (%)
Data Table on Brazil - Year-over-year growth 2025-2030 (%)

12.6.2 Saudi Arabia - Market size and forecast 2025-2030

Chart on Saudi Arabia - Market size and forecast 2025-2030 ($ million)
Data Table on Saudi Arabia - Market size and forecast 2025-2030 ($ million)
Chart on Saudi Arabia - Year-over-year growth 2025-2030 (%)
Data Table on Saudi Arabia - Year-over-year growth 2025-2030 (%)

12.6.3 UAE - Market size and forecast 2025-2030

Chart on UAE - Market size and forecast 2025-2030 ($ million)
Data Table on UAE - Market size and forecast 2025-2030 ($ million)
Chart on UAE - Year-over-year growth 2025-2030 (%)
Data Table on UAE - Year-over-year growth 2025-2030 (%)

12.6.4 Turkey - Market size and forecast 2025-2030

Chart on Turkey - Market size and forecast 2025-2030 ($ million)
Data Table on Turkey - Market size and forecast 2025-2030 ($ million)
Chart on Turkey - Year-over-year growth 2025-2030 (%)
Data Table on Turkey - Year-over-year growth 2025-2030 (%)

12.6.5 Argentina - Market size and forecast 2025-2030

Chart on Argentina - Market size and forecast 2025-2030 ($ million)
Data Table on Argentina - Market size and forecast 2025-2030 ($ million)
Chart on Argentina - Year-over-year growth 2025-2030 (%)
Data Table on Argentina - Year-over-year growth 2025-2030 (%)

12.6.6 Colombia - Market size and forecast 2025-2030

Chart on Colombia - Market size and forecast 2025-2030 ($ million)
Data Table on Colombia - Market size and forecast 2025-2030 ($ million)
Chart on Colombia - Year-over-year growth 2025-2030 (%)
Data Table on Colombia - Year-over-year growth 2025-2030 (%)

12.6.7 South Africa - Market size and forecast 2025-2030

Chart on South Africa - Market size and forecast 2025-2030 ($ million)
Data Table on South Africa - Market size and forecast 2025-2030 ($ million)
Chart on South Africa - Year-over-year growth 2025-2030 (%)
Data Table on South Africa - Year-over-year growth 2025-2030 (%)

12.6.8 Israel - Market size and forecast 2025-2030

Chart on Israel - Market size and forecast 2025-2030 ($ million)
Data Table on Israel - Market size and forecast 2025-2030 ($ million)
Chart on Israel - Year-over-year growth 2025-2030 (%)
Data Table on Israel - Year-over-year growth 2025-2030 (%)

12.7 Market opportunity by geography

Market opportunity by geography ($ million)
Data Tables on Market opportunity by geography ($ million)

13. Drivers, Challenges, and Opportunity

13.1 Market drivers

Rising prevalence of chronic diseases and expanding geriatric population
Technological advancements and emergence of smart infusion systems
Growing demand for home healthcare and ambulatory infusion services

13.2 Market challenges

Heightened scrutiny amidst product recalls and patient safety imperatives
Deficiencies in interoperability and seamless data integration
Intensifying market competition and sustained pricing pressures

13.3 Impact of drivers and challenges

Impact of drivers and challenges in 2025 and 2030

13.4 Market opportunities

Integration of smart technology and enhanced connectivity
Expansion into home care and alternative treatment settings
Integration of remote patient monitoring

14. Competitive Landscape

14.1 Overview

14.2

Overview on criticality of inputs and factors of differentiation

14.3 Landscape disruption

Overview on factors of disruption

14.4 Industry risks

Impact of key risks on business

15. Competitive Analysis

15.1 Companies profiled

Companies covered

15.2 Company ranking index

15.3 Market positioning of companies

Matrix on companies position and classification

15.4 Arcomed AG

Arcomed AG - Overview
Arcomed AG - Product / Service
Arcomed AG - Key offerings
SWOT

15.5 Avanos Medical Inc.

Avanos Medical Inc. - Overview
Avanos Medical Inc. - Business segments
Avanos Medical Inc. - Key offerings
Avanos Medical Inc. - Segment focus
SWOT

15.6 B.Braun SE

B.Braun SE - Overview
B.Braun SE - Product / Service
B.Braun SE - Key offerings
SWOT

15.7 Baxter International Inc.

Baxter International Inc. - Overview
Baxter International Inc. - Business segments
Baxter International Inc. - Key news
Baxter International Inc. - Key offerings
Baxter International Inc. - Segment focus
SWOT

15.8 Becton Dickinson and Co.

Becton Dickinson and Co. - Overview
Becton Dickinson and Co. - Business segments
Becton Dickinson and Co. - Key news
Becton Dickinson and Co. - Key offerings
Becton Dickinson and Co. - Segment focus
SWOT

15.9 Cardinal Health Inc.

Cardinal Health Inc. - Overview
Cardinal Health Inc. - Business segments
Cardinal Health Inc. - Key news
Cardinal Health Inc. - Key offerings
Cardinal Health Inc. - Segment focus
SWOT

15.10 F. Hoffmann La Roche Ltd.

F. Hoffmann La Roche Ltd. - Overview
F. Hoffmann La Roche Ltd. - Business segments
F. Hoffmann La Roche Ltd. - Key news
F. Hoffmann La Roche Ltd. - Key offerings
F. Hoffmann La Roche Ltd. - Segment focus
SWOT

15.11 Fresenius Kabi AG

Fresenius Kabi AG - Overview
Fresenius Kabi AG - Product / Service
Fresenius Kabi AG - Key offerings
SWOT

15.12 Medtronic Plc

Medtronic Plc - Overview
Medtronic Plc - Business segments
Medtronic Plc - Key news
Medtronic Plc - Key offerings
Medtronic Plc - Segment focus
SWOT

15.13 Moog Inc.

Moog Inc. - Overview
Moog Inc. - Business segments
Moog Inc. - Key offerings
Moog Inc. - Segment focus
SWOT

15.14 Nipro Corp.

Nipro Corp. - Overview
Nipro Corp. - Business segments
Nipro Corp. - Key offerings
Nipro Corp. - Segment focus
SWOT

15.15 Shenzhen Mindray Co. Ltd.

Shenzhen Mindray Co. Ltd. - Overview
Shenzhen Mindray Co. Ltd. - Business segments
Shenzhen Mindray Co. Ltd. - Key offerings
Shenzhen Mindray Co. Ltd. - Segment focus
SWOT

15.16 SOOIL Development Co. Ltd.

SOOIL Development Co. Ltd. - Overview
SOOIL Development Co. Ltd. - Product / Service
SOOIL Development Co. Ltd. - Key offerings
SWOT

15.17 Ypsomed Holding AG

Ypsomed Holding AG - Overview
Ypsomed Holding AG - Business segments
Ypsomed Holding AG - Key offerings
Ypsomed Holding AG - Segment focus
SWOT

15.18 Zyno Solutions

Zyno Solutions - Overview
Zyno Solutions - Product / Service
Zyno Solutions - Key offerings
SWOT

16. Appendix

16.1 Scope of the report

Market definition
Objectives
Notes and caveats

16.2 Inclusions and exclusions checklist

Inclusions checklist
Exclusions checklist

16.3 Currency conversion rates for US$

16.4 Research methodology

16.5 Data procurement

Information sources

16.6 Data validation

16.7 Validation techniques employed for market sizing

16.8 Data synthesis

16.9 360 degree market analysis

16.10 List of abbreviations

Research Methodology

Technavio presents a detailed picture of the market by way of study, synthesis, and summation of data from multiple sources. The analysts have presented the various facets of the market with a particular focus on identifying the key industry influencers. The data thus presented is comprehensive, reliable, and the result of extensive research, both primary and secondary.

INFORMATION SOURCES

Primary sources

  • Manufacturers and suppliers
  • Channel partners
  • Industry experts
  • Strategic decision makers

Secondary sources

  • Industry journals and periodicals
  • Government data
  • Financial reports of key industry players
  • Historical data
  • Press releases

DATA ANALYSIS

Data Synthesis

  • Collation of data
  • Estimation of key figures
  • Analysis of derived insights

Data Validation

  • Triangulation with data models
  • Reference against proprietary databases
  • Corroboration with industry experts

REPORT WRITING

Qualitative

  • Market drivers
  • Market challenges
  • Market trends
  • Five forces analysis

Quantitative

  • Market size and forecast
  • Market segmentation
  • Geographical insights
  • Competitive landscape

Interested in this report?

Get your sample now to see our research methodology and insights!

Download Now

Frequently Asked Questions

Infusion Pump market growth will increase by USD 6020.4 million during 2026-2030.

The Infusion Pump market is expected to grow at a CAGR of 7.2% during 2026-2030.

Infusion Pump market is segmented by Type (Insulin pumps, Volumetric pumps, Elastomeric pumps, Enteral pumps, Others) End-user (Hospitals, Ambulatory service centers, Clinics, Others) Application (Diabetes, Oncology, Chemotherapy, Pain management, Others)

Arcomed AG, Avanos Medical Inc., B.Braun SE, Baxter International Inc., Becton Dickinson and Co., Cardinal Health Inc., F. Hoffmann La Roche Ltd., Flowonix Medical Inc., Fresenius Kabi AG, ICU Medical Inc., Insulet Corp., IRadimed Corp., Medtronic Plc, Micrel Medical Devices SA, Moog Inc., Nipro Corp., Shenzhen Mindray Co. Ltd., SOOIL Development Co. Ltd., Ypsomed Holding AG, Zyno Solutions are a few of the key vendors in the Infusion Pump market.

North America will register the highest growth rate of 46% among the other regions. Therefore, the Infusion Pump market in North America is expected to garner significant business opportunities for the vendors during the forecast period.

US, Canada, Mexico, Germany, UK, France, Italy, Spain, The Netherlands, China, India, Japan, South Korea, Indonesia, Thailand, Brazil, Saudi Arabia, UAE, Turkey, Argentina, Colombia, South Africa, Israel

  • Rising prevalence of chronic diseases and expanding geriatric population is the driving factor this market.

The Infusion Pump market vendors should focus on grabbing business opportunities from the Type segment as it accounted for the largest market share in the base year.
RIA - Research AI Assistant
Ask RIA
