Jewelry Market Analysis, Size, and Forecast 2026-2030: APAC (China, Japan, and India), North America (US, Canada, and Mexico), Europe (Germany, UK, and France), Middle East and Africa (Saudi Arabia, UAE, and South Africa), South America (Brazil and Argentina), and Rest of World (ROW)

Jewelry Market Analysis, Size, and Forecast 2026-2030:
APAC (China, Japan, and India), North America (US, Canada, and Mexico), Europe (Germany, UK, and France), Middle East and Africa (Saudi Arabia, UAE, and South Africa), South America (Brazil and Argentina), and Rest of World (ROW)

Published: Dec 2025 286 Pages SKU: IRTNTR80138

Market Overview at a Glance

$121.4 B
Market Opportunity
5.5%
CAGR 2025 - 2030
58.5%
APAC Growth
$329 B
Specialist retailers segment 2024

Jewelry Market Size 2026-2030

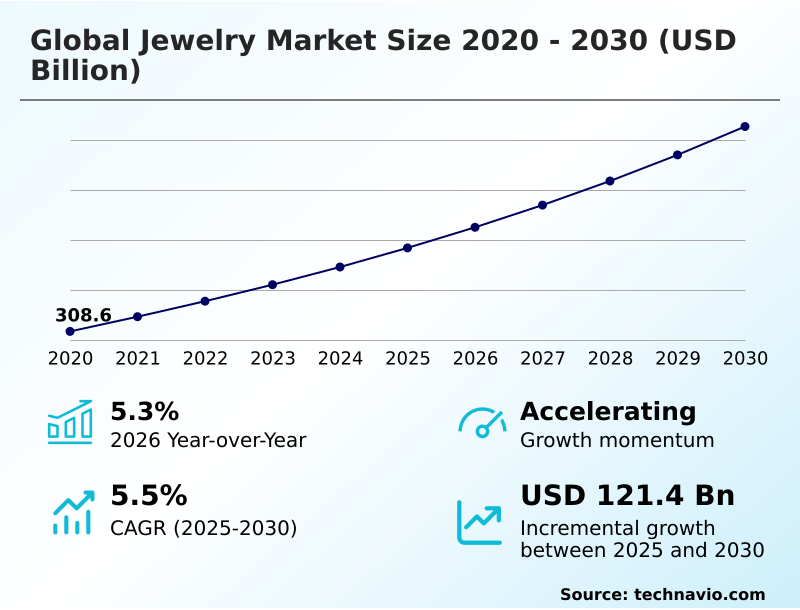
The jewelry market size is valued to increase by USD 121.4 billion, at a CAGR of 5.5% from 2025 to 2030. Increasing demand for jewelry as gifts will drive the jewelry market.

Major Market Trends & Insights

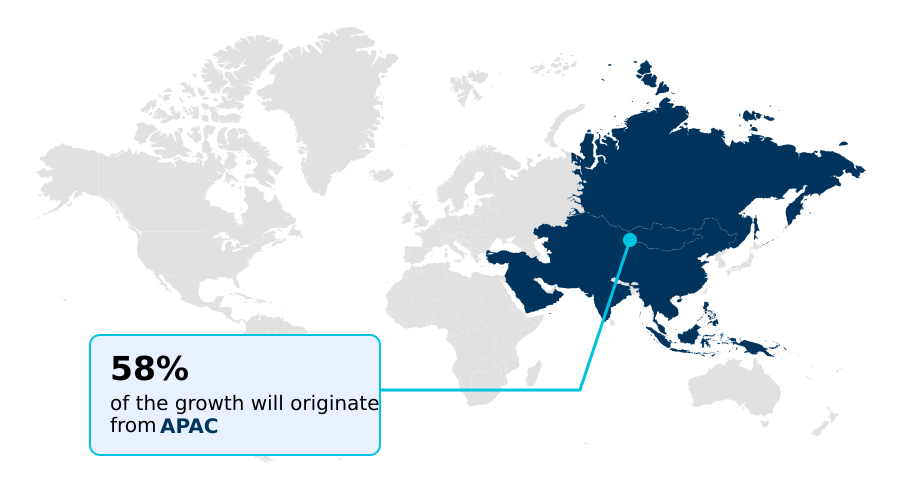
  • APAC dominated the market and accounted for a 58.5% growth during the forecast period.
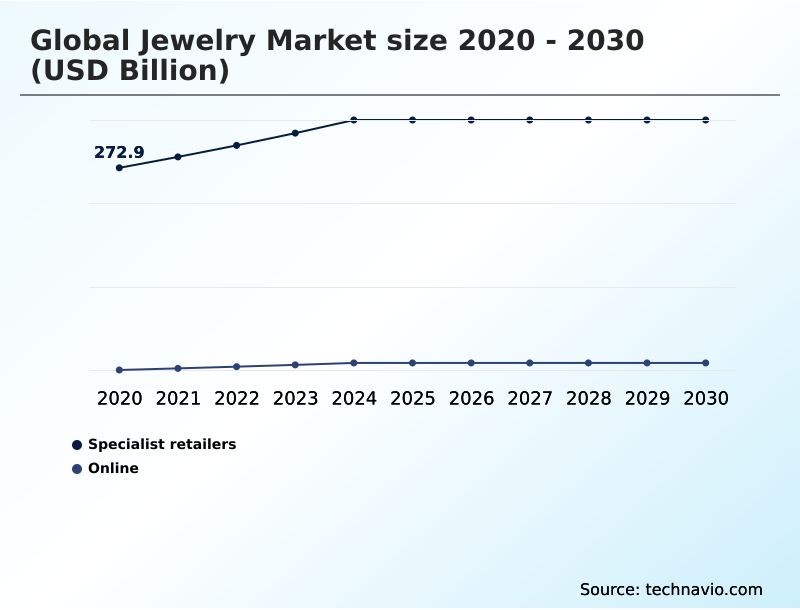
  • By Distribution Channel - Specialist retailers segment was valued at USD 329 billion in 2024
  • By Type - Gold segment accounted for the largest market revenue share in 2024

Market Size & Forecast

  • Market Opportunities: USD 204.9 billion
  • Market Future Opportunities: USD 121.4 billion
  • CAGR from 2025 to 2030 : 5.5%

Market Summary

  • The jewelry market is undergoing a significant transformation, evolving from its traditional role as a repository of wealth to a dynamic expression of personal style and ethical values. This shift is propelled by technological advancements in custom jewelry manufacturing, where computer-aided design (CAD) and 3D printing enable the creation of intricate, bespoke jewelry that caters to individual tastes.
  • Concurrently, consumer consciousness is reshaping material sourcing, with a growing preference for recycled precious metals and laboratory-grown diamonds over conventionally mined stones, compelling brands to adopt stringent conflict-free sourcing protocols and transparent supply chain transparency.
  • As a business scenario, a mid-sized brand might implement blockchain traceability to provide verifiable provenance tracking for its gemstones, thereby enhancing brand storytelling and building trust.
  • This commitment to transparency and innovation, alongside adherence to hallmark certification and principles of a circular economy, is becoming crucial for competing in a market where demi-fine jewelry and sustainable luxury are gaining significant traction, particularly among younger, digitally-native consumers who prioritize authenticity and responsible consumption.

What will be the Size of the Jewelry Market during the forecast period?

Get Key Insights on Market Forecast (PDF) Request Free Sample

How is the Jewelry Market Segmented?

The jewelry industry research report provides comprehensive data (region-wise segment analysis), with forecasts and estimates in "USD billion" for the period 2026-2030, as well as historical data from 2020-2024 for the following segments.

  • Distribution channel
    • Specialist retailers
    • Online
  • Type
    • Gold
    • Diamond
    • Others
  • End-user
    • Women
    • Men
    • Children
  • Geography
    • APAC
      • China
      • Japan
      • India
    • North America
      • US
      • Canada
      • Mexico
    • Europe
      • Germany
      • UK
      • France
    • Middle East and Africa
      • Saudi Arabia
      • UAE
      • South Africa
    • South America
      • Brazil
      • Argentina
    • Rest of World (ROW)

By Distribution Channel Insights

The specialist retailers segment is estimated to witness significant growth during the forecast period.

The specialist retailers segment functions as a critical channel, defined by its capacity to offer personalized service and tactile product evaluation. This channel's strength lies in delivering high-touch experiential retail environments where artisanal craftsmanship can be closely examined.

In-store consultants provide expert guidance on diamond grading and the specifics of unique pieces like tanzanite jewelry. These retailers are evolving into brand embassies that leverage brand storytelling and VIP clienteling to cultivate loyalty within the luxury retail sphere.

The focus on personalization services, including the creation of bespoke jewelry and custom gemstone setting, enhances customer engagement, with some retailers reporting a 15% increase in repeat business from clients who utilize these custom services.

Request Free Sample

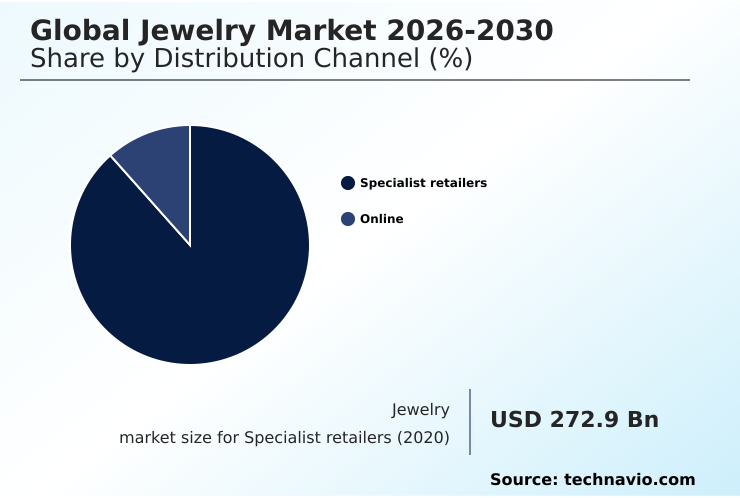
The Specialist retailers segment was valued at USD 329 billion in 2024 and showed a gradual increase during the forecast period.

Request Free Sample

Regional Analysis

APAC is estimated to contribute 58.5% to the growth of the global market during the forecast period.Technavio’s analysts have elaborately explained the regional trends and drivers that shape the market during the forecast period.

See How Jewelry Market Demand is Rising in APAC Request Free Sample

The geographic landscape of the market is characterized by distinct regional dynamics.

APAC's growth, contributing to 58% of the market's incremental expansion, is driven by a deep-rooted goldsmithing tradition and a structural shift toward organized retail, underscored by the rising adoption of hallmark certification.

This region leverages social commerce and influencer marketing to promote heritage collections. In contrast, North America and Europe focus on design innovation and ethical standards.

South America showcases unique offerings like lapis lazuli and mapuche silverware, while Japan's market is refined by principles of sustainable aquaculture for pearls.

The integration of omnichannel retail and efficient e-commerce logistics is a unifying factor, enabling brands to cater to diverse global tastes.

Market Dynamics

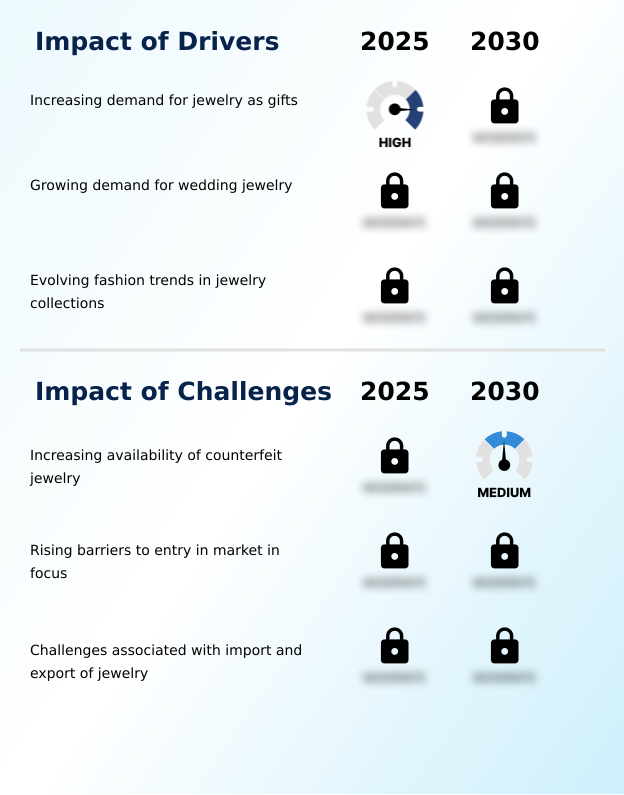
Our researchers analyzed the data with 2025 as the base year, along with the key drivers, trends, and challenges. A holistic analysis of drivers will help companies refine their marketing strategies to gain a competitive advantage.

  • The global jewelry market 2026-2030 is shaped by intersecting forces of innovation, consumer behavior, and ethical considerations. Key technology advancements in jewelry manufacturing are democratizing customization, where the role of CAD CAM in custom jewelry design allows for unprecedented precision and personalization. This directly fuels consumer demand for personalized name necklaces and other bespoke items.
  • Simultaneously, there is a notable growth of demi fine jewelry for men, contributing to the overall men's urban jewelry market growth as the growing acceptance of jewelry among men becomes mainstream. Stylistically, trends in antique inspired jewelry designs coexist with modern aesthetics.
  • However, the industry faces hurdles, including the persistent counterfeit jewelry impact on brand image and complex challenges in import export of jewelry. These issues, coupled with rising barriers to entry in jewelry market, create a competitive landscape where brand trust is paramount.
  • The impact of lab grown diamonds on global jewelry market 2026-2030 continues to be a central theme, influencing marketing strategies for natural diamond jewelry. To succeed, companies are adopting sophisticated omnichannel strategies for luxury jewelry brands and ensuring robust ethical sourcing in high jewelry collections.
  • Firms leveraging such omnichannel strategies report customer lifetime values nearly 30% higher than those relying on single-channel retail.

What are the key market drivers leading to the rise in the adoption of Jewelry Industry?

  • The increasing demand for jewelry as a preferred choice for gifting across various cultural and personal milestones is a key driver propelling market growth.

  • Key market drivers are centered on expanding consumer access and evolving cultural practices. The tradition of gifting jewelry, often defined by specific karat purity standards, is a consistent demand generator.
  • The growth of digital gold investment platforms is also a significant factor, with studies indicating a conversion rate of nearly 20% from digital savers to physical jewelry buyers.
  • Financial tools such as buy now pay later (BNPL) services are making higher-value items more attainable, boosting average order values by up to 25%.
  • Modern manufacturing techniques, including computer-aided design (CAD) and lost wax casting of precious metal alloys, improve production efficiency.
  • Meanwhile, livestreaming commerce and tax-free shopping opportunities in travel hubs further fuel sales, with some brands seeking halal certification to tap into new consumer segments.

What are the market trends shaping the Jewelry Industry?

  • A significant trend shaping the market is the growing acceptance of jewelry among men, which moves beyond traditional accessories. This cultural shift expands the consumer base and drives demand for new product categories.

  • Market trends are increasingly shaped by technological innovation and evolving consumer identities. The rise of gender-fluid fashion and the mini-me trend are expanding product categories beyond traditional demographics, creating new demand for versatile designs. Technologies such as 3D printing and laser engraving facilitate rapid prototyping and custom jewelry manufacturing at scale.
  • Digital engagement is enhanced through augmented reality (AR) and virtual try-on (VTO) tools, which have been shown to increase user session times by over 40%. These trends support the growth of accessible categories like demi-fine jewelry and niche segments such as bio-jewelry, while the market for investment-grade watches continues to mature, showing a 10% faster resale velocity online.

What challenges does the Jewelry Industry face during its growth?

  • The increasing availability of counterfeit products presents a significant challenge to the market, threatening brand integrity and consumer trust.

  • The market confronts significant challenges related to material integrity and operational transparency. Ensuring conflict-free sourcing remains a primary concern, necessitating robust supply chain transparency and provenance tracking systems. The rise of laboratory-grown diamonds has introduced competitive pressure, compelling legacy brands to reinforce the value of natural stones.
  • Consumers are demanding adherence to stringent ethical sourcing standards and the use of recycled precious metals as part of a broader shift toward a circular economy. Technologies like blockchain traceability are being deployed to validate claims, as over 60% of consumers report they would switch brands over authenticity concerns.
  • Additionally, production complexities in techniques like intricate hand engraving and durable rhodium plating add to cost pressures.

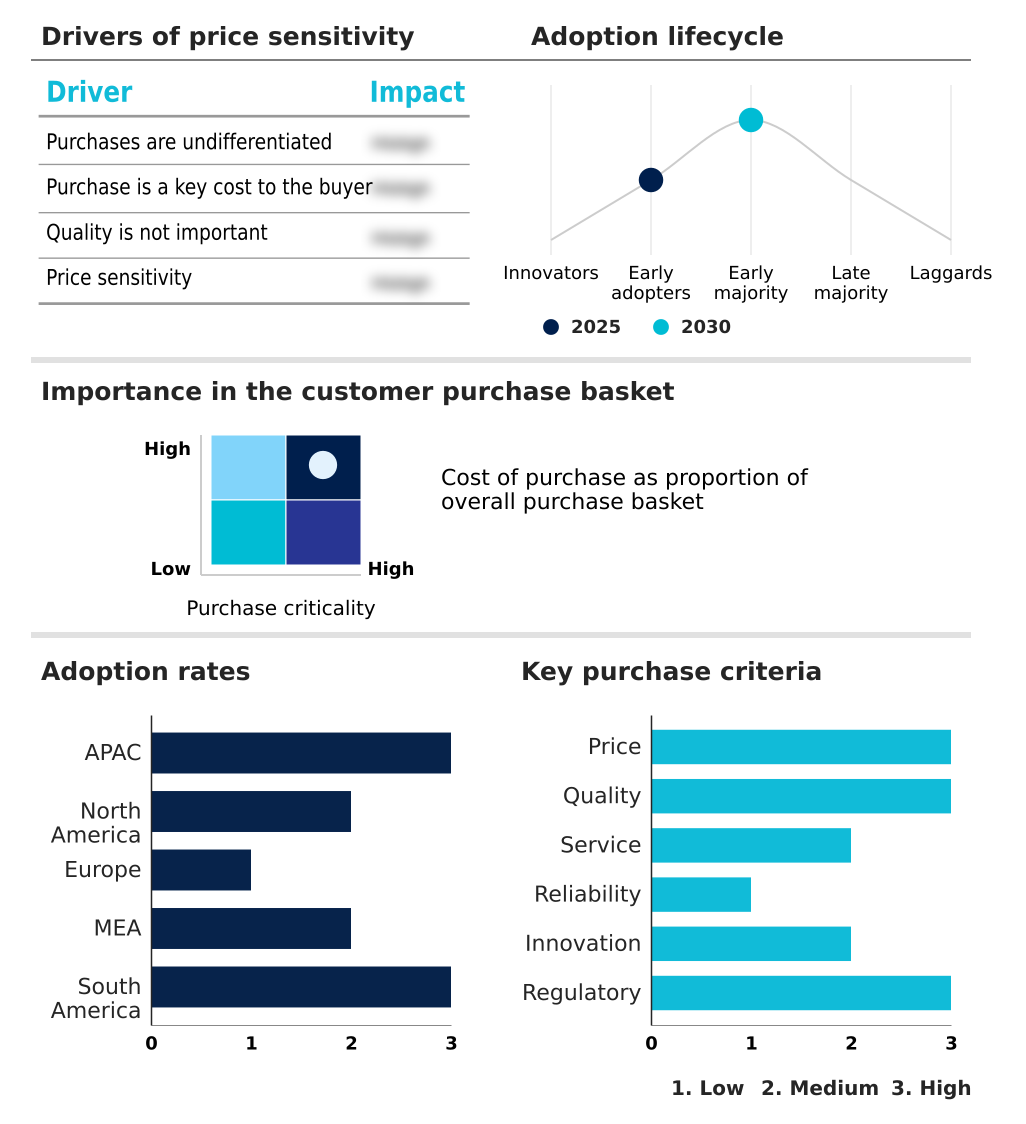
Exclusive Technavio Analysis on Customer Landscape

The jewelry market forecasting report includes the adoption lifecycle of the market, covering from the innovator’s stage to the laggard’s stage. It focuses on adoption rates in different regions based on penetration. Furthermore, the jewelry market report also includes key purchase criteria and drivers of price sensitivity to help companies evaluate and develop their market growth analysis strategies.

Customer Landscape of Jewelry Industry

Competitive Landscape

Companies are implementing various strategies, such as strategic alliances, jewelry market forecast, partnerships, mergers and acquisitions, geographical expansion, and product/service launches, to enhance their presence in the industry.

Asian Star Co. Ltd. - Portfolio spans fine jewelry, high-jewelry collections, and luxury timepieces, strategically targeting diverse consumer segments through multiple prestigious brands.

The industry research and growth report includes detailed analyses of the competitive landscape of the market and information about key companies, including:

  • Asian Star Co. Ltd.
  • AU Enterprises Inc.
  • Boma Jewelry Inc.
  • Cartier SA
  • Casting House Inc.
  • Chic Pistachio LLC
  • DeBebians Inc.
  • Gildform Inc.
  • H. Stern Com. and Ind. SA
  • Kapit Mas Pty Ltd.
  • KGS Jewels Inc.
  • LVMH Moet Hennessy
  • Malabar Gold and Diamonds
  • Mangla International
  • MKM Jewelry Inc.
  • Parad Jewelry LLC
  • Rajesh Exports Ltd.
  • Royi Sal Co. Ltd.
  • Swarovski AG
  • Wayfair Inc.
  • Yiwu Nihao Jewelry Co. Ltd.

Qualitative and quantitative analysis of companies has been conducted to help clients understand the wider business environment as well as the strengths and weaknesses of key industry players. Data is qualitatively analyzed to categorize companies as pure play, category-focused, industry-focused, and diversified; it is quantitatively analyzed to categorize companies as dominant, leading, strong, tentative, and weak.

Recent Development and News in Jewelry market

  • In May, 2025, Pandora A/S announced its entry into key Southeast Asian markets, launching its lab-grown diamond collections in Singapore and Malaysia to capture growing consumer demand for sustainable luxury.
  • In March, 2025, Perfect Corp. unveiled an upgraded virtual try-on platform with hyper-realistic metal and gemstone rendering, which was immediately adopted by three major luxury brands to reduce online return rates.
  • In December, 2024, Titan Company Ltd. acquired a significant minority stake in a US-based sustainable jewelry startup, marking its strategic entry into the North American demi-fine jewelry market.
  • In September, 2024, De Beers Group announced a partnership with a leading technology firm to pilot a new blockchain-based traceability platform, providing consumers with verifiable, end-to-end provenance for its natural diamonds.

Dive into Technavio’s robust research methodology, blending expert interviews, extensive data synthesis, and validated models for unparalleled Jewelry Market insights. See full methodology.

Market Scope
Page number 286
Base year 2025
Historic period 2020-2024
Forecast period 2026-2030
Growth momentum & CAGR Accelerate at a CAGR of 5.5%
Market growth 2026-2030 USD 121.4 billion
Market structure Fragmented
YoY growth 2025-2026(%) 5.3%
Key countries China, Japan, India, South Korea, Australia, Indonesia, US, Canada, Mexico, Germany, UK, France, Italy, Spain, The Netherlands, Saudi Arabia, UAE, South Africa, Israel, Turkey, Brazil, Argentina and Chile
Competitive landscape Leading Companies, Market Positioning of Companies, Competitive Strategies, and Industry Risks

Request Free Sample

Research Analyst Overview

  • The jewelry market's operational landscape is increasingly sophisticated, built upon a foundation of advanced manufacturing and material science. Core production relies on techniques such as lost wax casting and computer-aided design (CAD), which allow for the precise fabrication of precious metal alloys with specific karat purity.
  • Boardroom decisions now pivot on material strategy, weighing the market appeal of laboratory-grown diamonds against natural stones certified through conflict-free sourcing and rigorous diamond grading. The integration of recycled precious metals is no longer a niche consideration but a key differentiator, with companies adopting this practice reporting a 10% improvement in brand perception scores among key demographics.
  • Final product value is enhanced through artisanal craftsmanship, including detailed hand engraving and finishing touches like rhodium plating. The demand for unique offerings, from tanzanite jewelry to bespoke jewelry, compels continuous innovation, while the market for investment-grade watches and the heritage of goldsmithing tradition provide stable, high-value segments.

What are the Key Data Covered in this Jewelry Market Research and Growth Report?

  • What is the expected growth of the Jewelry Market between 2026 and 2030?

    • USD 121.4 billion, at a CAGR of 5.5%

  • What segmentation does the market report cover?

    • The report is segmented by Distribution Channel (Specialist retailers, and Online), Type (Gold, Diamond, and Others), End-user (Women, Men, and Children) and Geography (APAC, North America, Europe, Middle East and Africa, South America)

  • Which regions are analyzed in the report?

    • APAC, North America, Europe, Middle East and Africa and South America

  • What are the key growth drivers and market challenges?

    • Increasing demand for jewelry as gifts, Increasing availability of counterfeit jewelry

  • Who are the major players in the Jewelry Market?

    • Asian Star Co. Ltd., AU Enterprises Inc., Boma Jewelry Inc., Cartier SA, Casting House Inc., Chic Pistachio LLC, DeBebians Inc., Gildform Inc., H. Stern Com. and Ind. SA, Kapit Mas Pty Ltd., KGS Jewels Inc., LVMH Moet Hennessy, Malabar Gold and Diamonds, Mangla International, MKM Jewelry Inc., Parad Jewelry LLC, Rajesh Exports Ltd., Royi Sal Co. Ltd., Swarovski AG, Wayfair Inc. and Yiwu Nihao Jewelry Co. Ltd.

Market Research Insights

  • The market is defined by a dynamic interplay of digital innovation and evolving consumer expectations. The integration of omnichannel retail models has become standard, with brands leveraging social commerce and influencer marketing to drive engagement. Platforms adopting augmented reality (AR) and virtual try-on (VTO) features report up to a 40% increase in user session times compared to static image galleries.
  • Furthermore, the strategic use of brand storytelling and VIP clienteling in luxury retail helps cultivate loyalty, with personalized outreach programs showing a 15% higher conversion rate than mass marketing campaigns. The logistical backbone of e-commerce logistics has also matured, supporting seamless global distribution for both established houses and direct-to-consumer startups specializing in custom jewelry manufacturing.

We can help! Our analysts can customize this jewelry market research report to meet your requirements.

Get in touch

1. Executive Summary

1.1 Market overview

Executive Summary - Chart on Market Overview
Executive Summary - Data Table on Market Overview
Executive Summary - Chart on Global Market Characteristics
Executive Summary - Chart on Market by Geography
Executive Summary - Chart on Market Segmentation by Distribution Channel
Executive Summary - Chart on Market Segmentation by Type
Executive Summary - Chart on Market Segmentation by End-user
Executive Summary - Chart on Incremental Growth
Executive Summary - Data Table on Incremental Growth
Executive Summary - Chart on Company Market Positioning

2. Technavio Analysis

2.1 Analysis of price sensitivity, lifecycle, customer purchase basket, adoption rates, and purchase criteria

2.2 Criticality of inputs and Factors of differentiation

Chart on Overview on criticality of inputs and factors of differentiation

2.3 Factors of disruption

Chart on Overview on factors of disruption

2.4 Impact of drivers and challenges

Chart on Impact of drivers and challenges in 2025 and 2030

3. Market Landscape

3.1 Market ecosystem

Chart on Parent Market
Data Table on - Parent Market

3.2 Market characteristics

Chart on Market characteristics analysis

3.3 Value chain analysis

Chart on Value chain analysis

4. Market Sizing

4.1 Market definition

Data Table on Offerings of companies included in the market definition

4.2 Market segment analysis

Market segments

4.3 Market size 2025

4.4 Market outlook: Forecast for 2025-2030

Chart on Global - Market size and forecast 2025-2030 ($ billion)
Data Table on Global - Market size and forecast 2025-2030 ($ billion)
Chart on Global Market: Year-over-year growth 2025-2030 (%)
Data Table on Global Market: Year-over-year growth 2025-2030 (%)

5. Historic Market Size

5.1 Global Jewelry Market 2020 - 2024

Historic Market Size - Data Table on Global Jewelry Market 2020 - 2024 ($ billion)

5.2 Distribution Channel segment analysis 2020 - 2024

Historic Market Size - Distribution Channel Segment 2020 - 2024 ($ billion)

5.3 Type segment analysis 2020 - 2024

Historic Market Size - Type Segment 2020 - 2024 ($ billion)

5.4 End-user segment analysis 2020 - 2024

Historic Market Size - End-user Segment 2020 - 2024 ($ billion)

5.5 Geography segment analysis 2020 - 2024

Historic Market Size - Geography Segment 2020 - 2024 ($ billion)

5.6 Country segment analysis 2020 - 2024

Historic Market Size - Country Segment 2020 - 2024 ($ billion)

6. Qualitative Analysis

6.1 Impact of AI on global jewelry market

7. Five Forces Analysis

7.1 Five forces summary

Five forces analysis - Comparison between 2025 and 2030

7.2 Bargaining power of buyers

Bargaining power of buyers - Impact of key factors 2025 and 2030

7.3 Bargaining power of suppliers

Bargaining power of suppliers - Impact of key factors in 2025 and 2030

7.4 Threat of new entrants

Threat of new entrants - Impact of key factors in 2025 and 2030

7.5 Threat of substitutes

Threat of substitutes - Impact of key factors in 2025 and 2030

7.6 Threat of rivalry

Threat of rivalry - Impact of key factors in 2025 and 2030

7.7 Market condition

Chart on Market condition - Five forces 2025 and 2030

8. Market Segmentation by Distribution Channel

8.1 Market segments

Chart on Distribution Channel - Market share 2025-2030 (%)
Data Table on Distribution Channel - Market share 2025-2030 (%)

8.2 Comparison by Distribution Channel

Chart on Comparison by Distribution Channel
Data Table on Comparison by Distribution Channel

8.3 Specialist retailers - Market size and forecast 2025-2030

Chart on Specialist retailers - Market size and forecast 2025-2030 ($ billion)
Data Table on Specialist retailers - Market size and forecast 2025-2030 ($ billion)
Chart on Specialist retailers - Year-over-year growth 2025-2030 (%)
Data Table on Specialist retailers - Year-over-year growth 2025-2030 (%)

8.4 Online - Market size and forecast 2025-2030

Chart on Online - Market size and forecast 2025-2030 ($ billion)
Data Table on Online - Market size and forecast 2025-2030 ($ billion)
Chart on Online - Year-over-year growth 2025-2030 (%)
Data Table on Online - Year-over-year growth 2025-2030 (%)

8.5 Market opportunity by Distribution Channel

Market opportunity by Distribution Channel ($ billion)
Data Table on Market opportunity by Distribution Channel ($ billion)

9. Market Segmentation by Type

9.1 Market segments

Chart on Type - Market share 2025-2030 (%)
Data Table on Type - Market share 2025-2030 (%)

9.2 Comparison by Type

Chart on Comparison by Type
Data Table on Comparison by Type

9.3 Gold - Market size and forecast 2025-2030

Chart on Gold - Market size and forecast 2025-2030 ($ billion)
Data Table on Gold - Market size and forecast 2025-2030 ($ billion)
Chart on Gold - Year-over-year growth 2025-2030 (%)
Data Table on Gold - Year-over-year growth 2025-2030 (%)

9.4 Diamond - Market size and forecast 2025-2030

Chart on Diamond - Market size and forecast 2025-2030 ($ billion)
Data Table on Diamond - Market size and forecast 2025-2030 ($ billion)
Chart on Diamond - Year-over-year growth 2025-2030 (%)
Data Table on Diamond - Year-over-year growth 2025-2030 (%)

9.5 Others - Market size and forecast 2025-2030

Chart on Others - Market size and forecast 2025-2030 ($ billion)
Data Table on Others - Market size and forecast 2025-2030 ($ billion)
Chart on Others - Year-over-year growth 2025-2030 (%)
Data Table on Others - Year-over-year growth 2025-2030 (%)

9.6 Market opportunity by Type

Market opportunity by Type ($ billion)
Data Table on Market opportunity by Type ($ billion)

10. Market Segmentation by End-user

10.1 Market segments

Chart on End-user - Market share 2025-2030 (%)
Data Table on End-user - Market share 2025-2030 (%)

10.2 Comparison by End-user

Chart on Comparison by End-user
Data Table on Comparison by End-user

10.3 Women - Market size and forecast 2025-2030

Chart on Women - Market size and forecast 2025-2030 ($ billion)
Data Table on Women - Market size and forecast 2025-2030 ($ billion)
Chart on Women - Year-over-year growth 2025-2030 (%)
Data Table on Women - Year-over-year growth 2025-2030 (%)

10.4 Men - Market size and forecast 2025-2030

Chart on Men - Market size and forecast 2025-2030 ($ billion)
Data Table on Men - Market size and forecast 2025-2030 ($ billion)
Chart on Men - Year-over-year growth 2025-2030 (%)
Data Table on Men - Year-over-year growth 2025-2030 (%)

10.5 Children - Market size and forecast 2025-2030

Chart on Children - Market size and forecast 2025-2030 ($ billion)
Data Table on Children - Market size and forecast 2025-2030 ($ billion)
Chart on Children - Year-over-year growth 2025-2030 (%)
Data Table on Children - Year-over-year growth 2025-2030 (%)

10.6 Market opportunity by End-user

Market opportunity by End-user ($ billion)
Data Table on Market opportunity by End-user ($ billion)

11. Customer Landscape

11.1 Customer landscape overview

Analysis of price sensitivity, lifecycle, customer purchase basket, adoption rates, and purchase criteria

12. Geographic Landscape

12.1 Geographic segmentation

Chart on Market share by geography 2025-2030 (%)
Data Table on Market share by geography 2025-2030 (%)

12.2 Geographic comparison

Chart on Geographic comparison
Data Table on Geographic comparison

12.3 APAC - Market size and forecast 2025-2030

Chart on APAC - Market size and forecast 2025-2030 ($ billion)
Data Table on APAC - Market size and forecast 2025-2030 ($ billion)
Chart on APAC - Year-over-year growth 2025-2030 (%)
Data Table on APAC - Year-over-year growth 2025-2030 (%)
Chart on Regional Comparison - APAC
Data Table on Regional Comparison - APAC

12.3.1 China - Market size and forecast 2025-2030

Chart on China - Market size and forecast 2025-2030 ($ billion)
Data Table on China - Market size and forecast 2025-2030 ($ billion)
Chart on China - Year-over-year growth 2025-2030 (%)
Data Table on China - Year-over-year growth 2025-2030 (%)

12.3.2 Japan - Market size and forecast 2025-2030

Chart on Japan - Market size and forecast 2025-2030 ($ billion)
Data Table on Japan - Market size and forecast 2025-2030 ($ billion)
Chart on Japan - Year-over-year growth 2025-2030 (%)
Data Table on Japan - Year-over-year growth 2025-2030 (%)

12.3.3 India - Market size and forecast 2025-2030

Chart on India - Market size and forecast 2025-2030 ($ billion)
Data Table on India - Market size and forecast 2025-2030 ($ billion)
Chart on India - Year-over-year growth 2025-2030 (%)
Data Table on India - Year-over-year growth 2025-2030 (%)

12.3.4 South Korea - Market size and forecast 2025-2030

Chart on South Korea - Market size and forecast 2025-2030 ($ billion)
Data Table on South Korea - Market size and forecast 2025-2030 ($ billion)
Chart on South Korea - Year-over-year growth 2025-2030 (%)
Data Table on South Korea - Year-over-year growth 2025-2030 (%)

12.3.5 Australia - Market size and forecast 2025-2030

Chart on Australia - Market size and forecast 2025-2030 ($ billion)
Data Table on Australia - Market size and forecast 2025-2030 ($ billion)
Chart on Australia - Year-over-year growth 2025-2030 (%)
Data Table on Australia - Year-over-year growth 2025-2030 (%)

12.3.6 Indonesia - Market size and forecast 2025-2030

Chart on Indonesia - Market size and forecast 2025-2030 ($ billion)
Data Table on Indonesia - Market size and forecast 2025-2030 ($ billion)
Chart on Indonesia - Year-over-year growth 2025-2030 (%)
Data Table on Indonesia - Year-over-year growth 2025-2030 (%)

12.4 North America - Market size and forecast 2025-2030

Chart on North America - Market size and forecast 2025-2030 ($ billion)
Data Table on North America - Market size and forecast 2025-2030 ($ billion)
Chart on North America - Year-over-year growth 2025-2030 (%)
Data Table on North America - Year-over-year growth 2025-2030 (%)
Chart on Regional Comparison - North America
Data Table on Regional Comparison - North America

12.4.1 US - Market size and forecast 2025-2030

Chart on US - Market size and forecast 2025-2030 ($ billion)
Data Table on US - Market size and forecast 2025-2030 ($ billion)
Chart on US - Year-over-year growth 2025-2030 (%)
Data Table on US - Year-over-year growth 2025-2030 (%)

12.4.2 Canada - Market size and forecast 2025-2030

Chart on Canada - Market size and forecast 2025-2030 ($ billion)
Data Table on Canada - Market size and forecast 2025-2030 ($ billion)
Chart on Canada - Year-over-year growth 2025-2030 (%)
Data Table on Canada - Year-over-year growth 2025-2030 (%)

12.4.3 Mexico - Market size and forecast 2025-2030

Chart on Mexico - Market size and forecast 2025-2030 ($ billion)
Data Table on Mexico - Market size and forecast 2025-2030 ($ billion)
Chart on Mexico - Year-over-year growth 2025-2030 (%)
Data Table on Mexico - Year-over-year growth 2025-2030 (%)

12.5 Europe - Market size and forecast 2025-2030

Chart on Europe - Market size and forecast 2025-2030 ($ billion)
Data Table on Europe - Market size and forecast 2025-2030 ($ billion)
Chart on Europe - Year-over-year growth 2025-2030 (%)
Data Table on Europe - Year-over-year growth 2025-2030 (%)
Chart on Regional Comparison - Europe
Data Table on Regional Comparison - Europe

12.5.1 Germany - Market size and forecast 2025-2030

Chart on Germany - Market size and forecast 2025-2030 ($ billion)
Data Table on Germany - Market size and forecast 2025-2030 ($ billion)
Chart on Germany - Year-over-year growth 2025-2030 (%)
Data Table on Germany - Year-over-year growth 2025-2030 (%)

12.5.2 UK - Market size and forecast 2025-2030

Chart on UK - Market size and forecast 2025-2030 ($ billion)
Data Table on UK - Market size and forecast 2025-2030 ($ billion)
Chart on UK - Year-over-year growth 2025-2030 (%)
Data Table on UK - Year-over-year growth 2025-2030 (%)

12.5.3 France - Market size and forecast 2025-2030

Chart on France - Market size and forecast 2025-2030 ($ billion)
Data Table on France - Market size and forecast 2025-2030 ($ billion)
Chart on France - Year-over-year growth 2025-2030 (%)
Data Table on France - Year-over-year growth 2025-2030 (%)

12.5.4 Italy - Market size and forecast 2025-2030

Chart on Italy - Market size and forecast 2025-2030 ($ billion)
Data Table on Italy - Market size and forecast 2025-2030 ($ billion)
Chart on Italy - Year-over-year growth 2025-2030 (%)
Data Table on Italy - Year-over-year growth 2025-2030 (%)

12.5.5 Spain - Market size and forecast 2025-2030

Chart on Spain - Market size and forecast 2025-2030 ($ billion)
Data Table on Spain - Market size and forecast 2025-2030 ($ billion)
Chart on Spain - Year-over-year growth 2025-2030 (%)
Data Table on Spain - Year-over-year growth 2025-2030 (%)

12.5.6 The Netherlands - Market size and forecast 2025-2030

Chart on The Netherlands - Market size and forecast 2025-2030 ($ billion)
Data Table on The Netherlands - Market size and forecast 2025-2030 ($ billion)
Chart on The Netherlands - Year-over-year growth 2025-2030 (%)
Data Table on The Netherlands - Year-over-year growth 2025-2030 (%)

12.6 Middle East and Africa - Market size and forecast 2025-2030

Chart on Middle East and Africa - Market size and forecast 2025-2030 ($ billion)
Data Table on Middle East and Africa - Market size and forecast 2025-2030 ($ billion)
Chart on Middle East and Africa - Year-over-year growth 2025-2030 (%)
Data Table on Middle East and Africa - Year-over-year growth 2025-2030 (%)
Chart on Regional Comparison - Middle East and Africa
Data Table on Regional Comparison - Middle East and Africa

12.6.1 Saudi Arabia - Market size and forecast 2025-2030

Chart on Saudi Arabia - Market size and forecast 2025-2030 ($ billion)
Data Table on Saudi Arabia - Market size and forecast 2025-2030 ($ billion)
Chart on Saudi Arabia - Year-over-year growth 2025-2030 (%)
Data Table on Saudi Arabia - Year-over-year growth 2025-2030 (%)

12.6.2 UAE - Market size and forecast 2025-2030

Chart on UAE - Market size and forecast 2025-2030 ($ billion)
Data Table on UAE - Market size and forecast 2025-2030 ($ billion)
Chart on UAE - Year-over-year growth 2025-2030 (%)
Data Table on UAE - Year-over-year growth 2025-2030 (%)

12.6.3 South Africa - Market size and forecast 2025-2030

Chart on South Africa - Market size and forecast 2025-2030 ($ billion)
Data Table on South Africa - Market size and forecast 2025-2030 ($ billion)
Chart on South Africa - Year-over-year growth 2025-2030 (%)
Data Table on South Africa - Year-over-year growth 2025-2030 (%)

12.6.4 Israel - Market size and forecast 2025-2030

Chart on Israel - Market size and forecast 2025-2030 ($ billion)
Data Table on Israel - Market size and forecast 2025-2030 ($ billion)
Chart on Israel - Year-over-year growth 2025-2030 (%)
Data Table on Israel - Year-over-year growth 2025-2030 (%)

12.6.5 Turkey - Market size and forecast 2025-2030

Chart on Turkey - Market size and forecast 2025-2030 ($ billion)
Data Table on Turkey - Market size and forecast 2025-2030 ($ billion)
Chart on Turkey - Year-over-year growth 2025-2030 (%)
Data Table on Turkey - Year-over-year growth 2025-2030 (%)

12.7 South America - Market size and forecast 2025-2030

Chart on South America - Market size and forecast 2025-2030 ($ billion)
Data Table on South America - Market size and forecast 2025-2030 ($ billion)
Chart on South America - Year-over-year growth 2025-2030 (%)
Data Table on South America - Year-over-year growth 2025-2030 (%)
Chart on Regional Comparison - South America
Data Table on Regional Comparison - South America

12.7.1 Brazil - Market size and forecast 2025-2030

Chart on Brazil - Market size and forecast 2025-2030 ($ billion)
Data Table on Brazil - Market size and forecast 2025-2030 ($ billion)
Chart on Brazil - Year-over-year growth 2025-2030 (%)
Data Table on Brazil - Year-over-year growth 2025-2030 (%)

12.7.2 Argentina - Market size and forecast 2025-2030

Chart on Argentina - Market size and forecast 2025-2030 ($ billion)
Data Table on Argentina - Market size and forecast 2025-2030 ($ billion)
Chart on Argentina - Year-over-year growth 2025-2030 (%)
Data Table on Argentina - Year-over-year growth 2025-2030 (%)

12.7.3 Chile - Market size and forecast 2025-2030

Chart on Chile - Market size and forecast 2025-2030 ($ billion)
Data Table on Chile - Market size and forecast 2025-2030 ($ billion)
Chart on Chile - Year-over-year growth 2025-2030 (%)
Data Table on Chile - Year-over-year growth 2025-2030 (%)

12.8 Market opportunity by geography

Market opportunity by geography ($ billion)
Data Tables on Market opportunity by geography ($ billion)

13. Drivers, Challenges, and Opportunity

13.1 Market drivers

Increasing demand for jewelry as gifts
Growing demand for wedding jewelry
Evolving fashion trends in jewelry collections

13.2 Market challenges

Increasing availability of counterfeit jewelry
Rising barriers to entry in market in focus
Challenges associated with import and export of jewelry

13.3 Impact of drivers and challenges

Impact of drivers and challenges in 2025 and 2030

13.4 Market opportunities

Growing acceptance of jewelry among men
Innovative growth strategies adopted by companies
Technological advancements in jewelry designing

14. Competitive Landscape

14.1 Overview

14.2

Overview on criticality of inputs and factors of differentiation

14.3 Landscape disruption

Overview on factors of disruption

14.4 Industry risks

Impact of key risks on business

15. Competitive Analysis

15.1 Companies profiled

Companies covered

15.2 Company ranking index

15.3 Market positioning of companies

Matrix on companies position and classification

15.4 Asian Star Co. Ltd.

Asian Star Co. Ltd. - Overview
Asian Star Co. Ltd. - Product / Service
Asian Star Co. Ltd. - Key offerings
SWOT

15.5 AU Enterprises Inc.

AU Enterprises Inc. - Overview
AU Enterprises Inc. - Product / Service
AU Enterprises Inc. - Key offerings
SWOT

15.6 Boma Jewelry Inc.

Boma Jewelry Inc. - Overview
Boma Jewelry Inc. - Product / Service
Boma Jewelry Inc. - Key offerings
SWOT

15.7 Cartier SA

Cartier SA - Overview
Cartier SA - Product / Service
Cartier SA - Key offerings
SWOT

15.8 Casting House Inc.

Casting House Inc. - Overview
Casting House Inc. - Product / Service
Casting House Inc. - Key offerings
SWOT

15.9 DeBebians Inc.

DeBebians Inc. - Overview
DeBebians Inc. - Product / Service
DeBebians Inc. - Key offerings
SWOT

15.10 H. Stern Com. and Ind. SA

H. Stern Com. and Ind. SA - Overview
H. Stern Com. and Ind. SA - Product / Service
H. Stern Com. and Ind. SA - Key offerings
SWOT

15.11 LVMH Moet Hennessy

LVMH Moet Hennessy - Overview
LVMH Moet Hennessy - Business segments
LVMH Moet Hennessy - Key news
LVMH Moet Hennessy - Key offerings
LVMH Moet Hennessy - Segment focus
SWOT

15.12 Malabar Gold and Diamonds

Malabar Gold and Diamonds - Overview
Malabar Gold and Diamonds - Product / Service
Malabar Gold and Diamonds - Key offerings
SWOT

15.13 MKM Jewelry Inc.

MKM Jewelry Inc. - Overview
MKM Jewelry Inc. - Product / Service
MKM Jewelry Inc. - Key offerings
SWOT

15.14 Parad Jewelry LLC

Parad Jewelry LLC - Overview
Parad Jewelry LLC - Product / Service
Parad Jewelry LLC - Key offerings
SWOT

15.15 Rajesh Exports Ltd.

Rajesh Exports Ltd. - Overview
Rajesh Exports Ltd. - Product / Service
Rajesh Exports Ltd. - Key offerings
SWOT

15.16 Royi Sal Co. Ltd.

Royi Sal Co. Ltd. - Overview
Royi Sal Co. Ltd. - Product / Service
Royi Sal Co. Ltd. - Key offerings
SWOT

15.17 Swarovski AG

Swarovski AG - Overview
Swarovski AG - Product / Service
Swarovski AG - Key offerings
SWOT

15.18 Yiwu Nihao Jewelry Co. Ltd.

Yiwu Nihao Jewelry Co. Ltd. - Overview
Yiwu Nihao Jewelry Co. Ltd. - Product / Service
Yiwu Nihao Jewelry Co. Ltd. - Key offerings
SWOT

16. Appendix

16.1 Scope of the report

Market definition
Objectives
Notes and caveats

16.2 Inclusions and exclusions checklist

Inclusions checklist
Exclusions checklist

16.3 Currency conversion rates for US$

16.4 Research methodology

16.5 Data procurement

Information sources

16.6 Data validation

16.7 Validation techniques employed for market sizing

16.8 Data synthesis

16.9 360 degree market analysis

16.10 List of abbreviations

Research Methodology

Technavio presents a detailed picture of the market by way of study, synthesis, and summation of data from multiple sources. The analysts have presented the various facets of the market with a particular focus on identifying the key industry influencers. The data thus presented is comprehensive, reliable, and the result of extensive research, both primary and secondary.

INFORMATION SOURCES

Primary sources

  • Manufacturers and suppliers
  • Channel partners
  • Industry experts
  • Strategic decision makers

Secondary sources

  • Industry journals and periodicals
  • Government data
  • Financial reports of key industry players
  • Historical data
  • Press releases

DATA ANALYSIS

Data Synthesis

  • Collation of data
  • Estimation of key figures
  • Analysis of derived insights

Data Validation

  • Triangulation with data models
  • Reference against proprietary databases
  • Corroboration with industry experts

REPORT WRITING

Qualitative

  • Market drivers
  • Market challenges
  • Market trends
  • Five forces analysis

Quantitative

  • Market size and forecast
  • Market segmentation
  • Geographical insights
  • Competitive landscape

Interested in this report?

Get your sample now to see our research methodology and insights!

Download Now

Frequently Asked Questions

Jewelry market growth will increase by USD 121.4 billion during 2026-2030.

The Jewelry market is expected to grow at a CAGR of 5.5% during 2026-2030.

Jewelry market is segmented by Distribution channel (Specialist retailers, Online) Type (Gold, Diamond, Others) End-user (Women, Men, Children)

Asian Star Co. Ltd., AU Enterprises Inc., Boma Jewelry Inc., Cartier SA, Casting House Inc., Chic Pistachio LLC, DeBebians Inc., Gildform Inc., H. Stern Com. and Ind. SA, Kapit Mas Pty Ltd., KGS Jewels Inc., LVMH Moet Hennessy, Malabar Gold and Diamonds, Mangla International, MKM Jewelry Inc., Parad Jewelry LLC, Rajesh Exports Ltd., Royi Sal Co. Ltd., Swarovski AG, Wayfair Inc., Yiwu Nihao Jewelry Co. Ltd. are a few of the key vendors in the Jewelry market.

APAC will register the highest growth rate of 58.5% among the other regions. Therefore, the Jewelry market in APAC is expected to garner significant business opportunities for the vendors during the forecast period.

China, Japan, India, South Korea, Australia, Indonesia, US, Canada, Mexico, Germany, UK, France, Italy, Spain, The Netherlands, Saudi Arabia, UAE, South Africa, Israel, Turkey, Brazil, Argentina, Chile

  • Increasing demand for jewelry as gifts is the driving factor this market.

The Jewelry market vendors should focus on grabbing business opportunities from the Distribution channel segment as it accounted for the largest market share in the base year.