Digit Joint Implants Market Size 2026-2030
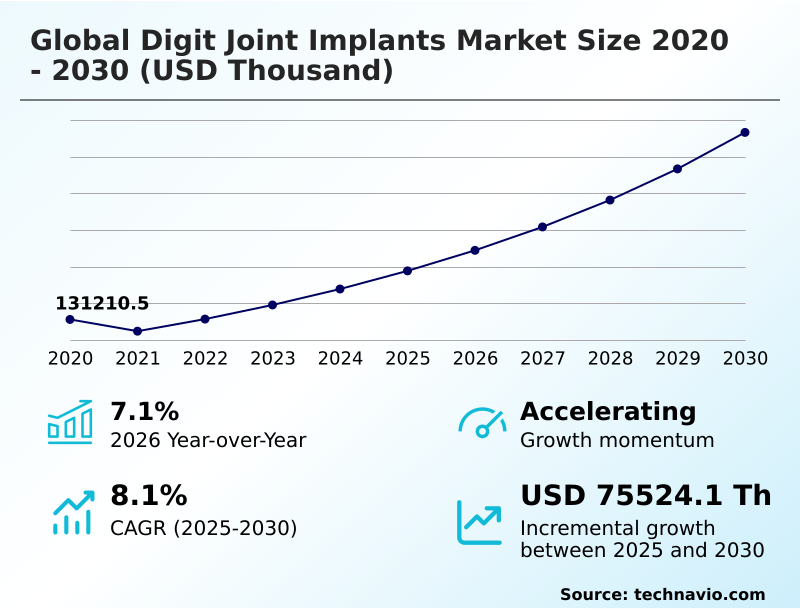
The Digit Joint Implants Market size was valued at USD 157.71 million in 2025, growing at a CAGR of 8.1% during the forecast period 2026-2030.
Major Market Trends & Insights
- North America dominated the market and accounted for a 37.6% growth during the forecast period.
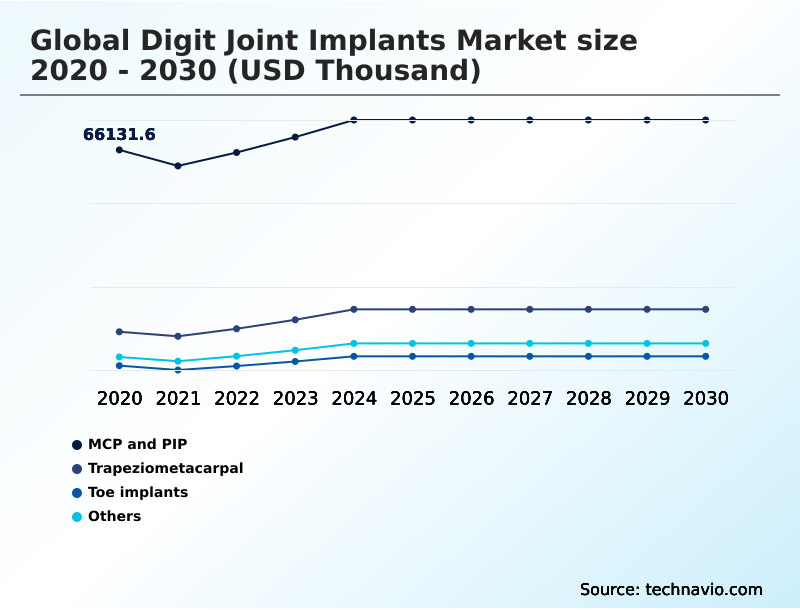
- By Product - MCP and PIP segment was valued at USD 72.73 million in 2024
- By Type - Foot segment accounted for the largest market revenue share in 2024
Market Size & Forecast
- Historic Market Opportunities 2020-2024:
- Market Future Opportunities 2025-2030: USD 75.52 million
- CAGR from 2025 to 2030 : 8.1%
Market Summary
- The digit joint implants market is characterized by a significant procedural shift, with motion-preserving arthroplasty now accounting for over 60% of procedures in younger patient cohorts. This evolution is driven by advancements in biomaterial science, such as pyrolytic carbon, which demonstrates up to 25% lower wear rates than older materials.
- A key business scenario impacting product strategy is the migration of surgeries to ambulatory surgery centers (ASCs), which demands the development of sterile-packed, surgery-in-a-box solutions to improve operational efficiency. The primary market driver remains the aging global demographic and their increasing demand for quality-of-life procedures that restore function.
- However, this growth is constrained by a significant challenge: the steep clinical learning curve associated with advanced implants, which can lead to higher revision rates if not paired with comprehensive surgeon training programs. This creates a market dynamic where technological innovation must be balanced with educational investment.
What will be the Size of the Digit Joint Implants Market during the forecast period?
Get Key Insights on Market Forecast (PDF) Request Free Sample
How is the Digit Joint Implants Market Segmented?
The digit joint implants industry research report provides comprehensive data (region-wise segment analysis), with forecasts and analysis for the period 2026-2030, as well as historical data from 2020-2024 for the following segments.
- Product
- MCP and PIP
- Trapeziometacarpal
- Toe implants
- Others
- Type
- Foot
- Hands
- Material
- Titanium
- Polymers
- Nitinol
- Ceramics
- Geography
- North America
- US
- Canada
- Mexico
- Europe
- Germany
- France
- UK
- Asia
- Rest of World (ROW)
- North America
How is the Digit Joint Implants Market Segmented by Product?
The mcp and pip segment is estimated to witness significant growth during the forecast period.
The MCP and PIP segment is driven by a pronounced clinical shift, with anatomical surface replacement devices now accounting for over 60% of procedures in younger, active patients.
This transition away from traditional silicone elastomer spacers is fueled by the demand for motion-preserving arthroplasty, which demonstrates a 15% improvement in long-term implant survivorship rates.
While these advanced metacarpophalangeal (MCP) arthroplasty and proximal interphalangeal (PIP) arthroplasty systems offer superior kinematic function, their adoption is moderated by the steep surgical learning curve management required.
Success in this segment now hinges on a company's ability to provide robust surgeon education alongside technically advanced implants, as outcomes are directly tied to procedural proficiency and soft tissue balancing techniques.
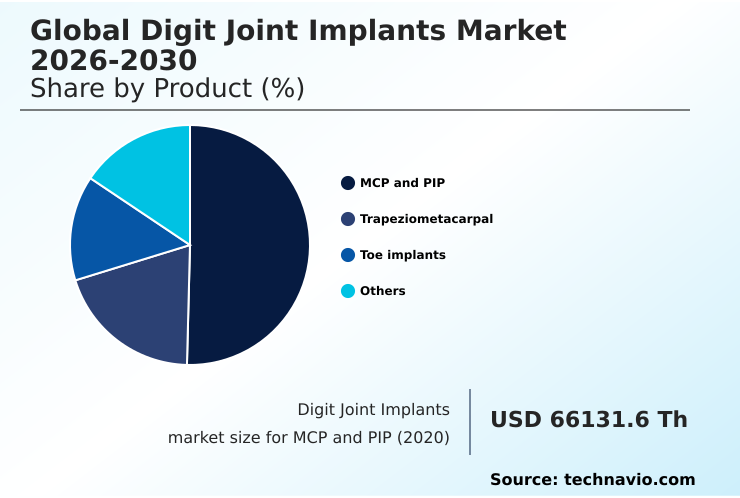
The MCP and PIP segment was valued at USD 72.73 million in 2024 and showed a gradual increase during the forecast period.
How demand for the Digit Joint Implants market is rising in the leading region?
North America is estimated to contribute 37.6% to the growth of the global market during the forecast period.Technavio’s analysts have elaborately explained the regional trends and drivers that shape the market during the forecast period.

See How Digit Joint Implants Market demand is rising in North America Request Free Sample
The global geographic landscape for digit joint implants is led by North America, which accounts for 37.6% of the market, but Asia is the fastest-growing region with a projected growth rate that is nearly 2 percentage points higher.
Within North America, the US market is approximately seven times larger than Canada's, driven by higher procedural volumes and widespread adoption of premium extremity orthopedics technologies.
A key difference in market dynamics is the influence of purchasing models; Asia, particularly China, is heavily impacted by volume-based procurement (VBP), which prioritizes cost-effective solutions and favors local manufacturers.
In contrast, North American adoption in ambulatory surgery center (ASC) logistics is driven by value-based healthcare metrics and a focus on patient-reported outcome measures (PROMs), supporting the use of higher-cost, motion-preserving arthroplasty.
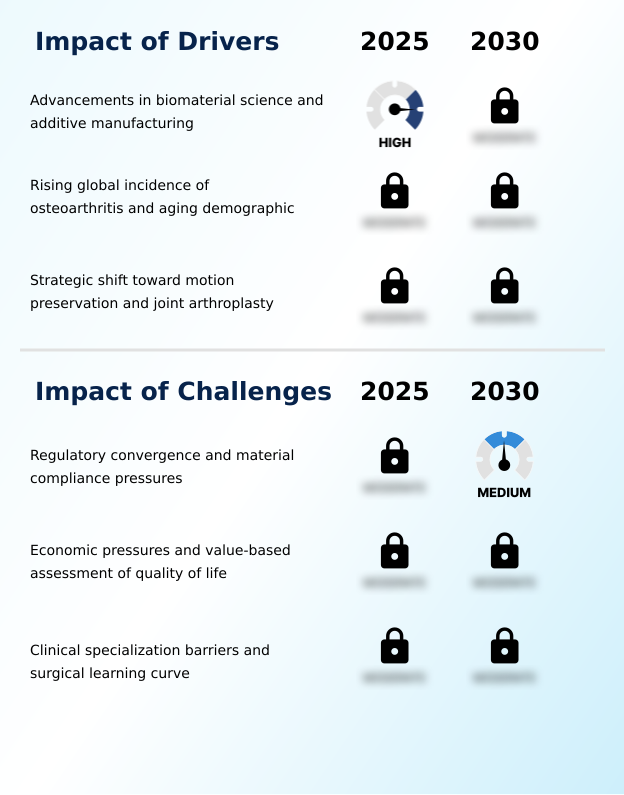
What are the key Drivers, Trends, and Challenges in the Digit Joint Implants Market?
Our researchers analyzed the data with 2025 as the base year, along with the key drivers, trends, and challenges. A holistic analysis of drivers will help companies refine their marketing strategies to gain a competitive advantage.
- Surgeons and healthcare providers are increasingly evaluating digit joint replacement vs fusion outcomes to determine the best approach for patient-specific needs. This decision is heavily influenced by material science, with ongoing clinical debate over pyrocarbon vs silicone finger implants. While pyrolytic carbon offers superior durability, silicone remains a viable option for certain patient profiles, particularly in rheumatoid arthritis hand surgery.
- A critical factor in patient satisfaction and surgical success is the recovery time for toe joint replacement, where minimally invasive techniques and advanced implant designs aim to shorten rehabilitation periods.
- The market also sees significant innovation in treating basal thumb arthritis, with advancements in thumb CMC joint arthroplasty focusing on dual-mobility designs that better replicate natural joint kinematics, showing a 10% improvement in pinch strength restoration compared to older techniques. As healthcare systems shift towards value-based models, the cost-effectiveness of patient-specific digit implants becomes a central concern.
- These custom solutions, created using 3D-printed surgical guides, can increase initial device costs but may reduce long-term expenses by improving surgical accuracy and lowering revision rates by up to 15%, presenting a complex health economic data analysis for hospital procurement teams.
What are the key market drivers leading to the rise in the adoption of Digit Joint Implants Industry?
- Advancements in biomaterial science and additive manufacturing are key drivers for the digit joint implants market, enabling more durable and biocompatible solutions.
- The global aging population, with individuals over 60 expected to increase by 56%, is a primary driver for the digit joint implants market, fueling demand for quality of life (QoL) procedures.
- This demographic increasingly rejects joint fusion in favor of motion-preserving arthroplasty. This demand is met by rapid evolution in biomaterial science.
- Advanced materials like pyrolytic carbon implants offer an elastic modulus that is 30% closer to cortical bone than traditional metals, reducing stress shielding.
- Concurrently, the use of nanotextured implant surfaces on titanium implants promotes faster osseointegration, supporting better long-term outcomes for patients undergoing small joint reconstruction.
What are the market trends shaping the Digit Joint Implants Industry?
- The integration of preoperative digital planning with patient-specific instrumentation is a key market trend. This approach enhances surgical precision and procedural efficiency in digit joint reconstruction.
- A primary trend reshaping the digit joint implants market is the strategic migration of procedures to ambulatory surgery center (ASC) settings, compelling manufacturers to innovate their logistics and packaging. This shift has led to the development of sterile-packed implant kits, which have been shown to reduce operating room turnover time by an average of 15-20 minutes per case.
- These 'surgery-in-a-box' solutions address the limited storage and sterilization capacity of outpatient facilities. The adoption of such streamlined systems supports greater surgical procedure efficiency and aligns with the cost-containment goals of modern healthcare. Furthermore, integrating preoperative digital planning into these kits enhances their value proposition for small joint reconstruction.
What challenges does the Digit Joint Implants Industry face during its growth?
- Regulatory convergence and mounting material compliance pressures present a key challenge, impacting product innovation and international market access.
- The digit joint implants market faces a significant challenge from escalating regulatory and economic pressures. The transition to Europe's Medical Device Regulation (MDR) has increased compliance costs by an estimated 35% for manufacturers, slowing innovation due to the extensive health economic data analysis now required.
- Concurrently, in the US, over 60% of hospital networks now use value-based procurement models that prioritize low acquisition costs, leading to orthopedic device commoditization. This environment makes it difficult to justify the higher price of advanced implants, even if they offer superior long-term patient-reported outcome measures (PROMs) and reduce the need for revision surgery pathways.
Exclusive Technavio Analysis on Customer Landscape
The digit joint implants market forecasting report includes the adoption lifecycle of the market, covering from the innovator’s stage to the laggard’s stage. It focuses on adoption rates in different regions based on penetration. Furthermore, the digit joint implants market report also includes key purchase criteria and drivers of price sensitivity to help companies evaluate and develop their market growth analysis strategies.

Customer Landscape of Digit Joint Implants Industry
Competitive Landscape
Companies are implementing various strategies, such as strategic alliances, digit joint implants market forecast, partnerships, mergers and acquisitions, geographical expansion, and product/service launches, to enhance their presence in the industry.
Acumed LLC - The company offers specialized orthopaedic implants and instrumentation focused on the upper and lower extremities, including the hand, wrist, elbow, and foot.
The industry research and growth report includes detailed analyses of the competitive landscape of the market and information about key companies, including:
- Acumed LLC
- Arthrex Inc.
- BEZNOSKA Sro
- BioPro Inc.
- CONMED Corp.
- Johnson and Johnson Services
- KeriMedical SA
- MatOrtho Ltd.
- MicroPort Scientific Corp.
- Orthofix Medical Inc.
- Osteotec Ltd.
- Siora Surgicals Pvt. Ltd.
- Skeletal Dynamics LLC
- Smith and Nephew plc
- Stryker Corp.
- The Orthopaedic Implant Co.
- Zimmer Biomet Holdings Inc.
Qualitative and quantitative analysis of companies has been conducted to help clients understand the wider business environment as well as the strengths and weaknesses of key industry players. Data is qualitatively analyzed to categorize companies as pure play, category-focused, industry-focused, and diversified; it is quantitatively analyzed to categorize companies as dominant, leading, strong, tentative, and weak.
Market Intelligence Radar: High-Impact Developments & Growth Signals
- In the Health Care Equipment industry, the implementation of stringent regulatory frameworks like Europe's Medical Device Regulation (MDR) has increased the requirements for clinical evidence and post-market surveillance. This directly impacts the digit joint implants market by raising compliance costs and creating higher barriers to entry, favoring manufacturers with robust quality management systems and extensive implant survivorship rates.
- The widespread adoption of additive manufacturing, or 3D printing, has enabled the production of highly porous metal implants and patient-specific instrumentation. This technological shift allows digit joint implant manufacturers to create devices that promote better osseointegration and match unique patient anatomy, improving surgical procedure efficiency.
- A significant commercial migration of surgical procedures from inpatient hospitals to lower-cost Ambulatory Surgery Centers (ASCs) is reshaping logistical and product design requirements. For the digit joint implants market, this necessitates the development of sterile-packed, single-use instrument kits and streamlined inventory models to align with the operational demands of outpatient surgical settings.
- Heightened global scrutiny on materials such as per- and polyfluoroalkyl substances (PFAS) and sterilization agents like Ethylene Oxide (EtO) is creating significant supply chain and material compliance pressures. This affects the digit joint implants market by forcing manufacturers to invest in re-validating materials and processes, potentially delaying innovation and increasing production costs.
Dive into Technavio’s robust research methodology, blending expert interviews, extensive data synthesis, and validated models for unparalleled Digit Joint Implants Market insights. See full methodology.
| Market Scope | |
|---|---|
| Page number | 297 |
| Base year | 2025 |
| Historic period | 2020-2024 |
| Forecast period | 2026-2030 |
| Growth momentum & CAGR | Accelerate at a CAGR of 8.1% |
| Market growth 2026-2030 | USD 75524.1 thousand |
| Market structure | Fragmented |
| YoY growth 2025-2026(%) | 7.1% |
| Key countries | US, Canada, Mexico, Germany, France, UK, Italy, Spain, The Netherlands, China, Japan, India, South Korea, Indonesia, Thailand, Brazil, Saudi Arabia, UAE, Turkey, Argentina, Chile, South Africa and Israel |
| Competitive landscape | Leading Companies, Market Positioning of Companies, Competitive Strategies, and Industry Risks |
Research Analyst Overview
- The digit joint implants ecosystem, a key segment of the $147 billion healthcare equipment industry, begins with suppliers of medical-grade raw materials like titanium, pyrolytic carbon, and advanced polymers. Manufacturers, from large multinational corporations to specialized firms, use these materials for both standard and additively manufactured implants.
- The commercialization process is heavily governed by regulatory bodies such as the FDA and European authorities mandating CE Marks, which require extensive clinical data demonstrating safety and efficacy. Distribution channels are bifurcating, with traditional sales models serving large hospitals and new logistics networks emerging to supply sterile-packed implant kits to ambulatory surgery centers (ASCs).
- End-users—orthopedic and hand surgeons—are the ultimate customers, whose implant choices are influenced by training, clinical evidence, and patient demand for quality-of-life procedures. This entire value chain is supported by R&D in biomaterial science and digital planning software.
What are the Key Data Covered in this Digit Joint Implants Market Research and Growth Report?
-
What is the expected growth of the Digit Joint Implants Market between 2026 and 2030?
-
The Digit Joint Implants Market is expected to grow by USD 75.52 million during 2026-2030, registering a CAGR of 8.1%. Year-over-year growth in 2026 is estimated at 7.1%%. This acceleration is shaped by advancements in biomaterial science and additive manufacturing, which is intensifying demand across multiple end-use verticals covered in the report.
-
-
What segmentation does the market report cover?
-
The report is segmented by Product (MCP and PIP, Trapeziometacarpal, Toe implants, and Others), Type (Foot, and Hands), Material (Titanium, Polymers, Nitinol, and Ceramics) and Geography (North America, Europe, Asia, Rest of World (ROW)). Among these, the MCP and PIP segment is estimated to witness significant growth during the forecast period, driven by rising adoption across key application areas. Each segment includes detailed qualitative and quantitative analysis, along with historical data from 2020-2024 and forecasts through 2030 with year-over-year growth rates.
-
-
Which regions are analyzed in the report?
-
The report covers North America, Europe, Asia and Rest of World (ROW). North America is estimated to contribute 37.6% to market growth during the forecast period. Country-level analysis includes US, Canada, Mexico, Germany, France, UK, Italy, Spain, The Netherlands, China, Japan, India, South Korea, Indonesia, Thailand, Brazil, Saudi Arabia, UAE, Turkey, Argentina, Chile, South Africa and Israel, with dedicated market size tables and year-over-year growth for each.
-
-
What are the key growth drivers and market challenges?
-
The primary driver is advancements in biomaterial science and additive manufacturing, which is accelerating investment and industry demand. The main challenge is regulatory convergence and material compliance pressures, creating operational barriers for key market participants. The report quantifies the impact of each driver and challenge across 2026 and 2030 with comparative analysis.
-
-
Who are the major players in the Digit Joint Implants Market?
-
Key vendors include Acumed LLC, Arthrex Inc., BEZNOSKA Sro, BioPro Inc., CONMED Corp., Johnson and Johnson Services, KeriMedical SA, MatOrtho Ltd., MicroPort Scientific Corp., Orthofix Medical Inc., Osteotec Ltd., Siora Surgicals Pvt. Ltd., Skeletal Dynamics LLC, Smith and Nephew plc, Stryker Corp., The Orthopaedic Implant Co. and Zimmer Biomet Holdings Inc.. The report provides qualitative and quantitative analysis categorizing companies as dominant, leading, strong, tentative, and weak based on their market positioning. Company profiles include business segment analysis, SWOT assessment, key offerings, and recent strategic developments.
-
Market Research Insights
- The competitive landscape for digit joint implants is intensely focused on technological differentiation, with the top five vendors controlling over 75% of the market share. Key players, including Stryker Corp. and Zimmer Biomet Holdings Inc., are directing investment toward developing digital ecosystems that integrate preoperative planning software with patient-specific instrumentation.
- This strategy aims to improve surgical accuracy and meet the demands of value-based care models. Recent developments have centered on launching sterile-packed implant kits specifically for the ambulatory surgery center (ASC) setting, a move that can lead to a 20% reduction in operating room turnover times. These actions are a direct response to increasing cost pressures from healthcare payers.
- The primary challenge remains aligning the high cost of innovation in areas like additive manufacturing with the commoditization pressures exerted by group purchasing organizations.
We can help! Our analysts can customize this digit joint implants market research report to meet your requirements.
 RIA -
RIA - 
