Laminated Busbar Market Analysis, Size, and Forecast 2026-2030: Europe (Germany, UK, and France), APAC (China, Japan, and India), North America (US, Canada, and Mexico), Middle East and Africa (Saudi Arabia, UAE, and South Africa), South America (Brazil, Argentina, and Colombia), and Rest of World (ROW)

Laminated Busbar Market Analysis, Size, and Forecast 2026-2030:
Europe (Germany, UK, and France), APAC (China, Japan, and India), North America (US, Canada, and Mexico), Middle East and Africa (Saudi Arabia, UAE, and South Africa), South America (Brazil, Argentina, and Colombia), and Rest of World (ROW)

Published: Jan 2026 287 Pages SKU: IRTNTR73978

Market Overview at a Glance

$343.5 Mn
Market Opportunity
5.9%
CAGR 2025 - 2030
33.5%
APAC Growth
$651.4 Mn
Copper segment 2024

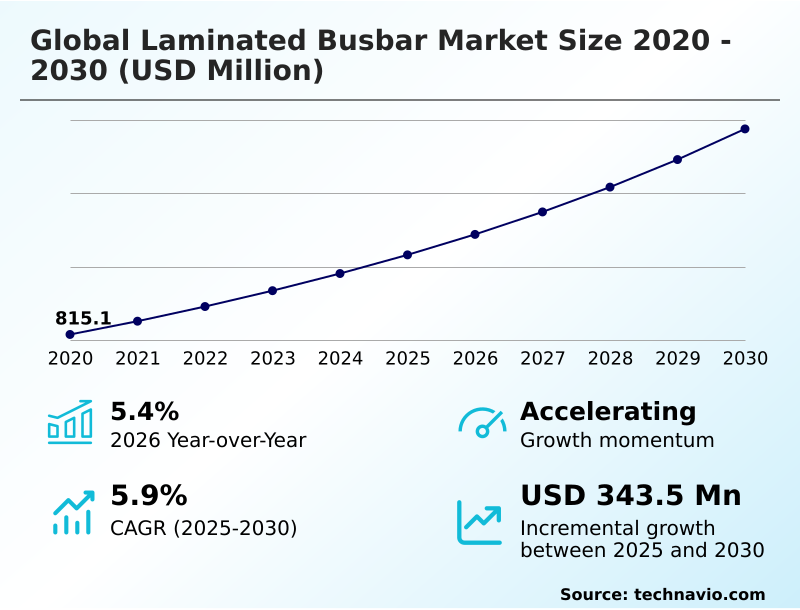
Laminated Busbar Market Size 2026-2030

The laminated busbar market size is valued to increase by USD 343.5 million, at a CAGR of 5.9% from 2025 to 2030. Increasing use of laminated busbars in EVs will drive the laminated busbar market.

Major Market Trends & Insights

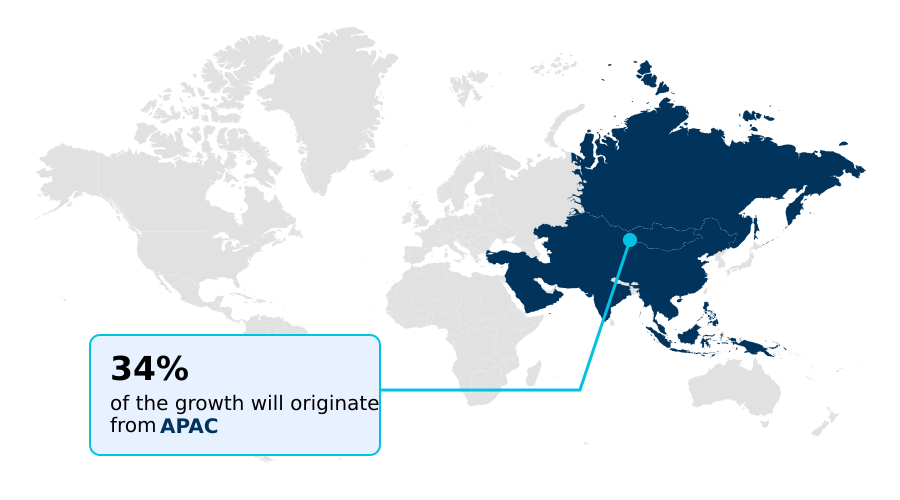
  • APAC dominated the market and accounted for a 33.5% growth during the forecast period.
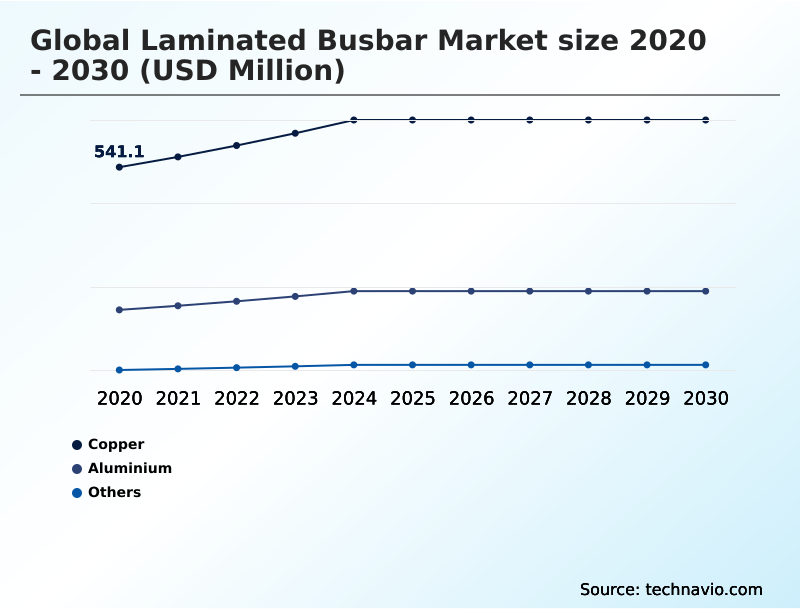
  • By Material - Copper segment was valued at USD 651.4 million in 2024
  • By Application - Power distribution segment accounted for the largest market revenue share in 2024

Market Size & Forecast

  • Market Opportunities: USD 560.6 million
  • Market Future Opportunities: USD 343.5 million
  • CAGR from 2025 to 2030 : 5.9%

Market Summary

  • The laminated busbar market is defined by a fundamental shift away from conventional wiring toward integrated, high-performance power distribution solutions. This transition is driven by the need for enhanced electrical system reliability and power transmission efficiency in sectors where space and thermal performance are critical.
  • Applications in electric vehicle (EV) battery packs and automotive powertrain systems are expanding rapidly, as these components offer a compact footprint and superior heat dissipation, improving power density optimization. Similarly, renewable energy inverters and smart grid infrastructure rely on low inductance designs to handle high-frequency switching and mitigate voltage spikes.
  • However, manufacturers face challenges related to the procurement of advanced insulation materials and fluctuating raw material costs.
  • For an OEM developing a new EV platform, integrating custom busbar design early in the process is crucial for achieving vehicle miniaturization goals and ensuring the electrical interconnect solutions meet stringent safety and performance standards, reducing system weight by over 10% compared to traditional cable harnesses.

What will be the Size of the Laminated Busbar Market during the forecast period?

Get Key Insights on Market Forecast (PDF) Request Free Sample

How is the Laminated Busbar Market Segmented?

The laminated busbar industry research report provides comprehensive data (region-wise segment analysis), with forecasts and estimates in "USD million" for the period 2026-2030, as well as historical data from 2020-2024 for the following segments.

  • Material
    • Copper
    • Aluminium
    • Others
  • Application
    • Power distribution
    • Energy storage systems
    • Others
  • End-user
    • Utilities
    • Industrial
    • Commercial
    • Others
  • Geography
    • Europe
      • Germany
      • UK
      • France
    • APAC
      • China
      • Japan
      • India
    • North America
      • US
      • Canada
      • Mexico
    • Middle East and Africa
      • Saudi Arabia
      • UAE
      • South Africa
    • South America
      • Brazil
      • Argentina
      • Colombia
    • Rest of World (ROW)

By Material Insights

The copper segment is estimated to witness significant growth during the forecast period.

Copper remains the material of choice, establishing the industry benchmark with an International Annealed Copper Standard (IACS) rating of 100% for electrical conductivity.

This property is crucial for demanding power electronics solutions and high-voltage direct current (HVDC) systems where efficiency is non-negotiable. The material's superior mechanical performance ensures durability in multilayer copper busbars, which are created through a precise busbar lamination process.

Engineers rely on custom busbar design using these low impedance interconnects to enhance power conversion efficiency in critical power conditioning systems.

Its ability to manage high thermal loads while maintaining structural integrity solidifies its dominant position for high-performance applications where reliability cannot be compromised.

Request Free Sample

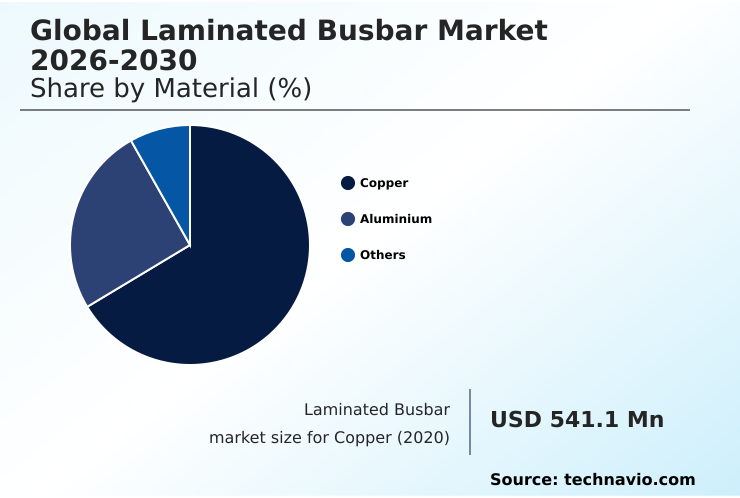
The Copper segment was valued at USD 651.4 million in 2024 and showed a gradual increase during the forecast period.

Request Free Sample

Regional Analysis

APAC is estimated to contribute 33.5% to the growth of the global market during the forecast period.Technavio’s analysts have elaborately explained the regional trends and drivers that shape the market during the forecast period.

See How Laminated Busbar Market Demand is Rising in APAC Request Free Sample

The geographic landscape is characterized by strong demand in regions with advanced industrial and technological ecosystems. North America, driven by the expansion of data center power distribution and EV manufacturing, shows significant adoption.

The region accounts for over 20% of the market. APAC leads in incremental growth, contributing over 33%, fueled by investments in industrial automation power and renewable energy.

In these regions, the use of laminated busbars in high-voltage applications is critical for stray inductance reduction and voltage spike mitigation, especially with the adoption of silicon carbide (SiC) devices.

Proper power module integration within switchgear applications using these components improves system safety and efficiency.

Market Dynamics

Our researchers analyzed the data with 2025 as the base year, along with the key drivers, trends, and challenges. A holistic analysis of drivers will help companies refine their marketing strategies to gain a competitive advantage.

  • An in-depth review of the Global Laminated Busbar Market 2026-2030 reveals a landscape shaped by distinct technological needs. The core Global Laminated Busbar Market 2026-2030 drivers include the push for electrification and efficiency, while key Global Laminated Busbar Market 2026-2030 trends point toward wider adoption in renewables and EVs.
  • The technical discussion often centers on the laminated busbar vs cable solutions debate, where busbars offer superior performance by improving power density with busbars and reducing EMI in power systems. For instance, a system utilizing a laminated busbar for EV inverters can be significantly more compact than a cabled equivalent.
  • The Global Laminated Busbar Market 2026-2030 applications are diverse, spanning from laminated busbar for industrial automation to large-scale grid infrastructure. Specific engineering focus is on high voltage busbar thermal performance and creating the ideal low inductance busbar for SiC and other wide-bandgap semiconductors to optimize busbar performance in high frequency switching.
  • Key growth areas include custom busbar design for switchgear and effective busbar design for renewable energy. The reliability of busbars in smart grids and successful busbar integration in energy storage are also paramount. However, the Global Laminated Busbar Market 2026-2030 challenges, primarily the cost analysis of laminated busbars influenced by raw materials, persist.
  • Future progress will depend on advancements in busbar insulation materials and innovations in thermal management in laminated busbars. The Global Laminated Busbar Market 2026-2030 segmentation reflects these varied uses and material choices.

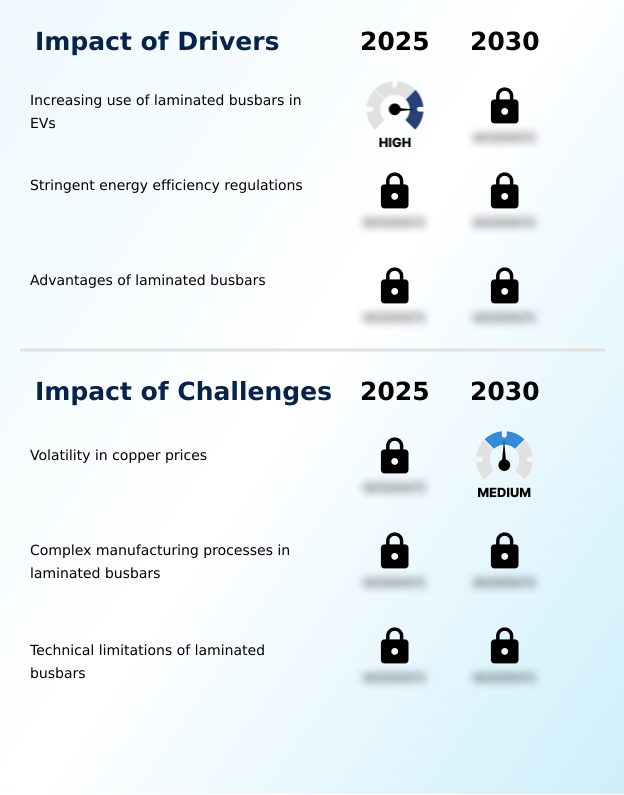
What are the key market drivers leading to the rise in the adoption of Laminated Busbar Industry?

  • The expanding use of laminated busbars within electric vehicle powertrains and charging systems is a primary driver fueling market growth.

  • The electrification of the transport sector is a major market driver, particularly the expansion of electric vehicle (EV) battery packs and automotive powertrain systems.
  • Laminated busbars provide essential electrical interconnect solutions that support vehicle miniaturization by offering a low inductance design in a consolidated form factor, reducing component weight by up to 30%.
  • Their inherent electromagnetic interference (EMI) shielding properties are critical for protecting sensitive electronics. With high current capacity, these components enhance the performance of high-speed train power systems and railway traction converters.
  • The superior current carrying capability of busbars allows for designs that handle peak loads more effectively than wire harnesses, improving system reliability by 15%.

What are the market trends shaping the Laminated Busbar Industry?

  • The increasing adoption of renewable energy sources is an influential market trend. This development drives the need for advanced components to ensure efficiency in solar and wind power systems.

  • The accelerating adoption of renewable energy is a primary trend shaping the market, with grid modernization projects increasingly specifying advanced components. The integration of large-scale solar and wind farms into the smart grid infrastructure requires robust thermal management solutions to ensure operational stability.
  • Laminated busbars are critical within renewable energy inverters and wind turbine converters, where their compact footprint facilitates power density optimization. In energy storage systems (ESS), these components improve heat dissipation improvement by over 25% compared to legacy wiring.
  • Their design, optimized for insulated gate bipolar transistors (IGBT), also helps reduce energy loss during power conversion, boosting overall system efficiency by as much as 3%.

What challenges does the Laminated Busbar Industry face during its growth?

  • Volatility in copper prices presents a significant challenge to the industry, directly affecting manufacturing costs and market price stability.

  • Navigating material science and supply chain complexities presents an ongoing challenge. While advanced insulation materials like polyethylene terephthalate (PET) and specialized epoxy insulation improve dielectric material performance, their cost can be volatile, impacting final product pricing by up to 20%. Achieving consistent thermal conductivity enhancement for high-frequency switching applications requires significant R&D investment.
  • Furthermore, providing extensive OEM engineering support for modular busbar configurations adds to operational overhead. Balancing the need for superior electrical system reliability and power transmission efficiency with these cost pressures is a key strategic hurdle for manufacturers, as material costs can constitute over 50% of the total manufacturing expense.

Exclusive Technavio Analysis on Customer Landscape

The laminated busbar market forecasting report includes the adoption lifecycle of the market, covering from the innovator’s stage to the laggard’s stage. It focuses on adoption rates in different regions based on penetration. Furthermore, the laminated busbar market report also includes key purchase criteria and drivers of price sensitivity to help companies evaluate and develop their market growth analysis strategies.

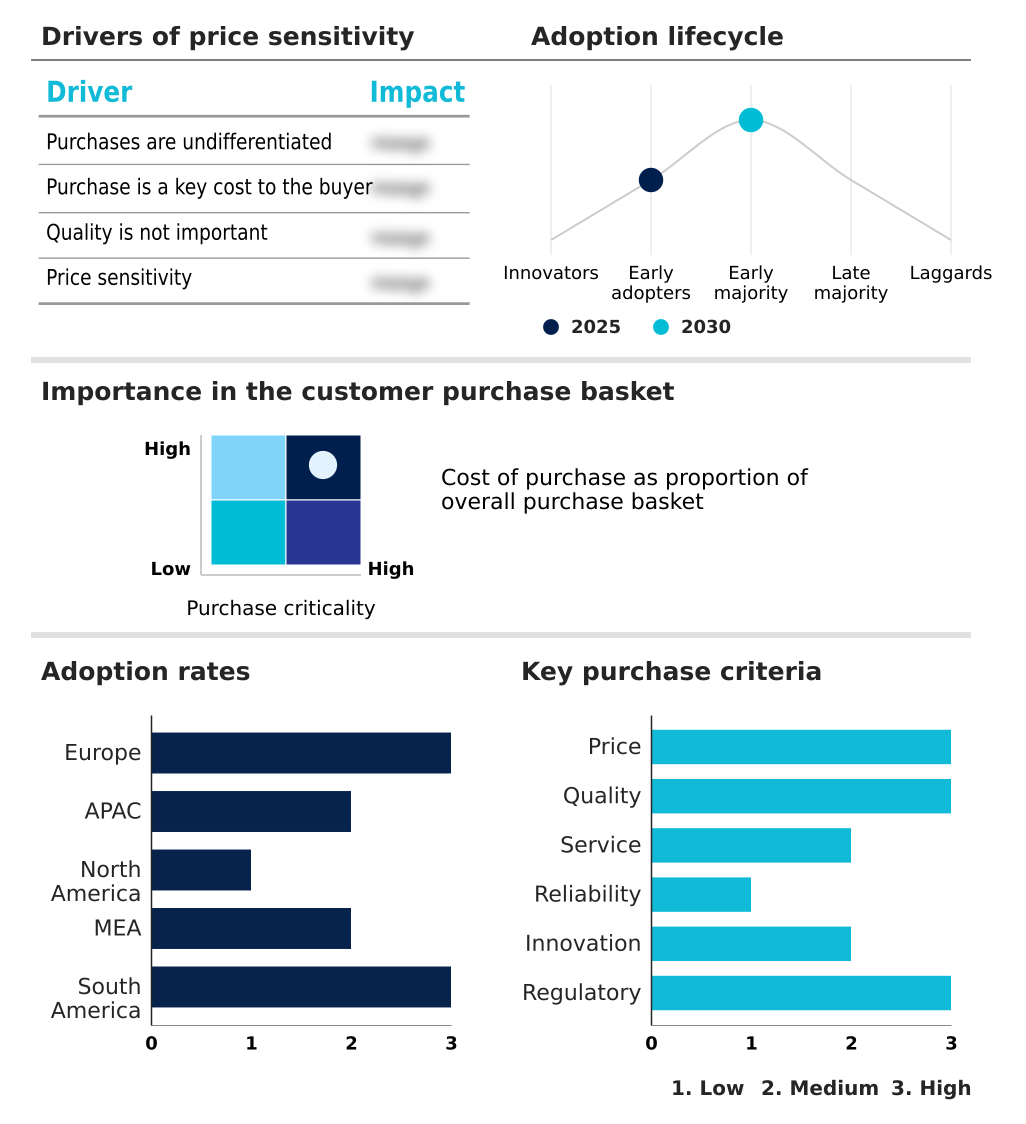
Customer Landscape of Laminated Busbar Industry

Competitive Landscape

Companies are implementing various strategies, such as strategic alliances, laminated busbar market forecast, partnerships, mergers and acquisitions, geographical expansion, and product/service launches, to enhance their presence in the industry.

Amphenol Corp. - Engineered interconnect solutions, including custom laminated busbars, optimize power distribution for demanding high-performance applications and systems.

The industry research and growth report includes detailed analyses of the competitive landscape of the market and information about key companies, including:

  • Amphenol Corp.
  • Electronic Systems Packaging LLC
  • EMS Elektro Metall GmbH
  • KINTO Electric Co. Ltd
  • Mersen Corporate Services SAS
  • Methode Electronics Inc.
  • Molex LLC
  • Raychem RPG Pvt. Ltd.
  • Rogers Corp.
  • Ryoden Kasei Co. Ltd.
  • Schneider Electric SE
  • Segue Electronics Inc.
  • Shenzhen Woer Techn Co.Ltd
  • Storm Power Components Co.
  • Sun King Technology Ltd.
  • Zhejiang RHI Co. Ltd.

Qualitative and quantitative analysis of companies has been conducted to help clients understand the wider business environment as well as the strengths and weaknesses of key industry players. Data is qualitatively analyzed to categorize companies as pure play, category-focused, industry-focused, and diversified; it is quantitatively analyzed to categorize companies as dominant, leading, strong, tentative, and weak.

Recent Development and News in Laminated busbar market

  • In August 2024, Molex LLC introduced a new series of high-density laminated busbars engineered to manage the extreme power loads and thermal challenges present in liquid-cooled data center server racks.
  • In September 2024, Siemens AG launched a new line of laminated busbars specifically designed for high-voltage applications, seeking to improve efficiency in renewable energy grid connections and industrial power systems.
  • In February 2025, Mersen announced a strategic investment of $20 million to increase its production capacity for laminated busbars, targeting growing demand from the electric vehicle and renewable energy markets.
  • In April 2025, Mersen Corporate Services SAS inaugurated a new production facility in Europe dedicated to laminated busbar manufacturing, aiming to double its output for the energy storage sector.

Dive into Technavio’s robust research methodology, blending expert interviews, extensive data synthesis, and validated models for unparalleled Laminated Busbar Market insights. See full methodology.

Market Scope
Page number 287
Base year 2025
Historic period 2020-2024
Forecast period 2026-2030
Growth momentum & CAGR Accelerate at a CAGR of 5.9%
Market growth 2026-2030 USD 343.5 million
Market structure Fragmented
YoY growth 2025-2026(%) 5.4%
Key countries Germany, UK, France, Italy, Spain, The Netherlands, China, Japan, India, South Korea, Australia, Indonesia, US, Canada, Mexico, Saudi Arabia, UAE, South Africa, Turkey, Israel, Brazil, Argentina and Colombia
Competitive landscape Leading Companies, Market Positioning of Companies, Competitive Strategies, and Industry Risks

Request Free Sample

Research Analyst Overview

  • The market for advanced electrical interconnect solutions is driven by the need for power density optimization and superior mechanical performance in increasingly demanding environments. Multilayer copper busbars, valued for their high electrical conductivity, are fundamental to modern power distribution systems.
  • A meticulous busbar lamination process using materials like polyethylene terephthalate (PET) and epoxy insulation ensures excellent dielectric material performance and electromagnetic interference (EMI) shielding. Boardroom decisions on R&D budgets are increasingly influenced by the transition to wide-bandgap semiconductors; adopting silicon carbide (SiC) devices and gallium nitride (GaN) devices necessitates a low inductance design for effective voltage spike mitigation.
  • This focus on engineering has led to designs that offer stray inductance reduction of up to 40% compared to traditional wiring. Effective thermal management solutions are critical for achieving heat dissipation improvement in high-voltage applications, especially around insulated gate bipolar transistors (IGBT).
  • The goal is to enhance power conversion efficiency and leverage the high current capacity and current carrying capability of busbars, all within a compact footprint. Success hinges on thermal conductivity enhancement to ensure reliability.

What are the Key Data Covered in this Laminated Busbar Market Research and Growth Report?

  • What is the expected growth of the Laminated Busbar Market between 2026 and 2030?

    • USD 343.5 million, at a CAGR of 5.9%

  • What segmentation does the market report cover?

    • The report is segmented by Material (Copper, Aluminium, and Others), Application (Power distribution, Energy storage systems, and Others), End-user (Utilities, Industrial, Commercial, and Others) and Geography (Europe, APAC, North America, Middle East and Africa, South America)

  • Which regions are analyzed in the report?

    • Europe, APAC, North America, Middle East and Africa and South America

  • What are the key growth drivers and market challenges?

    • Increasing use of laminated busbars in EVs, Volatility in copper prices

  • Who are the major players in the Laminated Busbar Market?

    • Amphenol Corp., Electronic Systems Packaging LLC, EMS Elektro Metall GmbH, KINTO Electric Co. Ltd, Mersen Corporate Services SAS, Methode Electronics Inc., Molex LLC, Raychem RPG Pvt. Ltd., Rogers Corp., Ryoden Kasei Co. Ltd., Schneider Electric SE, Segue Electronics Inc., Shenzhen Woer Techn Co.Ltd, Storm Power Components Co., Sun King Technology Ltd. and Zhejiang RHI Co. Ltd.

Market Research Insights

  • The market is shaped by demand for advanced power electronics solutions across multiple sectors. Grid modernization projects are driving adoption in smart grid infrastructure and high-voltage direct current (HVDC) systems, while renewable energy inverters and wind turbine converters require them for efficient power conditioning systems.
  • The automotive sector utilizes them in EV battery packs and automotive powertrain systems to enable vehicle miniaturization, often through custom busbar design and OEM engineering support. In industrial settings, they are found in industrial automation power and switchgear applications. Transport applications include railway traction converters and high-speed train power systems.
  • Efficient power module integration and low impedance interconnects are critical for data center power distribution and energy storage systems (ESS). Using advanced insulation materials for high-frequency switching improves electrical system reliability and can increase power transmission efficiency by over 5%, while modular busbar configurations reduce assembly time by 20%.

We can help! Our analysts can customize this laminated busbar market research report to meet your requirements.

Get in touch

1. Executive Summary

1.1 Market overview

Executive Summary - Chart on Market Overview
Executive Summary - Data Table on Market Overview
Executive Summary - Chart on Global Market Characteristics
Executive Summary - Chart on Market by Geography
Executive Summary - Chart on Market Segmentation by Material
Executive Summary - Chart on Market Segmentation by Application
Executive Summary - Chart on Market Segmentation by End-user
Executive Summary - Chart on Incremental Growth
Executive Summary - Data Table on Incremental Growth
Executive Summary - Chart on Company Market Positioning

2. Technavio Analysis

2.1 Analysis of price sensitivity, lifecycle, customer purchase basket, adoption rates, and purchase criteria

2.2 Criticality of inputs and Factors of differentiation

Chart on Overview on criticality of inputs and factors of differentiation

2.3 Factors of disruption

Chart on Overview on factors of disruption

2.4 Impact of drivers and challenges

Chart on Impact of drivers and challenges in 2025 and 2030

3. Market Landscape

3.1 Market ecosystem

Chart on Parent Market
Data Table on - Parent Market

3.2 Market characteristics

Chart on Market characteristics analysis

3.3 Value chain analysis

Chart on Value chain analysis

4. Market Sizing

4.1 Market definition

Data Table on Offerings of companies included in the market definition

4.2 Market segment analysis

Market segments

4.3 Market size 2025

4.4 Market outlook: Forecast for 2025-2030

Chart on Global - Market size and forecast 2025-2030 ($ million)
Data Table on Global - Market size and forecast 2025-2030 ($ million)
Chart on Global Market: Year-over-year growth 2025-2030 (%)
Data Table on Global Market: Year-over-year growth 2025-2030 (%)

5. Historic Market Size

5.1 Global Laminated Busbar Market 2020 - 2024

Historic Market Size - Data Table on Global Laminated Busbar Market 2020 - 2024 ($ million)

5.2 Material segment analysis 2020 - 2024

Historic Market Size - Material Segment 2020 - 2024 ($ million)

5.3 Application segment analysis 2020 - 2024

Historic Market Size - Application Segment 2020 - 2024 ($ million)

5.4 End-user segment analysis 2020 - 2024

Historic Market Size - End-user Segment 2020 - 2024 ($ million)

5.5 Geography segment analysis 2020 - 2024

Historic Market Size - Geography Segment 2020 - 2024 ($ million)

5.6 Country segment analysis 2020 - 2024

Historic Market Size - Country Segment 2020 - 2024 ($ million)

6. Qualitative Analysis

6.1 Impact of AI in global laminated busbar market

7. Five Forces Analysis

7.1 Five forces summary

Five forces analysis - Comparison between 2025 and 2030

7.2 Bargaining power of buyers

Bargaining power of buyers - Impact of key factors 2025 and 2030

7.3 Bargaining power of suppliers

Bargaining power of suppliers - Impact of key factors in 2025 and 2030

7.4 Threat of new entrants

Threat of new entrants - Impact of key factors in 2025 and 2030

7.5 Threat of substitutes

Threat of substitutes - Impact of key factors in 2025 and 2030

7.6 Threat of rivalry

Threat of rivalry - Impact of key factors in 2025 and 2030

7.7 Market condition

Chart on Market condition - Five forces 2025 and 2030

8. Market Segmentation by Material

8.1 Market segments

Chart on Material - Market share 2025-2030 (%)
Data Table on Material - Market share 2025-2030 (%)

8.2 Comparison by Material

Chart on Comparison by Material
Data Table on Comparison by Material

8.3 Copper - Market size and forecast 2025-2030

Chart on Copper - Market size and forecast 2025-2030 ($ million)
Data Table on Copper - Market size and forecast 2025-2030 ($ million)
Chart on Copper - Year-over-year growth 2025-2030 (%)
Data Table on Copper - Year-over-year growth 2025-2030 (%)

8.4 Aluminium - Market size and forecast 2025-2030

Chart on Aluminium - Market size and forecast 2025-2030 ($ million)
Data Table on Aluminium - Market size and forecast 2025-2030 ($ million)
Chart on Aluminium - Year-over-year growth 2025-2030 (%)
Data Table on Aluminium - Year-over-year growth 2025-2030 (%)

8.5 Others - Market size and forecast 2025-2030

Chart on Others - Market size and forecast 2025-2030 ($ million)
Data Table on Others - Market size and forecast 2025-2030 ($ million)
Chart on Others - Year-over-year growth 2025-2030 (%)
Data Table on Others - Year-over-year growth 2025-2030 (%)

8.6 Market opportunity by Material

Market opportunity by Material ($ million)
Data Table on Market opportunity by Material ($ million)

9. Market Segmentation by Application

9.1 Market segments

Chart on Application - Market share 2025-2030 (%)
Data Table on Application - Market share 2025-2030 (%)

9.2 Comparison by Application

Chart on Comparison by Application
Data Table on Comparison by Application

9.3 Power distribution - Market size and forecast 2025-2030

Chart on Power distribution - Market size and forecast 2025-2030 ($ million)
Data Table on Power distribution - Market size and forecast 2025-2030 ($ million)
Chart on Power distribution - Year-over-year growth 2025-2030 (%)
Data Table on Power distribution - Year-over-year growth 2025-2030 (%)

9.4 Energy storage systems - Market size and forecast 2025-2030

Chart on Energy storage systems - Market size and forecast 2025-2030 ($ million)
Data Table on Energy storage systems - Market size and forecast 2025-2030 ($ million)
Chart on Energy storage systems - Year-over-year growth 2025-2030 (%)
Data Table on Energy storage systems - Year-over-year growth 2025-2030 (%)

9.5 Others - Market size and forecast 2025-2030

Chart on Others - Market size and forecast 2025-2030 ($ million)
Data Table on Others - Market size and forecast 2025-2030 ($ million)
Chart on Others - Year-over-year growth 2025-2030 (%)
Data Table on Others - Year-over-year growth 2025-2030 (%)

9.6 Market opportunity by Application

Market opportunity by Application ($ million)
Data Table on Market opportunity by Application ($ million)

10. Market Segmentation by End-user

10.1 Market segments

Chart on End-user - Market share 2025-2030 (%)
Data Table on End-user - Market share 2025-2030 (%)

10.2 Comparison by End-user

Chart on Comparison by End-user
Data Table on Comparison by End-user

10.3 Utilities - Market size and forecast 2025-2030

Chart on Utilities - Market size and forecast 2025-2030 ($ million)
Data Table on Utilities - Market size and forecast 2025-2030 ($ million)
Chart on Utilities - Year-over-year growth 2025-2030 (%)
Data Table on Utilities - Year-over-year growth 2025-2030 (%)

10.4 Industrial - Market size and forecast 2025-2030

Chart on Industrial - Market size and forecast 2025-2030 ($ million)
Data Table on Industrial - Market size and forecast 2025-2030 ($ million)
Chart on Industrial - Year-over-year growth 2025-2030 (%)
Data Table on Industrial - Year-over-year growth 2025-2030 (%)

10.5 Commercial - Market size and forecast 2025-2030

Chart on Commercial - Market size and forecast 2025-2030 ($ million)
Data Table on Commercial - Market size and forecast 2025-2030 ($ million)
Chart on Commercial - Year-over-year growth 2025-2030 (%)
Data Table on Commercial - Year-over-year growth 2025-2030 (%)

10.6 Others - Market size and forecast 2025-2030

Chart on Others - Market size and forecast 2025-2030 ($ million)
Data Table on Others - Market size and forecast 2025-2030 ($ million)
Chart on Others - Year-over-year growth 2025-2030 (%)
Data Table on Others - Year-over-year growth 2025-2030 (%)

10.7 Market opportunity by End-user

Market opportunity by End-user ($ million)
Data Table on Market opportunity by End-user ($ million)

11. Customer Landscape

11.1 Customer landscape overview

Analysis of price sensitivity, lifecycle, customer purchase basket, adoption rates, and purchase criteria

12. Geographic Landscape

12.1 Geographic segmentation

Chart on Market share by geography 2025-2030 (%)
Data Table on Market share by geography 2025-2030 (%)

12.2 Geographic comparison

Chart on Geographic comparison
Data Table on Geographic comparison

12.3 Europe - Market size and forecast 2025-2030

Chart on Europe - Market size and forecast 2025-2030 ($ million)
Data Table on Europe - Market size and forecast 2025-2030 ($ million)
Chart on Europe - Year-over-year growth 2025-2030 (%)
Data Table on Europe - Year-over-year growth 2025-2030 (%)
Chart on Regional Comparison - Europe
Data Table on Regional Comparison - Europe

12.3.1 Germany - Market size and forecast 2025-2030

Chart on Germany - Market size and forecast 2025-2030 ($ million)
Data Table on Germany - Market size and forecast 2025-2030 ($ million)
Chart on Germany - Year-over-year growth 2025-2030 (%)
Data Table on Germany - Year-over-year growth 2025-2030 (%)

12.3.2 UK - Market size and forecast 2025-2030

Chart on UK - Market size and forecast 2025-2030 ($ million)
Data Table on UK - Market size and forecast 2025-2030 ($ million)
Chart on UK - Year-over-year growth 2025-2030 (%)
Data Table on UK - Year-over-year growth 2025-2030 (%)

12.3.3 France - Market size and forecast 2025-2030

Chart on France - Market size and forecast 2025-2030 ($ million)
Data Table on France - Market size and forecast 2025-2030 ($ million)
Chart on France - Year-over-year growth 2025-2030 (%)
Data Table on France - Year-over-year growth 2025-2030 (%)

12.3.4 Italy - Market size and forecast 2025-2030

Chart on Italy - Market size and forecast 2025-2030 ($ million)
Data Table on Italy - Market size and forecast 2025-2030 ($ million)
Chart on Italy - Year-over-year growth 2025-2030 (%)
Data Table on Italy - Year-over-year growth 2025-2030 (%)

12.3.5 Spain - Market size and forecast 2025-2030

Chart on Spain - Market size and forecast 2025-2030 ($ million)
Data Table on Spain - Market size and forecast 2025-2030 ($ million)
Chart on Spain - Year-over-year growth 2025-2030 (%)
Data Table on Spain - Year-over-year growth 2025-2030 (%)

12.3.6 The Netherlands - Market size and forecast 2025-2030

Chart on The Netherlands - Market size and forecast 2025-2030 ($ million)
Data Table on The Netherlands - Market size and forecast 2025-2030 ($ million)
Chart on The Netherlands - Year-over-year growth 2025-2030 (%)
Data Table on The Netherlands - Year-over-year growth 2025-2030 (%)

12.4 APAC - Market size and forecast 2025-2030

Chart on APAC - Market size and forecast 2025-2030 ($ million)
Data Table on APAC - Market size and forecast 2025-2030 ($ million)
Chart on APAC - Year-over-year growth 2025-2030 (%)
Data Table on APAC - Year-over-year growth 2025-2030 (%)
Chart on Regional Comparison - APAC
Data Table on Regional Comparison - APAC

12.4.1 China - Market size and forecast 2025-2030

Chart on China - Market size and forecast 2025-2030 ($ million)
Data Table on China - Market size and forecast 2025-2030 ($ million)
Chart on China - Year-over-year growth 2025-2030 (%)
Data Table on China - Year-over-year growth 2025-2030 (%)

12.4.2 Japan - Market size and forecast 2025-2030

Chart on Japan - Market size and forecast 2025-2030 ($ million)
Data Table on Japan - Market size and forecast 2025-2030 ($ million)
Chart on Japan - Year-over-year growth 2025-2030 (%)
Data Table on Japan - Year-over-year growth 2025-2030 (%)

12.4.3 India - Market size and forecast 2025-2030

Chart on India - Market size and forecast 2025-2030 ($ million)
Data Table on India - Market size and forecast 2025-2030 ($ million)
Chart on India - Year-over-year growth 2025-2030 (%)
Data Table on India - Year-over-year growth 2025-2030 (%)

12.4.4 South Korea - Market size and forecast 2025-2030

Chart on South Korea - Market size and forecast 2025-2030 ($ million)
Data Table on South Korea - Market size and forecast 2025-2030 ($ million)
Chart on South Korea - Year-over-year growth 2025-2030 (%)
Data Table on South Korea - Year-over-year growth 2025-2030 (%)

12.4.5 Australia - Market size and forecast 2025-2030

Chart on Australia - Market size and forecast 2025-2030 ($ million)
Data Table on Australia - Market size and forecast 2025-2030 ($ million)
Chart on Australia - Year-over-year growth 2025-2030 (%)
Data Table on Australia - Year-over-year growth 2025-2030 (%)

12.4.6 Indonesia - Market size and forecast 2025-2030

Chart on Indonesia - Market size and forecast 2025-2030 ($ million)
Data Table on Indonesia - Market size and forecast 2025-2030 ($ million)
Chart on Indonesia - Year-over-year growth 2025-2030 (%)
Data Table on Indonesia - Year-over-year growth 2025-2030 (%)

12.5 North America - Market size and forecast 2025-2030

Chart on North America - Market size and forecast 2025-2030 ($ million)
Data Table on North America - Market size and forecast 2025-2030 ($ million)
Chart on North America - Year-over-year growth 2025-2030 (%)
Data Table on North America - Year-over-year growth 2025-2030 (%)
Chart on Regional Comparison - North America
Data Table on Regional Comparison - North America

12.5.1 US - Market size and forecast 2025-2030

Chart on US - Market size and forecast 2025-2030 ($ million)
Data Table on US - Market size and forecast 2025-2030 ($ million)
Chart on US - Year-over-year growth 2025-2030 (%)
Data Table on US - Year-over-year growth 2025-2030 (%)

12.5.2 Canada - Market size and forecast 2025-2030

Chart on Canada - Market size and forecast 2025-2030 ($ million)
Data Table on Canada - Market size and forecast 2025-2030 ($ million)
Chart on Canada - Year-over-year growth 2025-2030 (%)
Data Table on Canada - Year-over-year growth 2025-2030 (%)

12.5.3 Mexico - Market size and forecast 2025-2030

Chart on Mexico - Market size and forecast 2025-2030 ($ million)
Data Table on Mexico - Market size and forecast 2025-2030 ($ million)
Chart on Mexico - Year-over-year growth 2025-2030 (%)
Data Table on Mexico - Year-over-year growth 2025-2030 (%)

12.6 Middle East and Africa - Market size and forecast 2025-2030

Chart on Middle East and Africa - Market size and forecast 2025-2030 ($ million)
Data Table on Middle East and Africa - Market size and forecast 2025-2030 ($ million)
Chart on Middle East and Africa - Year-over-year growth 2025-2030 (%)
Data Table on Middle East and Africa - Year-over-year growth 2025-2030 (%)
Chart on Regional Comparison - Middle East and Africa
Data Table on Regional Comparison - Middle East and Africa

12.6.1 Saudi Arabia - Market size and forecast 2025-2030

Chart on Saudi Arabia - Market size and forecast 2025-2030 ($ million)
Data Table on Saudi Arabia - Market size and forecast 2025-2030 ($ million)
Chart on Saudi Arabia - Year-over-year growth 2025-2030 (%)
Data Table on Saudi Arabia - Year-over-year growth 2025-2030 (%)

12.6.2 UAE - Market size and forecast 2025-2030

Chart on UAE - Market size and forecast 2025-2030 ($ million)
Data Table on UAE - Market size and forecast 2025-2030 ($ million)
Chart on UAE - Year-over-year growth 2025-2030 (%)
Data Table on UAE - Year-over-year growth 2025-2030 (%)

12.6.3 South Africa - Market size and forecast 2025-2030

Chart on South Africa - Market size and forecast 2025-2030 ($ million)
Data Table on South Africa - Market size and forecast 2025-2030 ($ million)
Chart on South Africa - Year-over-year growth 2025-2030 (%)
Data Table on South Africa - Year-over-year growth 2025-2030 (%)

12.6.4 Turkey - Market size and forecast 2025-2030

Chart on Turkey - Market size and forecast 2025-2030 ($ million)
Data Table on Turkey - Market size and forecast 2025-2030 ($ million)
Chart on Turkey - Year-over-year growth 2025-2030 (%)
Data Table on Turkey - Year-over-year growth 2025-2030 (%)

12.6.5 Israel - Market size and forecast 2025-2030

Chart on Israel - Market size and forecast 2025-2030 ($ million)
Data Table on Israel - Market size and forecast 2025-2030 ($ million)
Chart on Israel - Year-over-year growth 2025-2030 (%)
Data Table on Israel - Year-over-year growth 2025-2030 (%)

12.7 South America - Market size and forecast 2025-2030

Chart on South America - Market size and forecast 2025-2030 ($ million)
Data Table on South America - Market size and forecast 2025-2030 ($ million)
Chart on South America - Year-over-year growth 2025-2030 (%)
Data Table on South America - Year-over-year growth 2025-2030 (%)
Chart on Regional Comparison - South America
Data Table on Regional Comparison - South America

12.7.1 Brazil - Market size and forecast 2025-2030

Chart on Brazil - Market size and forecast 2025-2030 ($ million)
Data Table on Brazil - Market size and forecast 2025-2030 ($ million)
Chart on Brazil - Year-over-year growth 2025-2030 (%)
Data Table on Brazil - Year-over-year growth 2025-2030 (%)

12.7.2 Argentina - Market size and forecast 2025-2030

Chart on Argentina - Market size and forecast 2025-2030 ($ million)
Data Table on Argentina - Market size and forecast 2025-2030 ($ million)
Chart on Argentina - Year-over-year growth 2025-2030 (%)
Data Table on Argentina - Year-over-year growth 2025-2030 (%)

12.7.3 Colombia - Market size and forecast 2025-2030

Chart on Colombia - Market size and forecast 2025-2030 ($ million)
Data Table on Colombia - Market size and forecast 2025-2030 ($ million)
Chart on Colombia - Year-over-year growth 2025-2030 (%)
Data Table on Colombia - Year-over-year growth 2025-2030 (%)

12.8 Market opportunity by geography

Market opportunity by geography ($ million)
Data Tables on Market opportunity by geography ($ million)

13. Drivers, Challenges, and Opportunity

13.1 Market drivers

Increasing use of laminated busbars in EVs
Stringent energy efficiency regulations
Advantages of laminated busbars

13.2 Market challenges

Volatility in copper prices
Complex manufacturing processes in laminated busbars
Technical limitations of laminated busbars

13.3 Impact of drivers and challenges

Impact of drivers and challenges in 2025 and 2030

13.4 Market opportunities

Increasing adoption of renewable energy sources
Rising of newly launched laminated busbars
Expanding use of laminated busbars in electrical distribution systems

14. Competitive Landscape

14.1 Overview

14.2

Overview on criticality of inputs and factors of differentiation

14.3 Landscape disruption

Overview on factors of disruption

14.4 Industry risks

Impact of key risks on business

15. Competitive Analysis

15.1 Companies profiled

Companies covered

15.2 Company ranking index

15.3 Market positioning of companies

Matrix on companies position and classification

15.4 Amphenol Corp.

Amphenol Corp. - Overview
Amphenol Corp. - Business segments
Amphenol Corp. - Key news
Amphenol Corp. - Key offerings
Amphenol Corp. - Segment focus
SWOT

15.5 Electronic Systems Packaging LLC

Electronic Systems Packaging LLC - Overview
Electronic Systems Packaging LLC - Product / Service
Electronic Systems Packaging LLC - Key offerings
SWOT

15.6 EMS Elektro Metall GmbH

EMS Elektro Metall GmbH - Overview
EMS Elektro Metall GmbH - Product / Service
EMS Elektro Metall GmbH - Key offerings
SWOT

15.7 KINTO Electric Co. Ltd

KINTO Electric Co. Ltd - Overview
KINTO Electric Co. Ltd - Product / Service
KINTO Electric Co. Ltd - Key offerings
SWOT

15.8 Mersen Corporate Services SAS

Mersen Corporate Services SAS - Overview
Mersen Corporate Services SAS - Business segments
Mersen Corporate Services SAS - Key news
Mersen Corporate Services SAS - Key offerings
Mersen Corporate Services SAS - Segment focus
SWOT

15.9 Methode Electronics Inc.

Methode Electronics Inc. - Overview
Methode Electronics Inc. - Business segments
Methode Electronics Inc. - Key news
Methode Electronics Inc. - Key offerings
Methode Electronics Inc. - Segment focus
SWOT

15.10 Molex LLC

Molex LLC - Overview
Molex LLC - Product / Service
Molex LLC - Key offerings
SWOT

15.11 Raychem RPG Pvt. Ltd.

Raychem RPG Pvt. Ltd. - Overview
Raychem RPG Pvt. Ltd. - Product / Service
Raychem RPG Pvt. Ltd. - Key offerings
SWOT

15.12 Rogers Corp.

Rogers Corp. - Overview
Rogers Corp. - Business segments
Rogers Corp. - Key news
Rogers Corp. - Key offerings
Rogers Corp. - Segment focus
SWOT

15.13 Ryoden Kasei Co. Ltd.

Ryoden Kasei Co. Ltd. - Overview
Ryoden Kasei Co. Ltd. - Business segments
Ryoden Kasei Co. Ltd. - Key offerings
Ryoden Kasei Co. Ltd. - Segment focus
SWOT

15.14 Schneider Electric SE

Schneider Electric SE - Overview
Schneider Electric SE - Business segments
Schneider Electric SE - Key news
Schneider Electric SE - Key offerings
Schneider Electric SE - Segment focus
SWOT

15.15 Segue Electronics Inc.

Segue Electronics Inc. - Overview
Segue Electronics Inc. - Product / Service
Segue Electronics Inc. - Key offerings
SWOT

15.16 Shenzhen Woer Techn Co.Ltd

Shenzhen Woer Techn Co.Ltd - Overview
Shenzhen Woer Techn Co.Ltd - Product / Service
Shenzhen Woer Techn Co.Ltd - Key offerings
SWOT

15.17 Storm Power Components Co.

Storm Power Components Co. - Overview
Storm Power Components Co. - Product / Service
Storm Power Components Co. - Key offerings
SWOT

15.18 Sun King Technology Ltd.

Sun King Technology Ltd. - Overview
Sun King Technology Ltd. - Product / Service
Sun King Technology Ltd. - Key offerings
SWOT

16. Appendix

16.1 Scope of the report

Market definition
Objectives
Notes and caveats

16.2 Inclusions and exclusions checklist

Inclusions checklist
Exclusions checklist

16.3 Currency conversion rates for US$

16.4 Research methodology

16.5 Data procurement

Information sources

16.6 Data validation

16.7 Validation techniques employed for market sizing

16.8 Data synthesis

16.9 360 degree market analysis

16.10 List of abbreviations

Research Methodology

Technavio presents a detailed picture of the market by way of study, synthesis, and summation of data from multiple sources. The analysts have presented the various facets of the market with a particular focus on identifying the key industry influencers. The data thus presented is comprehensive, reliable, and the result of extensive research, both primary and secondary.

INFORMATION SOURCES

Primary sources

  • Manufacturers and suppliers
  • Channel partners
  • Industry experts
  • Strategic decision makers

Secondary sources

  • Industry journals and periodicals
  • Government data
  • Financial reports of key industry players
  • Historical data
  • Press releases

DATA ANALYSIS

Data Synthesis

  • Collation of data
  • Estimation of key figures
  • Analysis of derived insights

Data Validation

  • Triangulation with data models
  • Reference against proprietary databases
  • Corroboration with industry experts

REPORT WRITING

Qualitative

  • Market drivers
  • Market challenges
  • Market trends
  • Five forces analysis

Quantitative

  • Market size and forecast
  • Market segmentation
  • Geographical insights
  • Competitive landscape

Interested in this report?

Get your sample now to see our research methodology and insights!

Download Now

Frequently Asked Questions

Laminated Busbar market growth will increase by USD 343.5 million during 2026-2030 .

The Laminated Busbar market is expected to grow at a CAGR of 5.9% during 2026-2030 .

Laminated Busbar market is segmented by Material (Copper, Aluminium, Others) Application (Power distribution, Energy storage systems, Others) End-user (Utilities, Industrial, Commercial, Others)

Amphenol Corp., Electronic Systems Packaging LLC, EMS Elektro Metall GmbH, KINTO Electric Co. Ltd, Mersen Corporate Services SAS, Methode Electronics Inc., Molex LLC, Raychem RPG Pvt. Ltd., Rogers Corp., Ryoden Kasei Co. Ltd., Schneider Electric SE, Segue Electronics Inc., Shenzhen Woer Techn Co.Ltd, Storm Power Components Co., Sun King Technology Ltd., Zhejiang RHI Co. Ltd. are a few of the key vendors in the Laminated Busbar market.

APAC will register the highest growth rate of 33.5% among the other regions. Therefore, the Laminated Busbar market in APAC is expected to garner significant business opportunities for the vendors during the forecast period.

Germany, UK, France, Italy, Spain, The Netherlands, China, Japan, India, South Korea, Australia, Indonesia, US, Canada, Mexico, Saudi Arabia, UAE, South Africa, Turkey, Israel, Brazil, Argentina, Colombia

  • Increasing use of laminated busbars in EVs is the driving factor this market.

The Laminated Busbar market vendors should focus on grabbing business opportunities from the Material segment as it accounted for the largest market share in the base year.