Lanolin Market Analysis, Size, and Forecast 2025-2029: APAC (China, India, Japan, South Korea), North America (US and Canada), Europe (France, Germany, Italy, UK), South America , and Middle East and Africa

Lanolin Market Analysis, Size, and Forecast 2025-2029:
APAC (China, India, Japan, South Korea), North America (US and Canada), Europe (France, Germany, Italy, UK), South America , and Middle East and Africa

Published: Apr 2025 205 Pages SKU: IRTNTR80615

Market Overview at a Glance

$90.1 Mn
Market Opportunity
5%
CAGR
4.7
YoY growth 2024-2025(%)

Lanolin Market Size 2025-2029

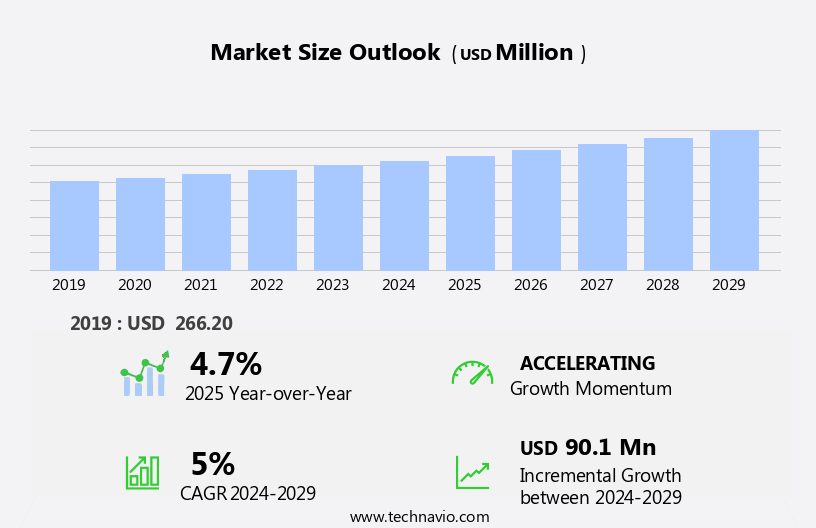
The lanolin market size is forecast to increase by USD 90.1 million at a CAGR of 5% between 2024 and 2029.

  • The market is experiencing significant growth driven by the rising demand for natural and sustainable ingredients in various industries, including cosmetics and pharmaceuticals. This trend is fueled by increasing consumer awareness and preference for eco-friendly skin care products. Additionally, customization and innovation in lanolin derivatives are creating new opportunities for market expansion. However, challenges persist in the form of availability and sourcing issues. Lanolin, derived from sheep's wool, is a natural substance that offers excellent emollient properties. Its ability to form a protective barrier on the skin makes it an ideal ingredient for various applications.
  • The market's strategic landscape is characterized by intense competition and constant innovation. Companies seeking to capitalize on market opportunities must focus on sustainable sourcing, product differentiation, and meeting evolving consumer demands. Navigating these challenges effectively requires a deep knowledge of market dynamics and a strategic approach to business and operational planning.

What will be the Size of the Lanolin Market during the forecast period?

Lanolin Market Size

 Request Free Sample

  • The market encompasses the production, processing, and distribution of lanolin and its derivatives, primarily used in various industries such as textiles, pharmaceuticals, cosmetics, and food. Lanolin, a natural wax derived from sheep's wool, offers unique properties including water retention, emollient effects, and skin protection. Market growth is driven by increasing demand for natural and sustainable alternatives to synthetic ingredients, as well as the expanding use of lanolin in diverse applications, including ointments, lotions, lip balms, and creams. Bio-based alternatives and certifications are gaining traction, while regulations and labeling requirements continue to shape market dynamics. Innovations in processing, manufacturing, and packaging technologies contribute to the market's growth, as does the development of lanolin-based pharmaceuticals and cosmetics.
  • The supply chain is characterized by a focus on sustainability and ethical sourcing, with a growing emphasis on refining and standardization to ensure product quality and consistency. Lanolin's versatile properties and expanding applications continue to fuel market growth, making it a dynamic and evolving industry worth monitoring for businesses and investors alike.

How is this Lanolin Industry segmented?

The lanolin industry research report provides comprehensive data (region-wise segment analysis), with forecasts and estimates in "USD million" for the period 2025-2029, as well as historical data from 2019-2023 for the following segments.
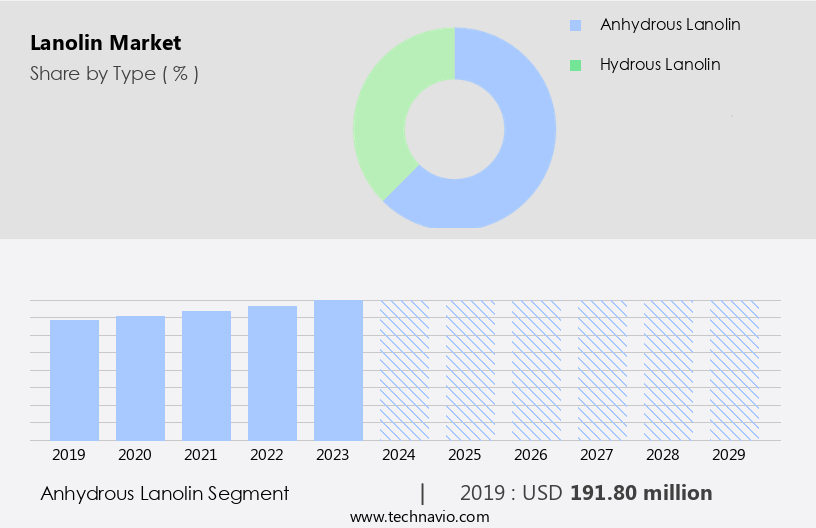
  • Type
    • Anhydrous lanolin
    • Hydrous lanolin
  • Application
    • Personal care and cosmetics
    • Baby care products
    • Pharmaceuticals
    • Industrial
  • Geography
    • APAC
      • China
      • India
      • Japan
      • South Korea
    • North America
      • US
      • Canada
    • Europe
      • France
      • Germany
      • Italy
      • UK
    • South America
    • Middle East and Africa

By Type Insights

The anhydrous lanolin segment is estimated to witness significant growth during the forecast period. Anhydrous lanolin, the pure form of lanolin with water content removed, is a thick, sticky, and highly concentrated substance. Ideal for applications demanding intense moisture retention, it is extensively used in the production of skin creams, lip balms, ointment bases, and haircare products. The high emollient content of anhydrous lanolin forms a protective barrier, locking in moisture and promoting hydration. In the medical sector, its ability to create a moisture-rich environment is beneficial for tissue repair, making it a crucial component in wound healing ointments. Synthetic lanolin, derived from plant sources, is a viable alternative for those with sheep farming concerns or ethical sensitivities.

Industrial lanolin, sourced ethically and sustainably, is used in various industries, including pharmaceuticals and cosmetics, for its versatile properties. Lanolin derivatives, such as lanolin wax, alcohol, and oil, are essential components in product formulation, offering advantages like improved texture, enhanced stability, and increased bioavailability. Hypoallergenic lanolin and vegan alternatives cater to consumer demand for safer, animal-friendly options. Safety standards and quality control are crucial in the production of lanolin and its derivatives. The environmental impact of lanolin sourcing and manufacturing is an ongoing concern, with a focus on reducing waste and minimizing the carbon footprint. Ingredient innovation continues to drive market growth, with the development of new lanolin-based products and delivery systems catering to diverse consumer needs and preferences. Consumer demand for natural ingredients, ethical sourcing, and sustainable practices shapes the future of the market.

Lanolin Market Size

Get a glance at the market report of share of various segments Request Free Sample

The Anhydrous lanolin segment was valued at USD 191.80 million in 2019 and showed a gradual increase during the forecast period.

Regional Analysis

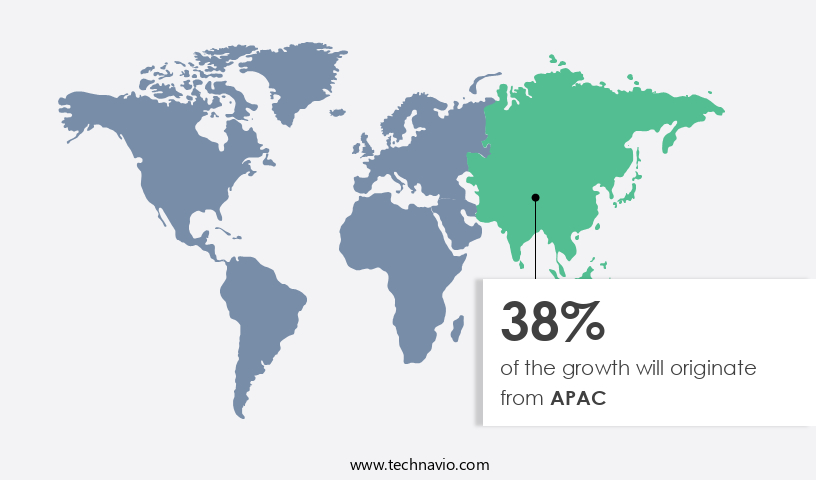
APAC is estimated to contribute 38% to the growth of the global market during the forecast period.Technavio's analysts have elaborately explained the regional trends and drivers that shape the market during the forecast period.

Lanolin Market Share by Geography

For more insights on the market size of various regions, Request Free Sample

The market in the Asia-Pacific (APAC) region is experiencing notable growth due to several economic and demographic factors. The expanding middle class in countries like China, projected to reach 1.2 billion by 2030, is a significant driver of this growth. Increased disposable income among consumers in this region has fueled a demand for high-quality personal care products, many of which incorporate lanolin. In addition, the pharmaceutical industry in the APAC region, expanding at an annual average rate of 9.3% since the start of the 14th Five-Year Plan, boosts the demand for lanolin, which is used in various medical and skincare applications.

Lanolin, derived from wool grease, is a versatile ingredient used in various industries, including wool processing, cosmetics, and pharmaceuticals. It is known for its ability to improve product formulation, enhance delivery systems, and provide hypoallergenic and sustainable sourcing benefits. Lanolin derivatives, such as lanolin alcohol and lanolin wax, are widely used in lip care, hair care, skin care, and wound healing products. Consumer demand for natural ingredients, ethical sourcing, and animal welfare has led to the development of bio-based lanolin and vegan alternatives. Safety standards and quality control are essential considerations in the production and use of lanolin, as it is used in a wide range of applications, from personal care products to industrial processes.

The market is characterized by product differentiation, with various brands offering unique value propositions, such as organic lanolin, hypoallergenic lanolin, and lanolin derived from sustainable sources. Lanolin's environmental impact and ingredient innovation are also key areas of focus for market participants. Overall, the APAC region's economic growth and changing consumer preferences are expected to continue driving the demand for lanolin in various industries.

Market Dynamics

Our researchers analyzed the data with 2024 as the base year, along with the key drivers, trends, and challenges. A holistic analysis of drivers will help companies refine their marketing strategies to gain a competitive advantage.

What are the key market drivers leading to the rise in the adoption of Lanolin Industry?

  • Rising demand for natural and sustainable ingredients is the key driver of the market. The personal care, pharmaceutical, and industrial sectors are experiencing growth due to the increasing demand for natural and sustainable ingredients. Consumers are becoming more conscious of the benefits of using eco-friendly, biodegradable, and chemical-free products. This trend is driven by concerns over synthetic additives, allergens, and the long-term health and environmental effects of chemical-based formulations. Aloe vera, sea salt, charcoal, coconut oil, shea butter, mango seed butter, cocoa seed butter, lanolin, jojoba seed oil, apricot kernel oil, beeswax, almond oil, and avocado oil are some of the natural components used in organic skincare.
  • As a result, ingredients like lanolin, shea butter, and plant-based oils are gaining popularity for their natural origin and proven efficacy. In the cosmetics and personal care industry, brands are prioritizing formulations with sustainably sourced ingredients to meet consumer preferences. This market dynamic is expected to continue as consumers increasingly prioritize natural and sustainable options.

What are the market trends shaping the Lanolin Industry?

  • Customization and innovation in lanolin derivatives are the upcoming market trend.  The market is witnessing significant advancements due to the customization and innovation in lanolin derivatives. Companies are focusing on meeting the unique requirements of various sectors, including personal care, pharmaceutical, and industrial, by creating refined and chemically modified lanolin derivatives. Lanolin esters, produced by reacting lanolin with fatty acids or alcohols, are a notable innovation. These esters offer enhanced benefits, such as improved texture, reduced greasiness, and better spreadability, making them valuable additions to skincare and cosmetic products.
  • The creation of these customized derivatives is essential for expanding the use of lanolin in diverse applications, particularly in high-end formulations. This trend underscores the importance of continuous research and development in the market. The Smart Home Appliances Market integrates lanolin creams, lanolin ointments, lanolin lotions, and lanolin lip balms to enhance user comfort. Lanolinbased cosmetics and lanolin in textiles contribute to sustainable home practices. Processes like lanolin extraction, lanolin refining, lanolin processing, lanolin standardization, lanolin certification, lanolin testing, and lanolin analysis ensure product quality and performance.StartFragment EndFragment

What challenges does the Lanolin Industry face during its growth?

  • Availability and sourcing issues is a key challenge affecting the industry growth. The market faces notable challenges related to availability and sourcing due to its connection to the wool industry. Lanolin, a byproduct of the wool cleaning process, is extracted when sheep wool is washed to remove impurities. Consequently, any variations in wool production can influence the availability of lanolin. Factors contributing to these fluctuations include sheep populations, weather conditions, and demand for wool.  Lanolin applications highlight versatility, while lanolin benefits and lanolin properties utility. Exploration of lanolin alternatives, synthetic lanolin alternatives, and biobased lanolin alternatives fosters innovation. Efficient lanolin supply chain, lanolin manufacturing, lanolin packaging, lanolin labeling, and lanolin distribution drive market accessibility.
  • Focus on lanolin marketing, lanolin sales, lanolin regulations, lanolin safety, and lanolin sustainability reflects responsibility. Lanolin innovations lead advancements in smart home technologies for enhanced living experiences. For example, a decline in wool production resulting from reduced farming or adverse weather conditions, such as droughts impacting grazing lands, can decrease the amount of lanolin available for extraction, potentially leading to supply shortages.

Exclusive Customer Landscape

The lanolin market forecasting report includes the adoption lifecycle of the market, covering from the innovator's stage to the laggard's stage. It focuses on adoption rates in different regions based on penetration. Furthermore, the lanolin market report also includes key purchase criteria and drivers of price sensitivity to help companies evaluate and develop their market growth analysis strategies.

Lanolin Market Share by Geography

 Customer Landscape

Key Companies & Market Insights

Companies are implementing various strategies, such as strategic alliances, lanolin market forecast, partnerships, mergers and acquisitions, geographical expansion, and product/service launches, to enhance their presence in the industry.

Barentz International BV - The company offers lanolin such as lanolin alcohol, which is used in personal care products like lotions, creams, hair pomades, shaving gels, and others.

The industry research and growth report includes detailed analyses of the competitive landscape of the market and information about key companies, including:

  • Barentz International BV
  • BOCSCI Inc.
  • CD Formulation
  • Esperis S.p.A.
  • Gustav Heess Oleochemische Erzeugnisse GmbH
  • Imperial-Oel-Import Handelsgesellschaft mbH
  • Koster Keunen
  • Lanotec
  • Merck KGaA
  • Nippon Fine Chemical Co Ltd.
  • NK CHEMICALS China Ltd.
  • Rolex Lanolin Products Ltd.
  • Shanghai PRET Composites Materials Co. Ltd.
  • Spectrum Laboratory Products Inc.
  • Suru Chemicals and Pharmaceuticals Pvt. Ltd.
  • The Lubrizol Corp.
  • Wellman Advanced Materials LLC
  • Xinyi Lanolin Co. ltd
  • Zhejiang Garden Biochemical Hightech Co. Ltd.

Qualitative and quantitative analysis of companies has been conducted to help clients understand the wider business environment as well as the strengths and weaknesses of key industry players. Data is qualitatively analyzed to categorize companies as pure play, category-focused, industry-focused, and diversified; it is quantitatively analyzed to categorize companies as dominant, leading, strong, tentative, and weak.

Research Analyst Overview

The market encompasses a range of products derived from the wool processing industry. Wool grease, a natural byproduct of this process, is the primary source of lanolin. Traditional lanolin is obtained from the wool of sheep, providing a rich source of bio-based materials for various industries. Synthetic lanolin, an alternative to traditional lanolin, has gained traction in recent years. This man-made substitute offers similar properties to natural lanolin, making it a viable option for industries seeking to reduce their reliance on animal-derived ingredients. Industrial lanolin finds applications in diverse sectors, including wound healing, where its emollient properties aid in the promotion of tissue regeneration.

In the cosmetic industry, lanolin is a popular ingredient in personal care products due to its ability to improve skin and hair condition. Brand loyalty and value proposition are crucial factors influencing consumer preferences in the market. Companies have responded by focusing on product formulation, safety standards, and ethical sourcing to differentiate themselves from competitors. The natural ingredients trend has led to an increase in demand for organic and sustainably sourced lanolin. Animal welfare and environmental impact are also becoming significant concerns, driving the adoption of sustainable sourcing practices. Lanolin derivatives, such as lanolin wax, alcohol, and oil, cater to various applications.

These derivatives offer unique properties, making them essential components in product formulation. Price sensitivity remains a key consideration in the market. Balancing cost and quality is a challenge for manufacturers, as they strive to meet consumer demands for affordable yet effective products. Innovation in ingredient development continues to drive growth in the market. Delivery systems and vegan alternatives are among the latest trends, catering to the evolving needs of consumers. Pharmaceutical applications of lanolin include its use as an excipient in drug formulations. Its ability to improve the efficacy and stability of active ingredients has made it an indispensable component in this sector.

As the demand for natural and sustainable ingredients continues to grow, the market is expected to experience steady expansion. Companies must focus on product differentiation, quality control, and consumer education to capitalize on this trend.

Market Scope

Report Coverage

Details

Page number

205

Base year

2024

Historic period

2019-2023

Forecast period

2025-2029

Growth momentum & CAGR

Accelerate at a CAGR of 5%

Market growth 2025-2029

USD 90.1 million

Market structure

Fragmented

YoY growth 2024-2025(%)

4.7

Key countries

US, China, India, UK, Germany, South Korea, Canada, France, Japan, and Italy

Competitive landscape

Leading Companies, Market Positioning of Companies, Competitive Strategies, and Industry Risks

Request Free Sample

What are the Key Data Covered in this Lanolin Market Research and Growth Report?

  • CAGR of the Lanolin industry during the forecast period
  • Detailed information on factors that will drive the growth and forecasting between 2025 and 2029
  • Precise estimation of the size of the market and its contribution of the industry in focus to the parent market
  • Accurate predictions about upcoming growth and trends and changes in consumer behaviour
  • Growth of the market across APAC, North America, Europe, South America, and Middle East and Africa
  • Thorough analysis of the market's competitive landscape and detailed information about companies
  • Comprehensive analysis of factors that will challenge the lanolin market growth of industry companies

We can help! Our analysts can customize this lanolin market research report to meet your requirements.

Get in touch

1 Executive Summary

  • 1.1 Market overview
    • Executive Summary - Chart on Market Overview
    • Executive Summary - Data Table on Market Overview
    • Executive Summary - Chart on Global Market Characteristics
    • Executive Summary - Chart on Market by Geography
    • Executive Summary - Chart on Market Segmentation by Type
    • Executive Summary - Chart on Market Segmentation by Application
    • Executive Summary - Chart on Incremental Growth
    • Executive Summary - Data Table on Incremental Growth
    • Executive Summary - Chart on Company Market Positioning

2 Technavio Analysis

  • 2.1 Analysis of price sensitivity, lifecycle, customer purchase basket, adoption rates, and purchase criteria
    • Analysis of price sensitivity, lifecycle, customer purchase basket, adoption rates, and purchase criteria
  • 2.2 Criticality of inputs and Factors of differentiation
    • Overview on criticality of inputs and factors of differentiation
  • 2.3 Factors of disruption
    • Overview on factors of disruption
  • 2.4 Impact of drivers and challenges
    • Impact of drivers and challenges in 2024 and 2029

3 Market Landscape

  • 3.1 Market ecosystem
    • Parent Market
    • Data Table on - Parent Market
  • 3.2 Market characteristics
    • Market characteristics analysis
  • 3.3 Value chain analysis
    • Value chain analysis

4 Market Sizing

  • 4.1 Market definition
    • Offerings of companies included in the market definition
  • 4.2 Market segment analysis
    • Market segments
  • 4.3 Market size 2024
    • 4.4 Market outlook: Forecast for 2024-2029
      • Chart on Global - Market size and forecast 2024-2029 ($ million)
      • Data Table on Global - Market size and forecast 2024-2029 ($ million)
      • Chart on Global Market: Year-over-year growth 2024-2029 (%)
      • Data Table on Global Market: Year-over-year growth 2024-2029 (%)

    5 Historic Market Size

    • 5.1 Global Lanolin Market 2019 - 2023
      • Historic Market Size - Data Table on Global Lanolin Market 2019 - 2023 ($ million)
    • 5.2 Type segment analysis 2019 - 2023
      • Historic Market Size - Type Segment 2019 - 2023 ($ million)
    • 5.3 Application segment analysis 2019 - 2023
      • Historic Market Size - Application Segment 2019 - 2023 ($ million)
    • 5.4 Geography segment analysis 2019 - 2023
      • Historic Market Size - Geography Segment 2019 - 2023 ($ million)
    • 5.5 Country segment analysis 2019 - 2023
      • Historic Market Size - Country Segment 2019 - 2023 ($ million)

    6 Qualitative Analysis

    • 6.1 AI Impact on Global Lanolin Market

      7 Five Forces Analysis

      • 7.1 Five forces summary
        • Five forces analysis - Comparison between 2024 and 2029
      • 7.2 Bargaining power of buyers
        • Bargaining power of buyers - Impact of key factors 2024 and 2029
      • 7.3 Bargaining power of suppliers
        • Bargaining power of suppliers - Impact of key factors in 2024 and 2029
      • 7.4 Threat of new entrants
        • Threat of new entrants - Impact of key factors in 2024 and 2029
      • 7.5 Threat of substitutes
        • Threat of substitutes - Impact of key factors in 2024 and 2029
      • 7.6 Threat of rivalry
        • Threat of rivalry - Impact of key factors in 2024 and 2029
      • 7.7 Market condition
        • Chart on Market condition - Five forces 2024 and 2029

      8 Market Segmentation by Type

      • 8.1 Market segments
        • Chart on Type - Market share 2024-2029 (%)
        • Data Table on Type - Market share 2024-2029 (%)
      • 8.2 Comparison by Type
        • Chart on Comparison by Type
        • Data Table on Comparison by Type
      • 8.3 Anhydrous lanolin - Market size and forecast 2024-2029
        • Chart on Anhydrous lanolin - Market size and forecast 2024-2029 ($ million)
        • Data Table on Anhydrous lanolin - Market size and forecast 2024-2029 ($ million)
        • Chart on Anhydrous lanolin - Year-over-year growth 2024-2029 (%)
        • Data Table on Anhydrous lanolin - Year-over-year growth 2024-2029 (%)
      • 8.4 Hydrous lanolin - Market size and forecast 2024-2029
        • Chart on Hydrous lanolin - Market size and forecast 2024-2029 ($ million)
        • Data Table on Hydrous lanolin - Market size and forecast 2024-2029 ($ million)
        • Chart on Hydrous lanolin - Year-over-year growth 2024-2029 (%)
        • Data Table on Hydrous lanolin - Year-over-year growth 2024-2029 (%)
      • 8.5 Market opportunity by Type
        • Market opportunity by Type ($ million)
        • Data Table on Market opportunity by Type ($ million)

      9 Market Segmentation by Application

      • 9.1 Market segments
        • Chart on Application - Market share 2024-2029 (%)
        • Data Table on Application - Market share 2024-2029 (%)
      • 9.2 Comparison by Application
        • Chart on Comparison by Application
        • Data Table on Comparison by Application
      • 9.3 Personal care and cosmetics - Market size and forecast 2024-2029
        • Chart on Personal care and cosmetics - Market size and forecast 2024-2029 ($ million)
        • Data Table on Personal care and cosmetics - Market size and forecast 2024-2029 ($ million)
        • Chart on Personal care and cosmetics - Year-over-year growth 2024-2029 (%)
        • Data Table on Personal care and cosmetics - Year-over-year growth 2024-2029 (%)
      • 9.4 Baby care products - Market size and forecast 2024-2029
        • Chart on Baby care products - Market size and forecast 2024-2029 ($ million)
        • Data Table on Baby care products - Market size and forecast 2024-2029 ($ million)
        • Chart on Baby care products - Year-over-year growth 2024-2029 (%)
        • Data Table on Baby care products - Year-over-year growth 2024-2029 (%)
      • 9.5 Pharmaceuticals - Market size and forecast 2024-2029
        • Chart on Pharmaceuticals - Market size and forecast 2024-2029 ($ million)
        • Data Table on Pharmaceuticals - Market size and forecast 2024-2029 ($ million)
        • Chart on Pharmaceuticals - Year-over-year growth 2024-2029 (%)
        • Data Table on Pharmaceuticals - Year-over-year growth 2024-2029 (%)
      • 9.6 Industrial - Market size and forecast 2024-2029
        • Chart on Industrial - Market size and forecast 2024-2029 ($ million)
        • Data Table on Industrial - Market size and forecast 2024-2029 ($ million)
        • Chart on Industrial - Year-over-year growth 2024-2029 (%)
        • Data Table on Industrial - Year-over-year growth 2024-2029 (%)
      • 9.7 Market opportunity by Application
        • Market opportunity by Application ($ million)
        • Data Table on Market opportunity by Application ($ million)

      10 Customer Landscape

      • 10.1 Customer landscape overview
        • Analysis of price sensitivity, lifecycle, customer purchase basket, adoption rates, and purchase criteria

      11 Geographic Landscape

      • 11.1 Geographic segmentation
        • Chart on Market share by geography 2024-2029 (%)
        • Data Table on Market share by geography 2024-2029 (%)
      • 11.2 Geographic comparison
        • Chart on Geographic comparison
        • Data Table on Geographic comparison
      • 11.3 APAC - Market size and forecast 2024-2029
        • Chart on APAC - Market size and forecast 2024-2029 ($ million)
        • Data Table on APAC - Market size and forecast 2024-2029 ($ million)
        • Chart on APAC - Year-over-year growth 2024-2029 (%)
        • Data Table on APAC - Year-over-year growth 2024-2029 (%)
      • 11.4 North America - Market size and forecast 2024-2029
        • Chart on North America - Market size and forecast 2024-2029 ($ million)
        • Data Table on North America - Market size and forecast 2024-2029 ($ million)
        • Chart on North America - Year-over-year growth 2024-2029 (%)
        • Data Table on North America - Year-over-year growth 2024-2029 (%)
      • 11.5 Europe - Market size and forecast 2024-2029
        • Chart on Europe - Market size and forecast 2024-2029 ($ million)
        • Data Table on Europe - Market size and forecast 2024-2029 ($ million)
        • Chart on Europe - Year-over-year growth 2024-2029 (%)
        • Data Table on Europe - Year-over-year growth 2024-2029 (%)
      • 11.6 South America - Market size and forecast 2024-2029
        • Chart on South America - Market size and forecast 2024-2029 ($ million)
        • Data Table on South America - Market size and forecast 2024-2029 ($ million)
        • Chart on South America - Year-over-year growth 2024-2029 (%)
        • Data Table on South America - Year-over-year growth 2024-2029 (%)
      • 11.7 Middle East and Africa - Market size and forecast 2024-2029
        • Chart on Middle East and Africa - Market size and forecast 2024-2029 ($ million)
        • Data Table on Middle East and Africa - Market size and forecast 2024-2029 ($ million)
        • Chart on Middle East and Africa - Year-over-year growth 2024-2029 (%)
        • Data Table on Middle East and Africa - Year-over-year growth 2024-2029 (%)
      • 11.8 US - Market size and forecast 2024-2029
        • Chart on US - Market size and forecast 2024-2029 ($ million)
        • Data Table on US - Market size and forecast 2024-2029 ($ million)
        • Chart on US - Year-over-year growth 2024-2029 (%)
        • Data Table on US - Year-over-year growth 2024-2029 (%)
      • 11.9 China - Market size and forecast 2024-2029
        • Chart on China - Market size and forecast 2024-2029 ($ million)
        • Data Table on China - Market size and forecast 2024-2029 ($ million)
        • Chart on China - Year-over-year growth 2024-2029 (%)
        • Data Table on China - Year-over-year growth 2024-2029 (%)
      • 11.10 India - Market size and forecast 2024-2029
        • Chart on India - Market size and forecast 2024-2029 ($ million)
        • Data Table on India - Market size and forecast 2024-2029 ($ million)
        • Chart on India - Year-over-year growth 2024-2029 (%)
        • Data Table on India - Year-over-year growth 2024-2029 (%)
      • 11.11 UK - Market size and forecast 2024-2029
        • Chart on UK - Market size and forecast 2024-2029 ($ million)
        • Data Table on UK - Market size and forecast 2024-2029 ($ million)
        • Chart on UK - Year-over-year growth 2024-2029 (%)
        • Data Table on UK - Year-over-year growth 2024-2029 (%)
      • 11.12 Germany - Market size and forecast 2024-2029
        • Chart on Germany - Market size and forecast 2024-2029 ($ million)
        • Data Table on Germany - Market size and forecast 2024-2029 ($ million)
        • Chart on Germany - Year-over-year growth 2024-2029 (%)
        • Data Table on Germany - Year-over-year growth 2024-2029 (%)
      • 11.13 South Korea - Market size and forecast 2024-2029
        • Chart on South Korea - Market size and forecast 2024-2029 ($ million)
        • Data Table on South Korea - Market size and forecast 2024-2029 ($ million)
        • Chart on South Korea - Year-over-year growth 2024-2029 (%)
        • Data Table on South Korea - Year-over-year growth 2024-2029 (%)
      • 11.14 Canada - Market size and forecast 2024-2029
        • Chart on Canada - Market size and forecast 2024-2029 ($ million)
        • Data Table on Canada - Market size and forecast 2024-2029 ($ million)
        • Chart on Canada - Year-over-year growth 2024-2029 (%)
        • Data Table on Canada - Year-over-year growth 2024-2029 (%)
      • 11.15 France - Market size and forecast 2024-2029
        • Chart on France - Market size and forecast 2024-2029 ($ million)
        • Data Table on France - Market size and forecast 2024-2029 ($ million)
        • Chart on France - Year-over-year growth 2024-2029 (%)
        • Data Table on France - Year-over-year growth 2024-2029 (%)
      • 11.16 Japan - Market size and forecast 2024-2029
        • Chart on Japan - Market size and forecast 2024-2029 ($ million)
        • Data Table on Japan - Market size and forecast 2024-2029 ($ million)
        • Chart on Japan - Year-over-year growth 2024-2029 (%)
        • Data Table on Japan - Year-over-year growth 2024-2029 (%)
      • 11.17 Italy - Market size and forecast 2024-2029
        • Chart on Italy - Market size and forecast 2024-2029 ($ million)
        • Data Table on Italy - Market size and forecast 2024-2029 ($ million)
        • Chart on Italy - Year-over-year growth 2024-2029 (%)
        • Data Table on Italy - Year-over-year growth 2024-2029 (%)
      • 11.18 Market opportunity by geography
        • Market opportunity by geography ($ million)
        • Data Tables on Market opportunity by geography ($ million)

      12 Drivers, Challenges, and Opportunity/Restraints

      • 12.1 Market drivers
        • 12.2 Market challenges
          • 12.3 Impact of drivers and challenges
            • Impact of drivers and challenges in 2024 and 2029
          • 12.4 Market opportunities/restraints

            13 Competitive Landscape

            • 13.1 Overview
              • 13.2 Competitive Landscape
                • Overview on criticality of inputs and factors of differentiation
              • 13.3 Landscape disruption
                • Overview on factors of disruption
              • 13.4 Industry risks
                • Impact of key risks on business

              14 Competitive Analysis

              • 14.1 Companies profiled
                • Companies covered
              • 14.2 Company ranking index
                • Company ranking index
              • 14.3 Market positioning of companies
                • Matrix on companies position and classification
              • 14.4 Barentz International BV
                • Barentz International BV - Overview
                • Barentz International BV - Product / Service
                • Barentz International BV - Key offerings
                • SWOT
              • 14.5 BOCSCI Inc.
                • BOCSCI Inc. - Overview
                • BOCSCI Inc. - Product / Service
                • BOCSCI Inc. - Key offerings
                • SWOT
              • 14.6 Esperis S.p.A.
                • Esperis S.p.A. - Overview
                • Esperis S.p.A. - Product / Service
                • Esperis S.p.A. - Key offerings
                • SWOT
              • 14.7 Gustav Heess Oleochemische Erzeugnisse GmbH
                • Gustav Heess Oleochemische Erzeugnisse GmbH - Overview
                • Gustav Heess Oleochemische Erzeugnisse GmbH - Product / Service
                • Gustav Heess Oleochemische Erzeugnisse GmbH - Key offerings
                • SWOT
              • 14.8 Imperial-Oel-Import Handelsgesellschaft mbH
                • Imperial-Oel-Import Handelsgesellschaft mbH - Overview
                • Imperial-Oel-Import Handelsgesellschaft mbH - Product / Service
                • Imperial-Oel-Import Handelsgesellschaft mbH - Key offerings
                • SWOT
              • 14.9 Lanotec
                • Lanotec - Overview
                • Lanotec - Product / Service
                • Lanotec - Key offerings
                • SWOT
              • 14.10 Merck KGaA
                • Merck KGaA - Overview
                • Merck KGaA - Product / Service
                • Merck KGaA - Key offerings
                • SWOT
              • 14.11 Nippon Fine Chemical Co Ltd.
                • Nippon Fine Chemical Co Ltd. - Overview
                • Nippon Fine Chemical Co Ltd. - Product / Service
                • Nippon Fine Chemical Co Ltd. - Key offerings
                • SWOT
              • 14.12 NK CHEMICALS CHINA Ltd.
                • NK CHEMICALS CHINA Ltd. - Overview
                • NK CHEMICALS CHINA Ltd. - Product / Service
                • NK CHEMICALS CHINA Ltd. - Key offerings
                • SWOT
              • 14.13 Rolex Lanolin Products Ltd.
                • Rolex Lanolin Products Ltd. - Overview
                • Rolex Lanolin Products Ltd. - Product / Service
                • Rolex Lanolin Products Ltd. - Key offerings
                • SWOT
              • 14.14 Shanghai PRET Composites Materials Co. Ltd.
                • Shanghai PRET Composites Materials Co. Ltd. - Overview
                • Shanghai PRET Composites Materials Co. Ltd. - Product / Service
                • Shanghai PRET Composites Materials Co. Ltd. - Key offerings
                • SWOT
              • 14.15 Suru Chemicals and Pharmaceuticals Pvt. Ltd.
                • Suru Chemicals and Pharmaceuticals Pvt. Ltd. - Overview
                • Suru Chemicals and Pharmaceuticals Pvt. Ltd. - Product / Service
                • Suru Chemicals and Pharmaceuticals Pvt. Ltd. - Key offerings
                • SWOT
              • 14.16 The Lubrizol Corp.
                • The Lubrizol Corp. - Overview
                • The Lubrizol Corp. - Product / Service
                • The Lubrizol Corp. - Key offerings
                • SWOT
              • 14.17 Wellman Advanced Materials LLC
                • Wellman Advanced Materials LLC - Overview
                • Wellman Advanced Materials LLC - Product / Service
                • Wellman Advanced Materials LLC - Key offerings
                • SWOT
              • 14.18 Zhejiang Garden Biochemical Hightech Co. Ltd.
                • Zhejiang Garden Biochemical Hightech Co. Ltd. - Overview
                • Zhejiang Garden Biochemical Hightech Co. Ltd. - Product / Service
                • Zhejiang Garden Biochemical Hightech Co. Ltd. - Key offerings
                • SWOT

              15 Appendix

              • 15.1 Scope of the report
                • 15.2 Inclusions and exclusions checklist
                  • Inclusions checklist
                  • Exclusions checklist
                • 15.3 Currency conversion rates for US$
                  • Currency conversion rates for US$
                • 15.4 Research methodology
                  • Research methodology
                • 15.5 Data procurement
                  • Information sources
                • 15.6 Data validation
                  • Data validation
                • 15.7 Validation techniques employed for market sizing
                  • Validation techniques employed for market sizing
                • 15.8 Data synthesis
                  • Data synthesis
                • 15.9 360 degree market analysis
                  • 360 degree market analysis
                • 15.10 List of abbreviations
                  • List of abbreviations

                Research Methodology

                Technavio presents a detailed picture of the market by way of study, synthesis, and summation of data from multiple sources. The analysts have presented the various facets of the market with a particular focus on identifying the key industry influencers. The data thus presented is comprehensive, reliable, and the result of extensive research, both primary and secondary.

                INFORMATION SOURCES

                Primary sources

                • Manufacturers and suppliers
                • Channel partners
                • Industry experts
                • Strategic decision makers

                Secondary sources

                • Industry journals and periodicals
                • Government data
                • Financial reports of key industry players
                • Historical data
                • Press releases

                DATA ANALYSIS

                Data Synthesis

                • Collation of data
                • Estimation of key figures
                • Analysis of derived insights

                Data Validation

                • Triangulation with data models
                • Reference against proprietary databases
                • Corroboration with industry experts

                REPORT WRITING

                Qualitative

                • Market drivers
                • Market challenges
                • Market trends
                • Five forces analysis

                Quantitative

                • Market size and forecast
                • Market segmentation
                • Geographical insights
                • Competitive landscape

                Interested in this report?

                Get your sample now to see our research methodology and insights!

                Download Now

                Frequently Asked Questions

                Lanolin market growth will increase by $ 90.1 mn during 2025-2029.

                The Lanolin market is expected to grow at a CAGR of 5% during 2025-2029.

                Lanolin market is segmented by Type( Anhydrous lanolin, Hydrous lanolin) Application( Personal care and cosmetics, Baby care products, Pharmaceuticals, Industrial)

                Barentz International BV, BOCSCI Inc., CD Formulation, Esperis S.p.A., Gustav Heess Oleochemische Erzeugnisse GmbH, Imperial-Oel-Import Handelsgesellschaft mbH, Koster Keunen, Lanotec, Merck KGaA, Nippon Fine Chemical Co Ltd., NK CHEMICALS CHINA Ltd., Rolex Lanolin Products Ltd., Shanghai PRET Composites Materials Co. Ltd., Spectrum Laboratory Products Inc., Suru Chemicals and Pharmaceuticals Pvt. Ltd., The Lubrizol Corp., Wellman Advanced Materials LLC, Xinyi Lanolin Co. ltd, Zhejiang Garden Biochemical Hightech Co. Ltd. are a few of the key vendors in the Lanolin market.

                APAC will register the highest growth rate of 38% among the other regions. Therefore, the Lanolin market in APAC is expected to garner significant business opportunities for the vendors during the forecast period.

                US, China, India, UK, Germany, South Korea, Canada, France, Japan, Italy

                • Rising demand for natural and sustainable ingredientsThe rising demand for natural and sustainable ingredients is a key driver of growth in various industries is the driving factor this market.
                • particularly in personal care is the driving factor this market.
                • pharmaceuticals is the driving factor this market.
                • and industrial applications. Consumers are becoming increasingly aware of the benefits of using natural products is the driving factor this market.
                • preferring ingredients that are eco-friendly is the driving factor this market.
                • biodegradable is the driving factor this market.
                • and free from harsh chemicals. This shift is driven by growing concerns about synthetic additives is the driving factor this market.
                • allergens is the driving factor this market.
                • and the long-term effects of chemical-based formulations on health and the environment. As a result is the driving factor this market.
                • ingredients like lanolin is the driving factor this market.
                • shea butter is the driving factor this market.
                • and plant-based oils are gaining popularity due to their natural origin and proven efficacy. In the cosmetics and personal care sector is the driving factor this market.
                • brands are focusing on formulating products with sustainably sourced ingredients. Lanolin is the driving factor this market.
                • a natural emollient derived from wool of the sheep is the driving factor this market.
                • is widely used in moisturizers is the driving factor this market.
                • lip balms is the driving factor this market.
                • and anti-aging creams due to its ability to retain moisture is the driving factor this market.
                • protect the skin barrier is the driving factor this market.
                • and enhance hydration. Consumers seeking clean beauty and organic skincare products are driving the demand for lanolin-based formulations. Additionally is the driving factor this market.
                • companies are incorporating ethical sourcing and cruelty-free certifications to align with consumer expectations. The pharmaceutical industry is also witnessing a shift towards natural ingredients is the driving factor this market.
                • particularly for topical formulations. Lanolin is a key ingredient in medical ointments is the driving factor this market.
                • nipple creams for breastfeeding mothers is the driving factor this market.
                • and baby skincare products is the driving factor this market.
                • as it provides soothing is the driving factor this market.
                • healing is the driving factor this market.
                • and protective benefits. As awareness of hypoallergenic and dermatologically safe ingredients grows is the driving factor this market.
                • demand for refined and ultra-pure lanolin is increasing. Beyond personal care is the driving factor this market.
                • the industrial sector is adopting sustainable ingredients in lubricants is the driving factor this market.
                • rust preventatives is the driving factor this market.
                • and leather conditioning agents. Manufacturers are focusing on eco-friendly formulations to reduce reliance on petroleum-based alternatives. With the global sustainability movement gaining momentum is the driving factor this market.
                • the demand for natural and renewable ingredients like lanolin is expected to rise is the driving factor this market.
                • shaping future market trends. is the driving factor this market.

                The Lanolin market vendors should focus on grabbing business opportunities from the Anhydrous lanolin segment as it accounted for the largest market share in the base year.