Brazil Last Mile Delivery Market Size 2026-2030
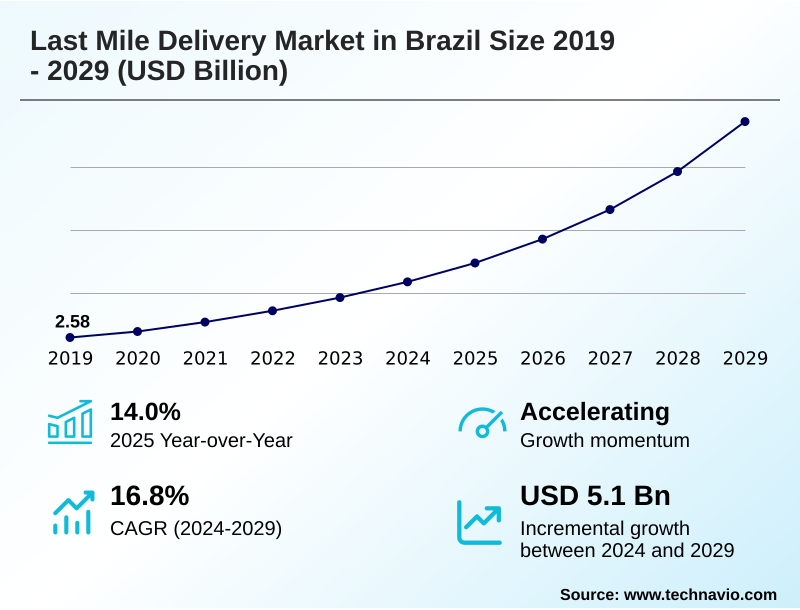
The Brazil Last Mile Delivery Market size was valued at USD 4.95 billion in 2025, growing at a CAGR of 15.6% during the forecast period 2026-2030.
Major Market Trends & Insights
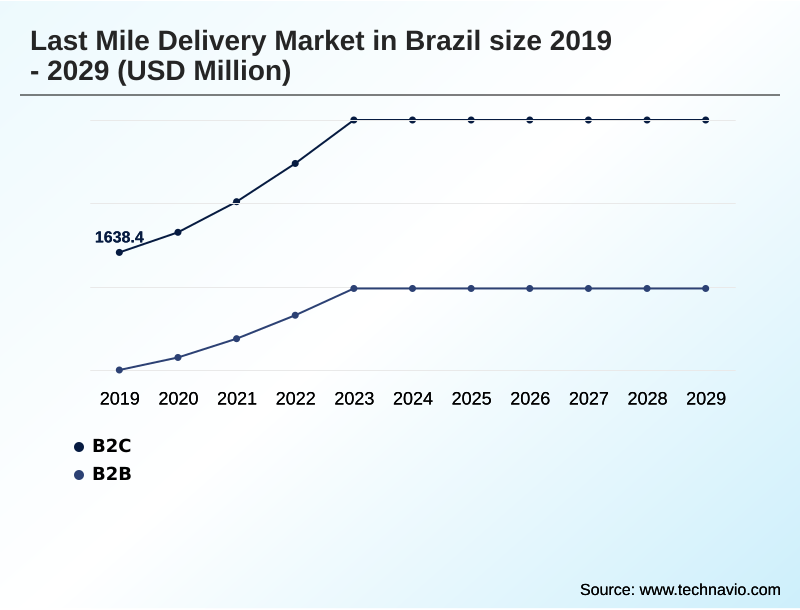
- By Service - B2C segment was valued at USD 2.73 billion in 2024
- By End-user - E-commerce segment accounted for the largest market revenue share in 2024
Market Size & Forecast
- Historic Market Opportunities 2020-2024: USD 7.46 billion
- Market Future Opportunities 2025-2030: USD 5.28 billion
- CAGR from 2025 to 2030 : 15.6%
Market Summary
- The last mile delivery market in Brazil is characterized by intense competition and rapid innovation, with providers processing over 500 million parcels annually through e-commerce channels alone. Service providers are increasingly adopting advanced technologies, with a 30% rise in the use of AI-driven route optimization to navigate urban congestion and improve delivery times.
- A primary driver is the explosive growth of online retail, which necessitates scalable fulfillment networks to meet consumer expectations for speed and convenience. For example, a company might deploy a hybrid model combining a centralized warehouse with smaller, localized micro-fulfillment centers to ensure next-day delivery promises are met.
- However, the market faces significant challenges from severe infrastructure deficiencies and high operational costs, which can erode profit margins by up to 15% and complicate expansion into less-developed regions. Balancing technological investment with cost management remains a critical operational focus.
What will be the Size of the Brazil Last Mile Delivery Market during the forecast period?
Get Key Insights on Market Forecast (PDF) Request Free Sample
How is the Brazil Last Mile Delivery Market Segmented?
The brazil last mile delivery industry research report provides comprehensive data (region-wise segment analysis), with forecasts and analysis for the period 2026-2030, as well as historical data from 2020-2024 for the following segments.
- Service
- B2C
- B2B
- End-user
- E-commerce
- Food and groceries delivery
- Pharmaceuticals
- Others
- Technology
- Autonomous vehicles
- Non-autonomous vehicles
- Drones
- Geography
- South America
- Brazil
- South America
How is the Brazil Last Mile Delivery Market Segmented by Service?
The b2c segment is estimated to witness significant growth during the forecast period.
The B2C segment, which commands over 60% of delivery volumes, is defined by consumer demand for rapid and transparent fulfillment. This has led to a 25% increase in the adoption of hyperlocal delivery services in major urban centers.
B2C parcel delivery necessitates a focus on customer delivery experience and first-attempt delivery success, contrasting sharply with scheduled B2B logistics fulfillment. The operational shift toward micro-fulfillment centers and dark store operations optimizes inventory placement strategy, reducing transit times.
Consequently, on-demand delivery platforms are leveraging dynamic routing software and predictive delivery analytics to manage peak-season logistics planning and enhance reverse logistics management, which is critical for customer retention in the competitive e-commerce landscape.
This segment's growth directly influences investment in final mile logistics infrastructure.
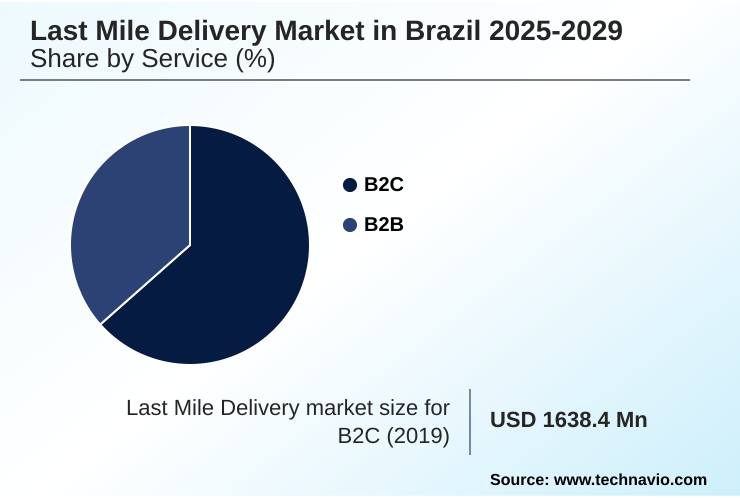
The B2C segment was valued at USD 2.73 billion in 2024 and showed a gradual increase during the forecast period.
What are the key Drivers, Trends, and Challenges in the Brazil Last Mile Delivery Market?
Our researchers analyzed the data with 2025 as the base year, along with the key drivers, trends, and challenges. A holistic analysis of drivers will help companies refine their marketing strategies to gain a competitive advantage.
- Navigating the last mile delivery market in Brazil 2026-2030 requires a nuanced understanding of its distinct operational hurdles and opportunities. A key concern for many operators is the last mile delivery challenges in urban areas, where traffic congestion can increase delivery times by up to 40% during peak hours, severely impacting efficiency.
- Consequently, businesses are exploring how improving last mile delivery efficiency with technology can provide a competitive edge. This includes adopting AI-powered route planning tools and real-time tracking systems to mitigate delays. The cost of last mile delivery for e-commerce remains a critical factor, often representing more than half of total shipping expenses.
- To address this, companies are implementing sustainable last mile delivery solutions, such as electric vehicles and consolidated delivery routes, which can lower fuel costs by 20% and appeal to environmentally conscious consumers. Furthermore, understanding B2B vs B2C last mile delivery differences is crucial.
- B2B shipments often involve bulk goods and scheduled appointments, requiring different vehicle types and service level agreements compared to the high-volume, on-demand nature of B2C parcel delivery. Successfully managing these variables is essential for sustainable growth and profitability in this dynamic market.
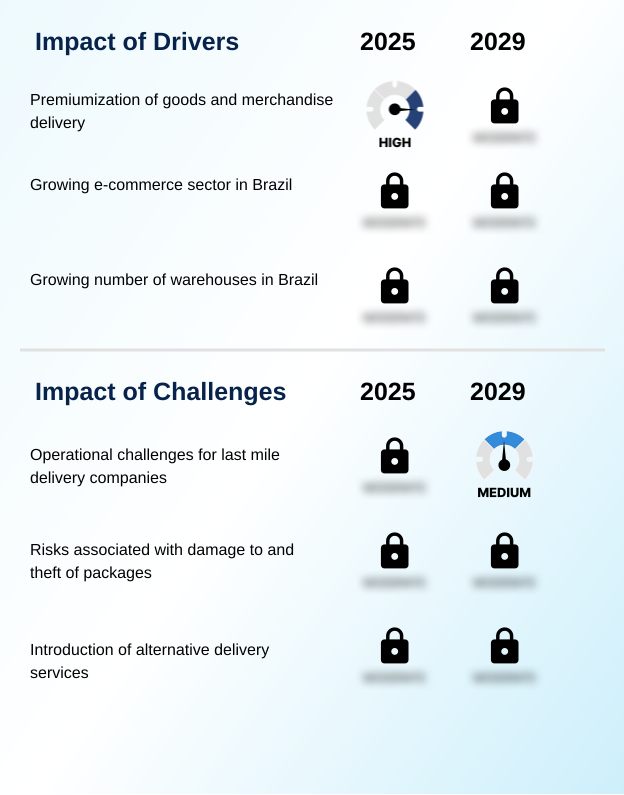
What are the key market drivers leading to the rise in the adoption of Brazil Last Mile Delivery Industry?
- The rapid expansion of e-commerce is a primary driver for the market, creating substantial demand for scalable and efficient fulfillment services.
- Increasing consumer demand for faster and more flexible fulfillment is a primary driver, compelling companies to innovate their final mile logistics.
- This has led to a 25% increase in the adoption of scheduled delivery windows and contactless delivery options over the last two years.
- The pressure to meet these expectations forces investment in technologies that support time-definite services and enhance real-time shipment visibility.
- As a result, businesses are re-evaluating their inventory placement strategy to position goods closer to customers, which can reduce average delivery distances by 30%.
- This consumer-centric push directly fuels the expansion of fulfillment network density in urban and suburban areas, making last mile carrier integration a critical component for achieving competitive differentiation and ensuring customer satisfaction.
What are the market trends shaping the Brazil Last Mile Delivery Industry?
- The rise of quick commerce and hyperlocal models, which cater to consumer demand for immediate fulfillment, represents a significant market trend.
- The adoption of autonomous delivery robots and delivery drone technology is reshaping urban logistics, with pilot programs demonstrating a potential 40% reduction in delivery times for hyperlocal delivery services in congested city centers. This shift is driven by the need to overcome ground-level traffic and reduce operational costs associated with conventional delivery methods.
- The integration of advanced technologies allows for more precise and efficient fulfillment from dark store operations, directly improving the customer experience. Consequently, businesses are increasingly investing in these asset-light models to achieve faster turnaround times, especially for high-value or time-sensitive goods.
- The use of autonomous solutions also helps mitigate labor shortages and supports 24/7 operations, providing a scalable solution for peak demand periods, with some systems showing a 99% accuracy rate in package handling.
What challenges does the Brazil Last Mile Delivery Industry face during its growth?
- High operational costs and persistent economic pressures present a key challenge, impacting the profitability and growth of the industry.
- High operational costs, exacerbated by fuel price volatility and labor expenses, remain a significant challenge, with last mile operations often accounting for over 50% of total shipping costs. This financial pressure is intensified by infrastructure deficiencies, which can increase transit times by up to 35% in major metropolitan areas and hinder the efficiency of both B2C and B2B logistics fulfillment.
- To mitigate these issues, companies are focused on shipping cost optimization and improving returns processing efficiency. However, the complexity of urban logistics solutions and the need for continuous investment in technology create a difficult balancing act.
- Failure to manage these costs effectively can directly impact profitability and limit the ability of providers to offer competitive pricing in a highly price-sensitive market.
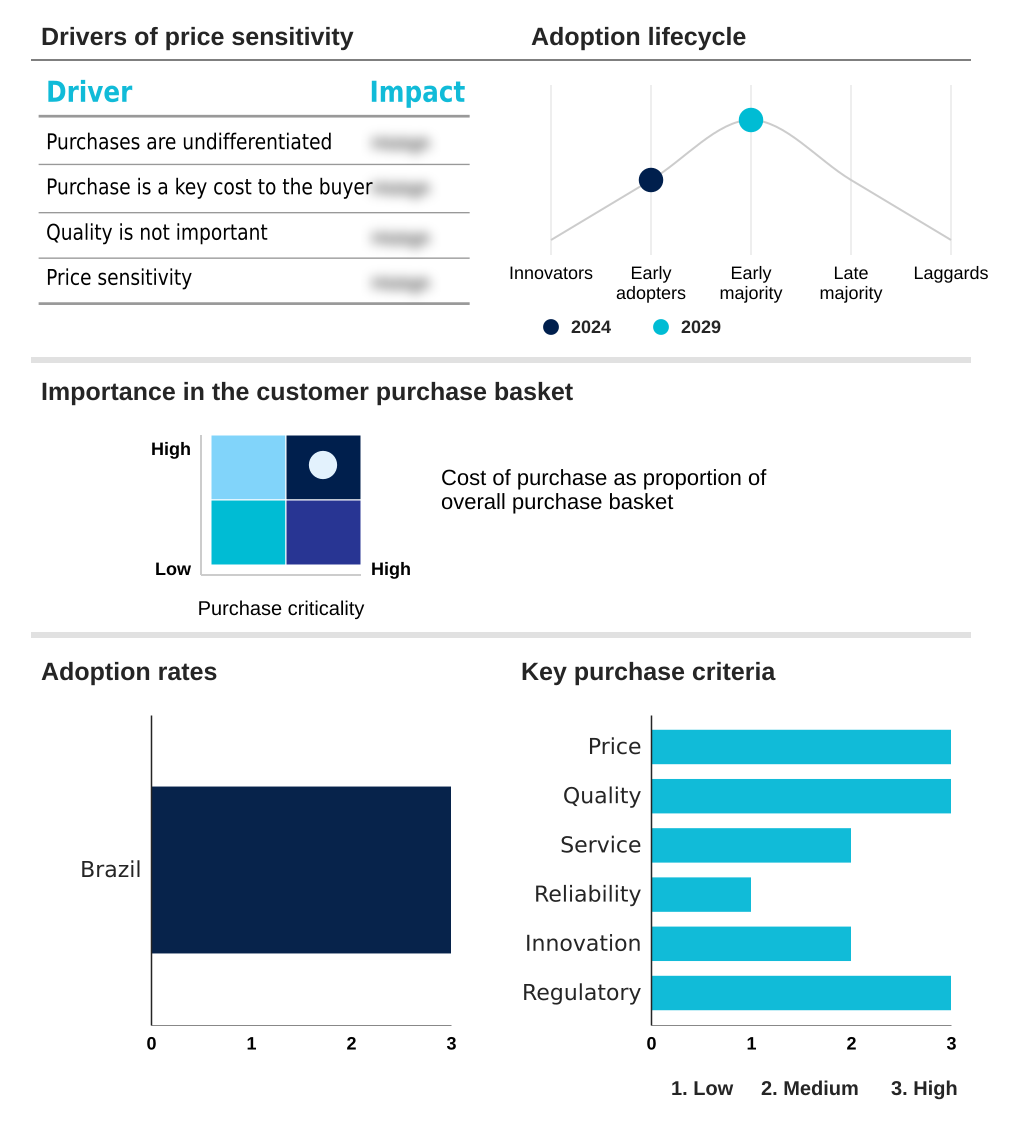
Exclusive Technavio Analysis on Customer Landscape
The brazil last mile delivery market forecasting report includes the adoption lifecycle of the market, covering from the innovator’s stage to the laggard’s stage. It focuses on adoption rates in different regions based on penetration. Furthermore, the brazil last mile delivery market report also includes key purchase criteria and drivers of price sensitivity to help companies evaluate and develop their market growth analysis strategies.
Customer Landscape of Brazil Last Mile Delivery Industry
Competitive Landscape
Companies are implementing various strategies, such as strategic alliances, brazil last mile delivery market forecast, partnerships, mergers and acquisitions, geographical expansion, and product/service launches, to enhance their presence in the industry.
CMA CGM Group - The company offers dedicated last mile delivery through integrated ground transportation, enabling final leg distribution from regional hubs to various customer facilities across key domestic markets.
The industry research and growth report includes detailed analyses of the competitive landscape of the market and information about key companies, including:
- CMA CGM Group
- Deutsche Bahn AG
- DHL International GmbH
- DSV AS
- FarEye Technologies Inc.
- FedEx Corp.
- FM Logistic
- FreightAmigo
- J.B. Hunt Transport Services
- Kuehne Nagel Management AG
- Nippon Express Holdings Inc.
- SNCF Group
- SPX Technologies Inc.
- United Parcel Service Inc.
- Werner Enterprises Inc.
- XPO Inc.
Qualitative and quantitative analysis of companies has been conducted to help clients understand the wider business environment as well as the strengths and weaknesses of key industry players. Data is qualitatively analyzed to categorize companies as pure play, category-focused, industry-focused, and diversified; it is quantitatively analyzed to categorize companies as dominant, leading, strong, tentative, and weak.
Market Intelligence Radar: High-Impact Developments & Growth Signals
- In the Air Freight and Logistics industry, the increased adoption of digital freight booking platforms has streamlined cargo management, directly impacting the last mile delivery market in Brazil 2026-2030 by improving supply chain traceability and enabling more efficient handoffs from air to ground transport. This integration improves delivery orchestration for time-sensitive goods.
- A growing emphasis on sustainable logistics practices within the global air cargo sector, including mandates for lower-emission aircraft and carbon offsetting, is creating downstream pressure on last mile delivery providers to invest in electric vehicle (EV) fleets and optimize routes to align with corporate ESG goals. This has led to a 15% rise in green logistics investments.
- The expansion of cross-border e-commerce, driven by trade facilitation agreements in the Air Freight and Logistics industry, has substantially increased international parcel volumes. This directly fuels demand for efficient final mile logistics and customs clearance capabilities to handle the surge in inbound shipments from international hubs to local consumers.
- Technological advancements in automated cargo handling and sorting systems at airports are reducing ground processing times by up to 30%. This development enhances the efficiency of the entire supply chain, allowing last mile carriers to receive parcels faster and improve the reliability of time-definite services for customers.
Dive into Technavio’s robust research methodology, blending expert interviews, extensive data synthesis, and validated models for unparalleled Brazil Last Mile Delivery Market insights. See full methodology.
| Market Scope | |
|---|---|
| Page number | 186 |
| Base year | 2025 |
| Historic period | 2020-2024 |
| Forecast period | 2026-2030 |
| Growth momentum & CAGR | Accelerate at a CAGR of 15.6% |
| Market growth 2026-2030 | USD 5279.6 million |
| Market structure | Fragmented |
| YoY growth 2025-2026(%) | 14.5% |
| Key countries | Brazil |
| Competitive landscape | Leading Companies, Market Positioning of Companies, Competitive Strategies, and Industry Risks |
Research Analyst Overview
- The ecosystem of the last mile delivery market in Brazil involves a complex interplay of stakeholders, with technology providers offering dynamic routing software that improves fleet efficiency by over 20%. Logistics operators, from global corporations to gig economy platforms, form the core of the market, leveraging these tools to manage their delivery networks.
- Their operations are supported by vehicle manufacturers and infrastructure companies that supply electric vehicle (EV) fleets and charging stations. A critical part of the value chain includes end-users, primarily in the e-commerce and food delivery sectors, whose demand for speed and convenience drives innovation.
- Regulatory bodies also play a significant role, shaping labor laws for crowdsourced delivery networks and setting emissions standards. The integration between on-demand delivery platforms and retail warehouse management systems (WMS) has become essential, with seamless API connections reducing order processing times by an average of 15%, thereby enhancing the overall customer experience.
What are the Key Data Covered in this Brazil Last Mile Delivery Market Research and Growth Report?
-
What is the expected growth of the Brazil Last Mile Delivery Market between 2026 and 2030?
-
The Brazil Last Mile Delivery Market is expected to grow by USD 5.28 billion during 2026-2030, registering a CAGR of 15.6%. Year-over-year growth in 2026 is estimated at 14.5%%. This acceleration is shaped by rapid expansion of e-commerce, which is intensifying demand across multiple end-use verticals covered in the report.
-
-
What segmentation does the market report cover?
-
The report is segmented by Service (B2C, and B2B), End-user (E-commerce, Food and groceries delivery, Pharmaceuticals, and Others), Technology (Autonomous vehicles, Non-autonomous vehicles, and Drones) and Geography (South America). Among these, the B2C segment is estimated to witness significant growth during the forecast period, driven by rising adoption across key application areas. Each segment includes detailed qualitative and quantitative analysis, along with historical data from 2020-2024 and forecasts through 2030 with year-over-year growth rates.
-
-
Which regions are analyzed in the report?
-
The report covers South America. Country-level analysis includes Brazil, with dedicated market size tables and year-over-year growth for each.
-
-
What are the key growth drivers and market challenges?
-
The primary driver is rapid expansion of e-commerce, which is accelerating investment and industry demand. The main challenge is high operational costs and economic pressures, creating operational barriers for key market participants. The report quantifies the impact of each driver and challenge across 2026 and 2030 with comparative analysis.
-
-
Who are the major players in the Brazil Last Mile Delivery Market?
-
Key vendors include CMA CGM Group, Deutsche Bahn AG, DHL International GmbH, DSV AS, FarEye Technologies Inc., FedEx Corp., FM Logistic, FreightAmigo, J.B. Hunt Transport Services, Kuehne Nagel Management AG, Nippon Express Holdings Inc., SNCF Group, SPX Technologies Inc., United Parcel Service Inc., Werner Enterprises Inc. and XPO Inc.. The report provides qualitative and quantitative analysis categorizing companies as dominant, leading, strong, tentative, and weak based on their market positioning. Company profiles include business segment analysis, SWOT assessment, key offerings, and recent strategic developments.
-
Market Research Insights
- The competitive landscape features a 15% year-over-year increase in network expansion investments from key players. Global logistics giants like DHL and FedEx are intensifying their focus on Brazil, competing with local powerhouses such as Mercado Libre and iFood.
- These companies are actively enhancing their capabilities through strategic initiatives; for instance, recent activities show a clear trend toward acquiring local logistics firms to gain market share and investing in automated sorting systems, which have been shown to boost throughput by over 40%.
- This push for technological integration is a direct response to the need for greater efficiency in urban logistics solutions. These actions are driven by the unrelenting consumer demand for faster and cheaper deliveries. However, companies must navigate the persistent challenge of high operational costs and complex labor regulations while scaling their operations.
We can help! Our analysts can customize this brazil last mile delivery market research report to meet your requirements.
 RIA -
RIA - 
