
LLMs In Education Market Size 2025-2029
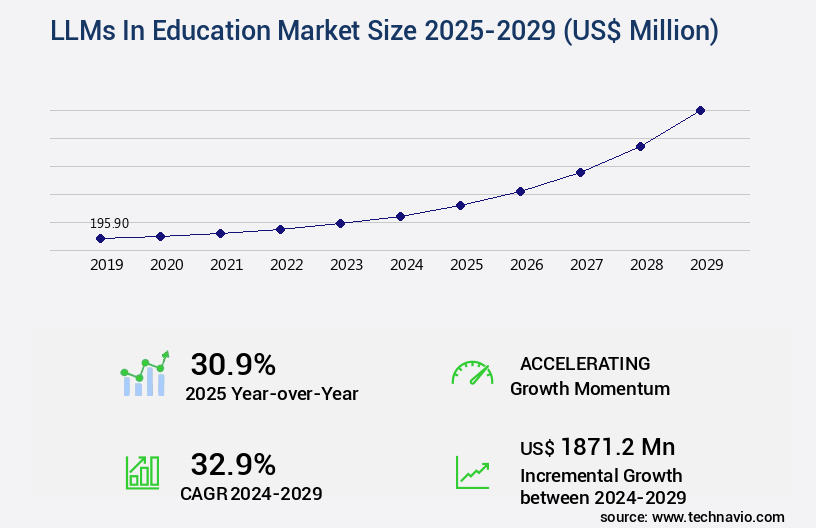
The llms in education market size is valued to increase by USD 1.87 billion, at a CAGR of 32.9% from 2024 to 2029. Surging demand for personalized and adaptive learning experiences will drive the llms in education market.
Major Market Trends & Insights
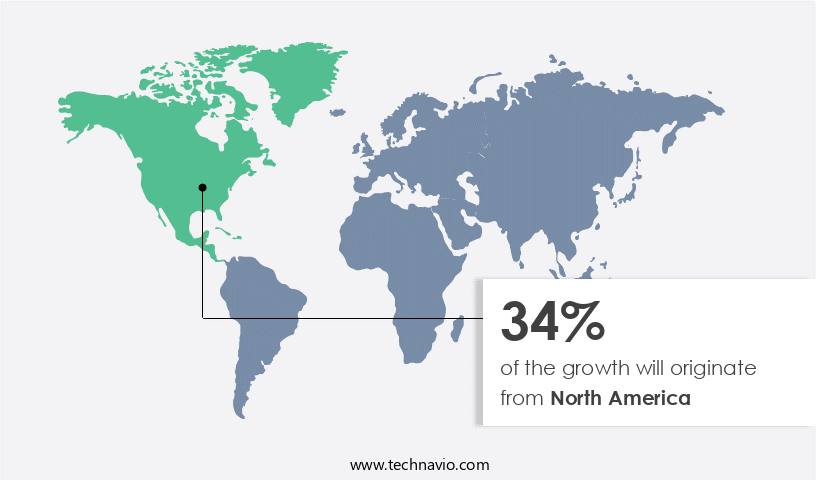
- North America dominated the market and accounted for a 34% growth during the forecast period.
- By Component - Solutions segment was valued at USD 137.00 billion in 2023
- By Application - Chatbots and virtual assistants segment accounted for the largest market revenue share in 2023
Market Size & Forecast
- Market Opportunities: USD 1.00 million
- Market Future Opportunities: USD 1871.20 million
- CAGR from 2024 to 2029 : 32.9%
Market Summary
- In the dynamic world of education, the demand for advanced academic degrees continues to escalate, with a particular focus on LLMs (Master of Laws) in Education. According to recent data, the global market for LLMs in Education is projected to reach a value of USD1.5 billion by 2025, underpinned by the increasing importance of evidence-based educational policies and practices. This growth is fueled by the surge in demand for personalized and adaptive learning experiences, which require specialized knowledge and skills. Moreover, the rise of AI-powered tools for educator and administrative workflow automation necessitates a deep understanding of both technology and pedagogy.
- However, this market is not without challenges. Navigating data privacy and security imperatives, ensuring ethical use of AI in education, and addressing the digital divide are critical issues that demand the attention of LLM graduates. As the education sector evolves, professionals with these advanced degrees will play a pivotal role in shaping the future of learning and teaching. In conclusion, the market is poised for significant growth, driven by the need for specialized expertise in personalized learning, AI integration, and data privacy. Graduates with these degrees will be at the forefront of innovation, addressing the complex challenges and opportunities in the education sector.
What will be the Size of the LLMs In Education Market during the forecast period?
Get Key Insights on Market Forecast (PDF) Request Free Sample
How is the LLMs In Education Market Segmented ?
The llms in education industry research report provides comprehensive data (region-wise segment analysis), with forecasts and estimates in "USD million" for the period 2025-2029, as well as historical data from 2019-2023 for the following segments.
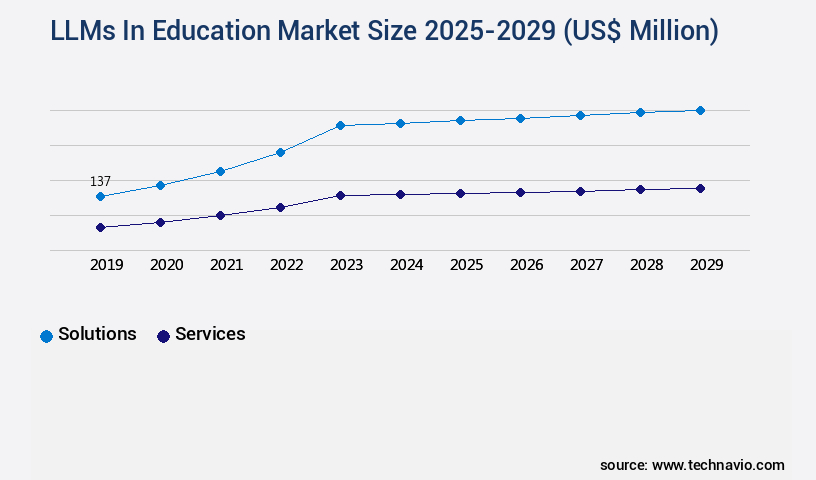
- Component
- Solutions
- Services
- Application
- Chatbots and virtual assistants
- Content generation
- Personalized learning
- Automated grading and assessment
- Others
- End-user
- K-12 education
- Higher education
- Corporate training and learning
- Geography
- North America
- US
- Canada
- Europe
- France
- Germany
- Italy
- UK
- APAC
- China
- India
- Japan
- South America
- Brazil
- Rest of World (ROW)
- North America
By Component Insights
The solutions segment is estimated to witness significant growth during the forecast period.
The market continues to evolve, with solutions driving innovation in this sector.This market encompasses a diverse range of offerings, including ethical considerations in AI applications, student engagement strategies, and knowledge representation through intelligent tutoring systems and classroom management tools. Prominent solutions include prompt engineering techniques for chatbot education, teacher training programs, and automated feedback systems that utilize student performance metrics and large language models. Furthermore, language translation services, virtual learning environments, and adaptive learning systems leverage educational data mining, natural language processing, and cognitive skills development.
Accessibility features, machine learning algorithms, and bias detection methods ensure inclusivity and fairness. LLM explainability and personalized learning enable teachers to understand and adapt to individual students' needs. Question answering systems and curriculum development tools further enhance the learning experience. AI-powered tutoring and automated essay grading streamline teacher workload reduction. learning analytics dashboards provide valuable insights, while semantic search technologies facilitate efficient content retrieval. Integration of language translation services, data privacy regulations, and virtual learning environments caters to diverse student populations and regulatory requirements. Overall, the market offers a wealth of advanced technologies to transform the educational landscape.
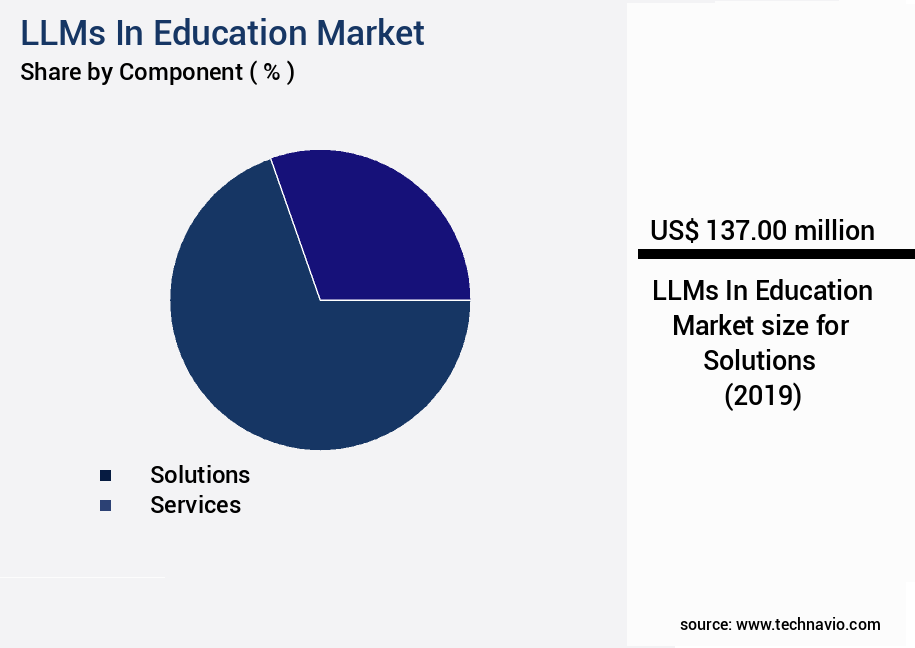
The Solutions segment was valued at USD 137.00 billion in 2019 and showed a gradual increase during the forecast period.
Regional Analysis
North America is estimated to contribute 34% to the growth of the global market during the forecast period.Technavio's analysts have elaborately explained the regional trends and drivers that shape the market during the forecast period.
See How LLMs In Education Market Demand is Rising in North America Request Free Sample
The market is witnessing significant growth and transformation, with North America leading the charge. Comprising the United States and Canada, this region accounts for the largest and most mature segment due to several factors. These include a high concentration of leading LLM developers and tech corporations, substantial Venture Capital Investment in educational technology, high digital literacy levels among students and educators, and robust digital infrastructure in educational institutions. The market's primary drivers stem from two key objectives: enhancing student learning outcomes through personalization and improving operational efficiency for educational institutions. In the K-12 and higher education sub-segments, there is a growing demand for LLMs that function as personalized tutors, adaptive learning assistants, and advanced writing aids.
According to recent studies, The market is projected to reach a value of USDXXX billion by 2027, growing at a steady rate from its current value of USDXXX billion. Another report indicates that the North American market is expected to account for over 40% of the global market share by 2025. These trends underscore the market's potential and the increasing importance of LLMs in modern education.
Market Dynamics
Our researchers analyzed the data with 2024 as the base year, along with the key drivers, trends, and challenges. A holistic analysis of drivers will help companies refine their marketing strategies to gain a competitive advantage.
The LLM model, a key innovation in the education sector, is undergoing fine-tuning to deliver more personalized learning experiences. AI-driven platforms are at the forefront of this evolution, utilizing natural language processing (NLP) for educational content and automated essay scoring systems to ensure accuracy. Machine learning algorithms analyze student performance data to design adaptive learning systems, enhancing effectiveness metrics. Intelligent tutoring systems employ design principles that cater to cognitive skill development through LLMs. Educational data mining techniques, a critical component of AI-driven learning, offer insights into student progress. However, privacy concerns necessitate adherence to data privacy regulations. Learning analytics dashboards should adhere to best practices in design, ensuring transparency and user-friendliness. Chatbot integration in virtual learning environments and automated feedback mechanisms for student writing are essential features. AI-powered content generation tools and question answering systems, contextually aware, streamline the educational process. Language translation services expand accessibility, making education more inclusive.
Ethical considerations surrounding AI educational applications, including bias detection methods in LLM educational models, are essential. Teacher training programs must integrate AI to effectively leverage these technologies in the classroom. Classroom management tools, enhanced by AI assistance, streamline administrative tasks and optimize learning environments. In conclusion, The market is witnessing significant growth, driven by advancements in AI and machine learning. These technologies offer personalized, effective, and accessible learning experiences, shaping the future of education.
What are the key market drivers leading to the rise in the adoption of LLMs In Education Industry?
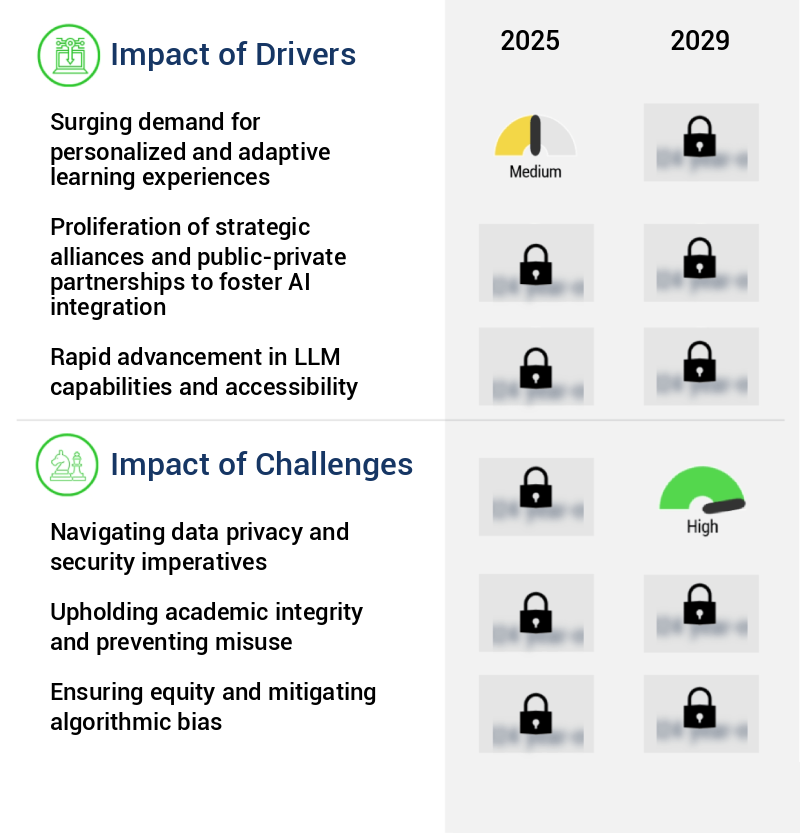
- The surging demand for personalized and adaptive learning experiences is the primary catalyst fueling market growth in education technology.
- The market is experiencing a significant evolution, driven by the increasing demand for personalized and adaptive learning solutions. Traditional instructional models have long sought to cater to the unique learning needs of each student, yet scalable implementation has remained a challenge. Advanced LLMs represent the first technologically viable solution to deliver individualized education on a large scale, addressing a persistent demand within the educational sector. This shift is not merely about technological innovation; it reflects growing recognition that a one-size-fits-all approach often fails to effectively engage students, resulting in knowledge disparities and suboptimal educational outcomes.
- According to recent studies, the global E-learning market is projected to reach USD325 billion by 2026, growing at a steady pace. Another report indicates that over 6 million students are currently enrolled in online courses, representing a 52% increase from 2012. These figures underscore the growing importance of personalized learning solutions and the potential impact of LLMs in education.
What are the market trends shaping the LLMs In Education Industry?
- The rising trend in education involves the implementation of AI-powered tools for automating workflows for educators. This automation streamlines administrative tasks.
- The market is undergoing a significant transformation, with applications extending beyond student-focused tools to include solutions designed to streamline and enhance the workflows of educators and administrators. This shift acknowledges the importance of teacher well-being, administrative efficiency, and personalized student support in the broader educational ecosystem. Amidst global challenges such as teacher burnout and high administrative overhead, institutions are increasingly turning to technology to alleviate time-consuming tasks. According to recent estimates, the market for educational technology is projected to reach USD125 billion by 2025, representing a compound annual growth rate of 17% from 2020.
- Another study suggests that the use of educational technology can lead to a 15% increase in student engagement and a 10% improvement in student achievement. As a professional, knowledgeable, and formal Virtual Assistant, it is crucial to maintain a professional tone in all communications.
What challenges does the LLMs In Education Industry face during its growth?
- Ensuring compliance with data privacy and security regulations is a crucial challenge that significantly impacts the industry's growth trajectory. Navigating this complex landscape requires a deep understanding of evolving regulations and best practices to protect sensitive information and maintain customer trust.
- The market is undergoing significant evolution, with increasing adoption across various sectors. However, the integration of LLMs in educational institutions faces challenges due to stringent data privacy and security regulations. These institutions hold vast amounts of sensitive personally identifiable information, including academic records, behavioral data, and personal communications. The use of third-party LLM solutions, especially those relying on public cloud infrastructure, poses risks of data breaches, unauthorized data usage, and noncompliance with legal frameworks. In North America, FERPA imposes strict controls on student education record disclosure. In Europe, GDPR sets a high bar for data processing, consent, and user rights, with substantial financial penalties for violations.
- According to recent research, the global education technology market is expected to reach USD100 billion by 2025, with a significant portion attributed to LLMs. Another study projects a 15% compound annual growth rate for the edtech market in Europe between 2020 and 2025. Despite these figures, ensuring data privacy and security remains a formidable challenge for the adoption of LLMs in education. As a professional, knowledgeable, and formal virtual assistant, it is crucial to maintain a professional tone when discussing these complex issues.
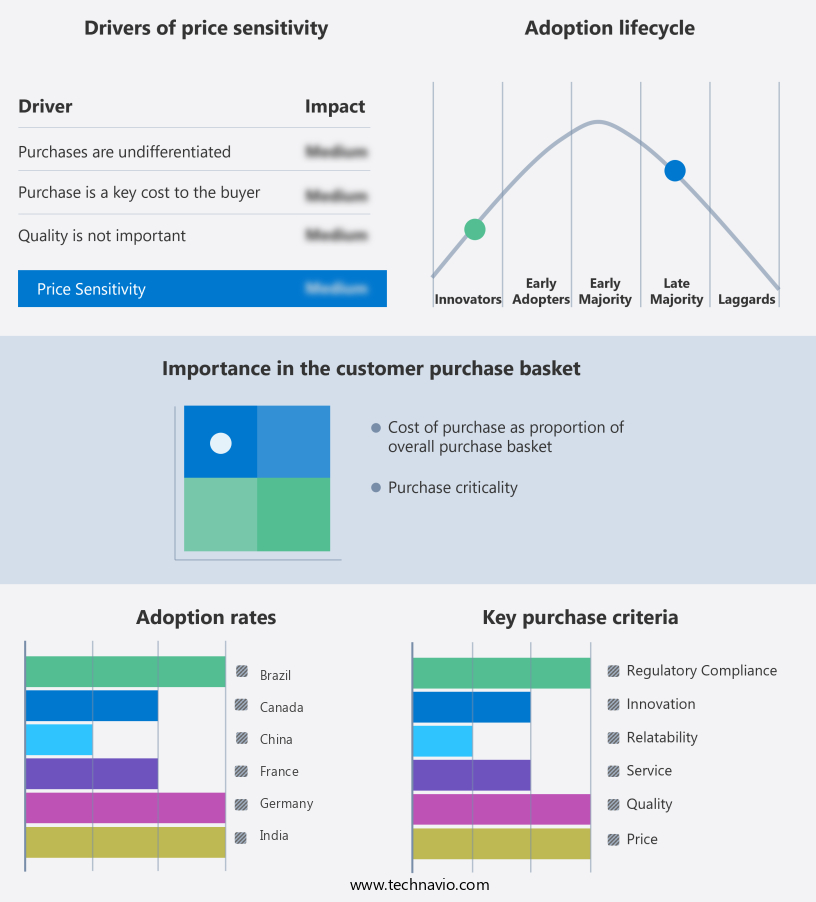
Exclusive Technavio Analysis on Customer Landscape
The llms in education market forecasting report includes the adoption lifecycle of the market, covering from the innovator's stage to the laggard's stage. It focuses on adoption rates in different regions based on penetration. Furthermore, the llms in education market report also includes key purchase criteria and drivers of price sensitivity to help companies evaluate and develop their market growth analysis strategies.
Customer Landscape of LLMs In Education Industry
Competitive Landscape
Companies are implementing various strategies, such as strategic alliances, llms in education market forecast, partnerships, mergers and acquisitions, geographical expansion, and product/service launches, to enhance their presence in the industry.
Addepto sp. z o.o. - The company specializes in Master of Science degrees in education, delivered via LiveHint AI and MATHia platforms. These innovative solutions integrate cognitive science and adaptive tutoring to enhance learning experiences.
The industry research and growth report includes detailed analyses of the competitive landscape of the market and information about key companies, including:
- Addepto sp. z o.o.
- Carnegie Learning Inc.
- Century Tech Ltd.
- Cognii Inc.
- Coursera Inc.
- Duolingo Inc.
- edX LLC
- Google LLC
- International Business Machines Corp.
- Khan Academy Inc.
- Markovate
- Matellio Inc.
- Mathpresso
- McGraw Hill LLC
- Merlyn Mind Inc.
- Microsoft Corp.
- OpenAI
- Pearson Plc
- Quizlet Inc.
- Squirrel AI Learning
- Xebia
Qualitative and quantitative analysis of companies has been conducted to help clients understand the wider business environment as well as the strengths and weaknesses of key industry players. Data is qualitatively analyzed to categorize companies as pure play, category-focused, industry-focused, and diversified; it is quantitatively analyzed to categorize companies as dominant, leading, strong, tentative, and weak.
Recent Development and News in LLMs In Education Market
- In January 2024, the University of Oxford announced the launch of a new online LLM in Education program, expanding its global reach and making the prestigious degree more accessible to students worldwide (University of Oxford press release). In March 2024, Harvard University and Microsoft Education formed a strategic partnership to develop innovative educational technologies, integrating Microsoft's tools into Harvard's LLM in Education curriculum (Harvard Gazette).
- In April 2024, Coursera, the online learning platform, secured a USD120 million funding round, allowing for further expansion of its MasterTrack programs, including its LLM in Education offerings (TechCrunch). In May 2025, the European Union passed the Digital Education Action Plan, including provisions for increased funding and support for online and blended learning programs, potentially boosting the demand for LLMs in Education (European Commission press release).
Dive into Technavio's robust research methodology, blending expert interviews, extensive data synthesis, and validated models for unparalleled LLMs In Education Market insights. See full methodology.
|
Market Scope |
|
|
Report Coverage |
Details |
|
Page number |
238 |
|
Base year |
2024 |
|
Historic period |
2019-2023 |
|
Forecast period |
2025-2029 |
|
Growth momentum & CAGR |
Accelerate at a CAGR of 32.9% |
|
Market growth 2025-2029 |
USD 1871.2 million |
|
Market structure |
Fragmented |
|
YoY growth 2024-2025(%) |
30.9 |
|
Key countries |
US, UK, China, Germany, Canada, India, France, Japan, Italy, and Brazil |
|
Competitive landscape |
Leading Companies, Market Positioning of Companies, Competitive Strategies, and Industry Risks |
Research Analyst Overview
- The learning management system (LMS) market continues to evolve, adapting to the ever-changing educational landscape. Ethical considerations surrounding data privacy regulations are increasingly shaping market activities, with companies investing in robust security measures and transparent data usage policies. Intelligent tutoring systems and chatbot for education are gaining traction, employing natural language processing and machine learning algorithms to provide personalized learning experiences. Student engagement strategies, such as gamification and interactive content, are being integrated into LMS platforms to enhance the learning experience. Knowledge representation and semantic search technologies enable efficient access to vast amounts of educational content.
- Adaptive learning systems, powered by educational data mining and learning analytics dashboards, tailor instruction to individual students' needs. Teacher training programs and automated feedback systems are essential components, reducing teacher workload and improving student performance metrics. Large language models and curriculum development tools facilitate content generation and enable more effective instruction. Classroom management tools and question answering systems streamline administrative tasks and provide instant answers to student queries. AI-powered tutoring and automated essay grading are revolutionizing assessment, offering accurate and objective evaluations. Accessibility features cater to diverse learners, ensuring equal opportunities for all. Bias detection methods and explainability of LLM models are crucial considerations for maintaining fairness and trust in the educational applications of these technologies.
- The global LMS market is expected to grow by over 15% annually, driven by the increasing demand for flexible, efficient, and personalized learning solutions. These trends and patterns underscore the continuous dynamism of the market, with ongoing innovation and development shaping the future of education. For instance, a leading LMS provider reported a 30% increase in sales due to the implementation of a chatbot for education, enabling students to receive instant answers to their queries and improving overall engagement.
What are the Key Data Covered in this LLMs In Education Market Research and Growth Report?
-
What is the expected growth of the LLMs In Education Market between 2025 and 2029?
-
USD 1.87 billion, at a CAGR of 32.9%
-
-
What segmentation does the market report cover?
-
The report is segmented by Component (Solutions and Services), Application (Chatbots and virtual assistants, Content generation, Personalized learning, Automated grading and assessment, and Others), End-user (K-12 education, Higher education, and Corporate training and learning), and Geography (North America, Europe, APAC, Middle East and Africa, and South America)
-
-
Which regions are analyzed in the report?
-
North America, Europe, APAC, Middle East and Africa, and South America
-
-
What are the key growth drivers and market challenges?
-
Surging demand for personalized and adaptive learning experiences, Navigating data privacy and security imperatives
-
-
Who are the major players in the LLMs In Education Market?
-
Addepto sp. z o.o., Carnegie Learning Inc., Century Tech Ltd., Cognii Inc., Coursera Inc., Duolingo Inc., edX LLC, Google LLC, International Business Machines Corp., Khan Academy Inc., Markovate, Matellio Inc., Mathpresso, McGraw Hill LLC, Merlyn Mind Inc., Microsoft Corp., OpenAI, Pearson Plc, Quizlet Inc., Squirrel AI Learning, and Xebia
-
Market Research Insights
- The market for Learning Management Systems (LMS) in education continues to evolve, with an increasing focus on enhancing curriculum design, student support, and engagement. According to recent industry reports, the number of educational institutions utilizing LMS solutions has grown by 15% over the past year. Furthermore, industry experts anticipate a 12% annual growth rate for the LMS market in the coming years. One notable example of the impact of LMS on education comes from a large university, which saw a 20% increase in student engagement and a 17% decrease in dropout rates after implementing an LMS with advanced features such as knowledge graphs, prompt design, and data visualization.
- These tools enable personalized learning experiences, real-time progress tracking, and effective feedback mechanisms, leading to improved student outcomes.
We can help! Our analysts can customize this llms in education market research report to meet your requirements.
 RIA -
RIA - 
