Low-density Polyethylene (LDPE) Market Analysis, Size, and Forecast 2025-2029: APAC (China, India, and Japan), North America (US, Canada, and Mexico), Europe (Germany, France, and UK), South America (Brazil, Argentina, and Colombia), Middle East and Africa (Saudi Arabia, Turkey, and UAE), and Rest of World (ROW)

Low-density Polyethylene (LDPE) Market Analysis, Size, and Forecast 2025-2029:
APAC (China, India, and Japan), North America (US, Canada, and Mexico), Europe (Germany, France, and UK), South America (Brazil, Argentina, and Colombia), Middle East and Africa (Saudi Arabia, Turkey, and UAE), and Rest of World (ROW)

Published: Dec 2025 324 Pages SKU: IRTNTR81049

Market Overview at a Glance

$12.04 B
Market Opportunity
4.7%
CAGR 2024 - 2029
50.4%
APAC Growth
$27.70 B
Tubular process segment 2023

Low-density Polyethylene (LDPE) Market Size 2025-2029

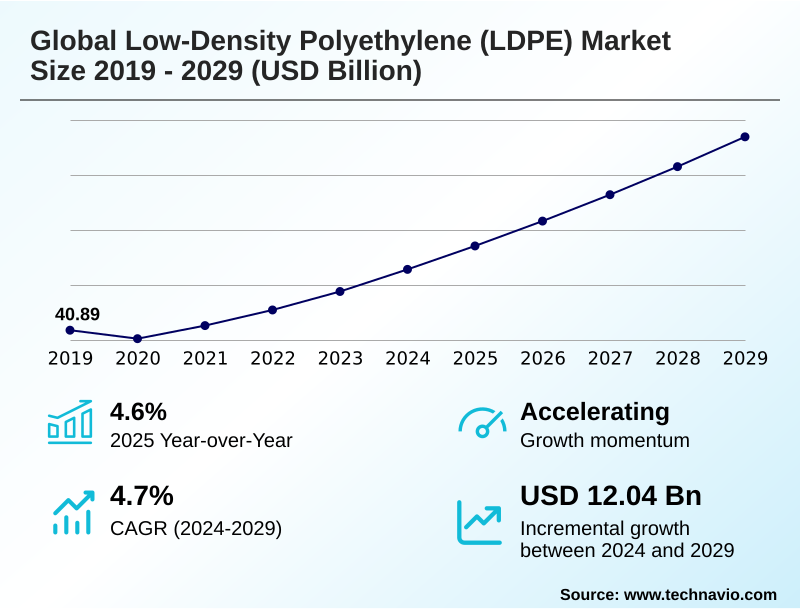
The low-density polyethylene (ldpe) market size is valued to increase by USD 12.04 billion, at a CAGR of 4.7% from 2024 to 2029. Robust demand from expanding flexible packaging sector will drive the low-density polyethylene (ldpe) market.

Major Market Trends & Insights

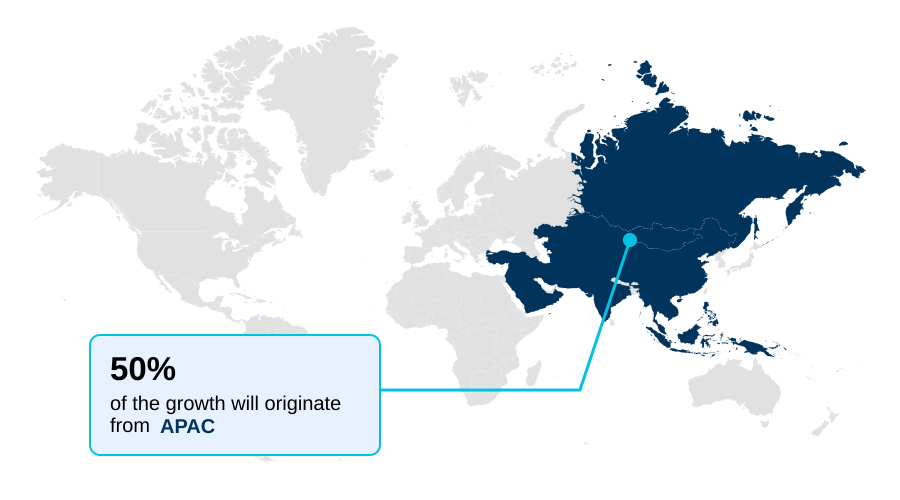
  • APAC dominated the market and accounted for a 50.4% growth during the forecast period.
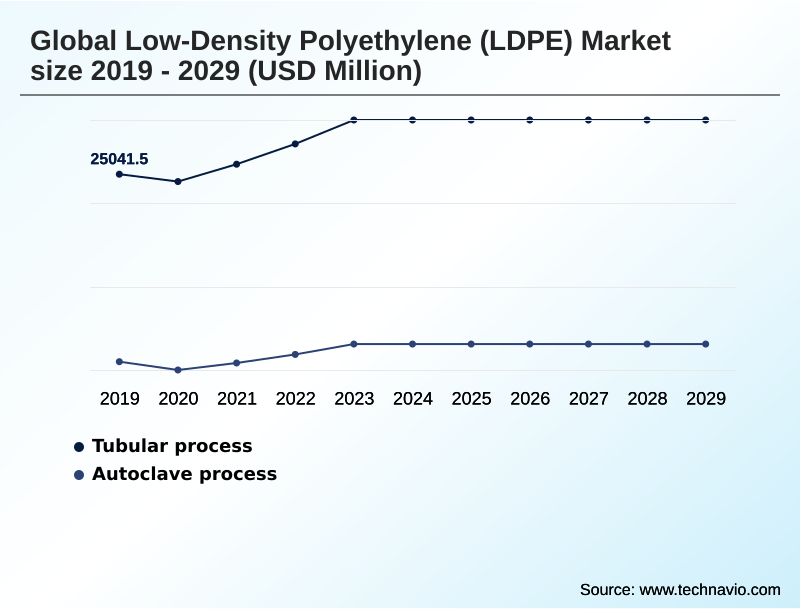
  • By Manufacturing Type - Tubular process segment was valued at USD 27.70 billion in 2023
  • By Application - Packaging segment accounted for the largest market revenue share in 2023

Market Size & Forecast

  • Market Opportunities: USD 17.58 billion
  • Market Future Opportunities: USD 12.04 billion
  • CAGR from 2024 to 2029 : 4.7%

Market Summary

  • The low-density polyethylene (LDPE) market remains integral to the global economy, anchored by its versatile applications across multiple industries. As a key thermoplastic polymer within the polyolefin family, its unique molecular structure, achieved through high-pressure polymerization, imparts essential properties like flexibility, moisture resistance, and chemical inertness.
  • These attributes sustain its dominance in film and sheet manufacturing for the packaging sector and in specialized applications such as wire and cable insulation.
  • The industry is currently navigating a significant transformation driven by the principles of a circular economy, which is compelling innovation in advanced recycling technologies like the pyrolysis process and the development of bio-based LDPE from renewable sources. However, the market also contends with challenges from substitute materials like LLDPE and PET, alongside volatile feedstock prices.
  • For instance, a packaging converter faces a critical business decision when new extended producer responsibility (EPR) mandates require incorporating 20% recycled content. This forces a strategic pivot in procurement to secure high-quality recycled material, impacting operational planning and supply chain logistics to maintain compliance and meet client demands.

What will be the Size of the Low-density Polyethylene (LDPE) Market during the forecast period?

Get Key Insights on Market Forecast (PDF) Request Free Sample

How is the Low-density Polyethylene (LDPE) Market Segmented?

The low-density polyethylene (ldpe) industry research report provides comprehensive data (region-wise segment analysis), with forecasts and estimates in "USD million" for the period 2025-2029, as well as historical data from 2019-2023 for the following segments.

  • Manufacturing type
    • Tubular process
    • Autoclave process
  • Application
    • Packaging
    • Agriculture
    • Construction
    • Electrical and electronics
    • Others
  • Grade type
    • Film grade
    • Injection molding grade
    • Extrusion coating grade
    • Blow molding grade
  • Distribution channel
    • Direct sales
    • Indirect sales
  • Geography
    • APAC
      • China
      • India
      • Japan
    • North America
      • US
      • Canada
      • Mexico
    • Europe
      • Germany
      • France
      • UK
    • South America
      • Brazil
      • Argentina
      • Colombia
    • Middle East and Africa
      • Saudi Arabia
      • Turkey
      • UAE
    • Rest of World (ROW)

By Manufacturing Type Insights

The tubular process segment is estimated to witness significant growth during the forecast period.

The tubular process remains the dominant manufacturing method, characterized by the use of a long tubular reactor for high-pressure polymerization. This technology is highly efficient for large-scale production, establishing favorable economies of scale for commodity grades within the polyolefin family.

The resulting polymer's molecular structure provides superior mechanical properties, including excellent toughness and tear resistance, making it ideal for film and sheet manufacturing. These films are critical for general-purpose packaging, heavy-duty industrial sacks, and agricultural applications requiring robust performance.

Leveraging this process, manufacturers can achieve production efficiency gains of over 15% compared to less streamlined methods. The consistent output supports sectors reliant on dependable material for applications ranging from food preservation technology to damp-proof membranes in construction.

Request Free Sample

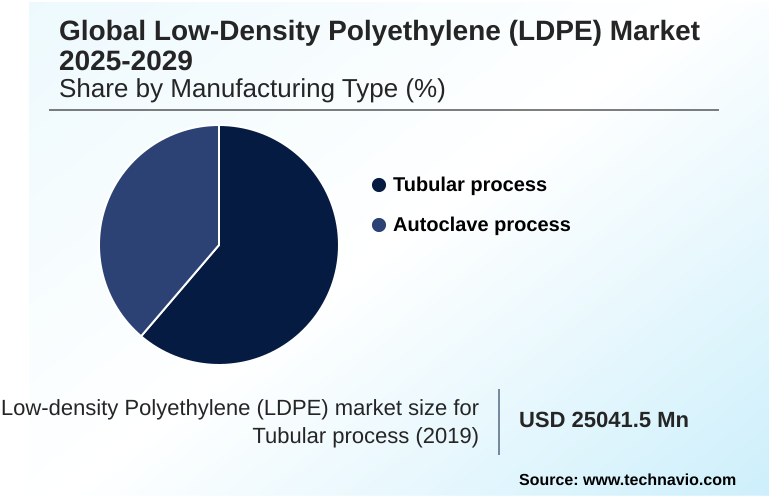
The Tubular process segment was valued at USD 27.70 billion in 2023 and showed a gradual increase during the forecast period.

Request Free Sample

Regional Analysis

APAC is estimated to contribute 50.4% to the growth of the global market during the forecast period.Technavio’s analysts have elaborately explained the regional trends and drivers that shape the market during the forecast period.

See How Low-density Polyethylene (LDPE) Market Demand is Rising in APAC Request Free Sample

The geographic landscape is characterized by varied growth dynamics, with APAC leading due to expanding industrial and consumer bases that drive demand for flexible packaging solutions. This region accounts for over 50% of the market's incremental growth.

In contrast, North America and Europe are mature markets focused on sustainability and high-performance applications like wire and cable insulation.

Regulatory frameworks are a key differentiator; in Europe, adherence to extended producer responsibility (EPR) schemes has compelled firms to innovate, with some achieving a 30% recycled content rate to align with regional targets.

The competitive advantage in North America stems from access to cost-effective ethane feedstock, supporting its status as a major production hub.

This regional diversification in demand, production, and regulation defines global trade flows and investment strategies for materials like polypropylene (PP).

Market Dynamics

Our researchers analyzed the data with 2024 as the base year, along with the key drivers, trends, and challenges. A holistic analysis of drivers will help companies refine their marketing strategies to gain a competitive advantage.

  • Strategic decisions in the low-density polyethylene (LDPE) market often begin with a fundamental choice between the tubular vs autoclave process LDPE, as each yields distinct properties tailored for different end uses. The primary application remains LDPE for flexible food packaging, where performance must now align with sustainable LDPE and circular economy models.
  • This has spurred the development of bio-based LDPE from renewable feedstocks, although this path is complicated by recycling challenges for LDPE films, particularly the challenges of recycling multi-layer LDPE packaging. In specialized sectors, high-performance LDPE for wire insulation and LDPE film grade for agricultural use continue to show stable demand.
  • Concurrently, LDPE geomembranes for landfill liners are critical for environmental compliance. The ongoing debate over LDPE vs LLDPE in stretch film applications highlights the intense material competition. Market-wide, the impact of feedstock volatility on LDPE prices and the effect of EPR schemes on LDPE market dynamics are major concerns for producers.
  • From a technology standpoint, advances in metallocene catalysts for LDPE are enabling innovations in down-gauging LDPE films, crucial for the e-commerce protective packaging sector. Digitalization in LDPE production optimization is helping to mitigate cost pressures.
  • For instance, in blow molding LDPE for squeeze bottle applications, integrating advanced recycled content can increase production cycle times by up to 5%, a critical trade-off that supply chain managers must balance against sustainability mandates. Other key areas include injection molding grade LDPE for closures and understanding LDPE properties for medical device packaging.

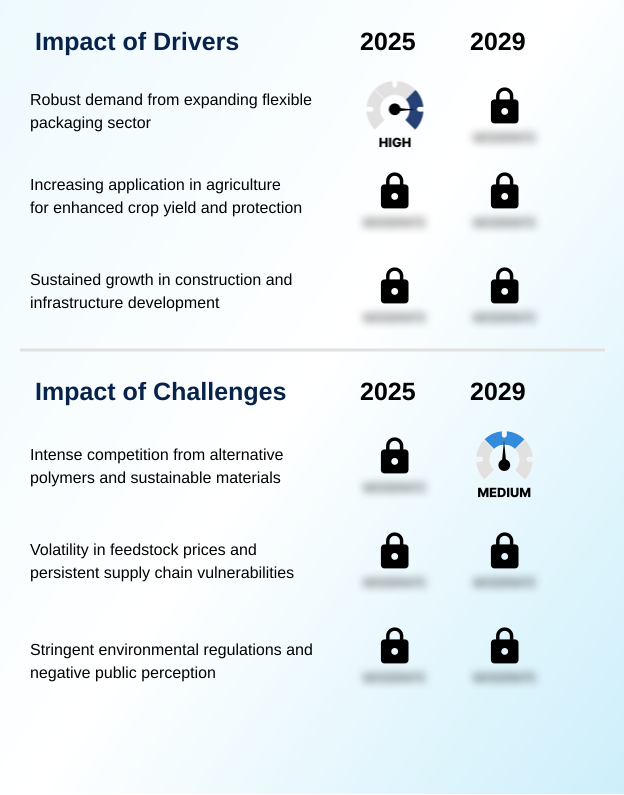
What are the key market drivers leading to the rise in the adoption of Low-density Polyethylene (LDPE) Industry?

  • Robust demand from the expanding flexible packaging sector, fueled by shifts in consumer behavior and retail logistics, serves as a primary market driver.

  • Sustained demand is anchored by the material's indispensable role in flexible packaging solutions, a sector continually fueled by e-commerce growth and consumer preference for convenience.
  • Key properties such as moisture resistance and chemical inertness make it a preferred choice for film and sheet manufacturing.
  • Another significant driver is the agricultural sector's growing reliance on plasticulture techniques, where greenhouse films, mulch films, and silage films are essential for enhancing crop yields.
  • The use of mulch films, for example, can increase yields by over 20% in certain arid regions by improving water conservation.
  • Additionally, infrastructure development projects create consistent demand for products like geomembranes for containment systems, which have demonstrated a 99.9% effectiveness rate in preventing soil contamination, underscoring the material's functional importance.

What are the market trends shaping the Low-density Polyethylene (LDPE) Industry?

  • The accelerated shift toward a circular economy and the development of sustainable LDPE represents a transformative market trend. This is driven by regulatory pressures and evolving corporate sustainability goals.

  • The market's evolution is increasingly dictated by a pivot to a circular economy, fostering innovation in both material science and processing. Key trends include the scaling of advanced recycling technologies, where the pyrolysis process converts waste back into feedstock, and the expansion of bio-based LDPE derived from sources like sugarcane-derived ethanol.
  • Adopting recyclable mono-material polyethylene designs can increase packaging recyclability scores by up to 40% under certain eco-modulation fee systems. Furthermore, the use of metallocene catalysts in polymerization is enabling the production of high-performance films that are 15% thinner without sacrificing critical properties.
  • This focus on sustainability and efficiency is also driving the adoption of smart factory concepts and digital twins to optimize production, particularly for high-value applications like aseptic cartons and sterile packaging.

What challenges does the Low-density Polyethylene (LDPE) Industry face during its growth?

  • Intense competition from alternative polymers and a growing portfolio of sustainable materials presents a significant challenge to market growth.

  • The market faces considerable headwinds from material substitution and a stringent regulatory climate. Intense competition arises from linear low-density polyethylene (LLDPE), which often provides superior puncture resistance, and from the growing adoption of bio-plastics and compostable materials.
  • The financial impact of volatile feedstock prices for naphtha feedstock and ethane feedstock remains a persistent threat, with production costs fluctuating by over 25% in a single quarter. Moreover, overarching legislative frameworks, including the proposed Global Plastics Treaty and existing Extended Producer Responsibility (EPR) schemes, create significant compliance hurdles.
  • In regions with strict single-use plastics prohibition, demand for certain LDPE products has declined by as much as 30%, forcing producers to innovate toward more sustainable or exempt applications.

Exclusive Technavio Analysis on Customer Landscape

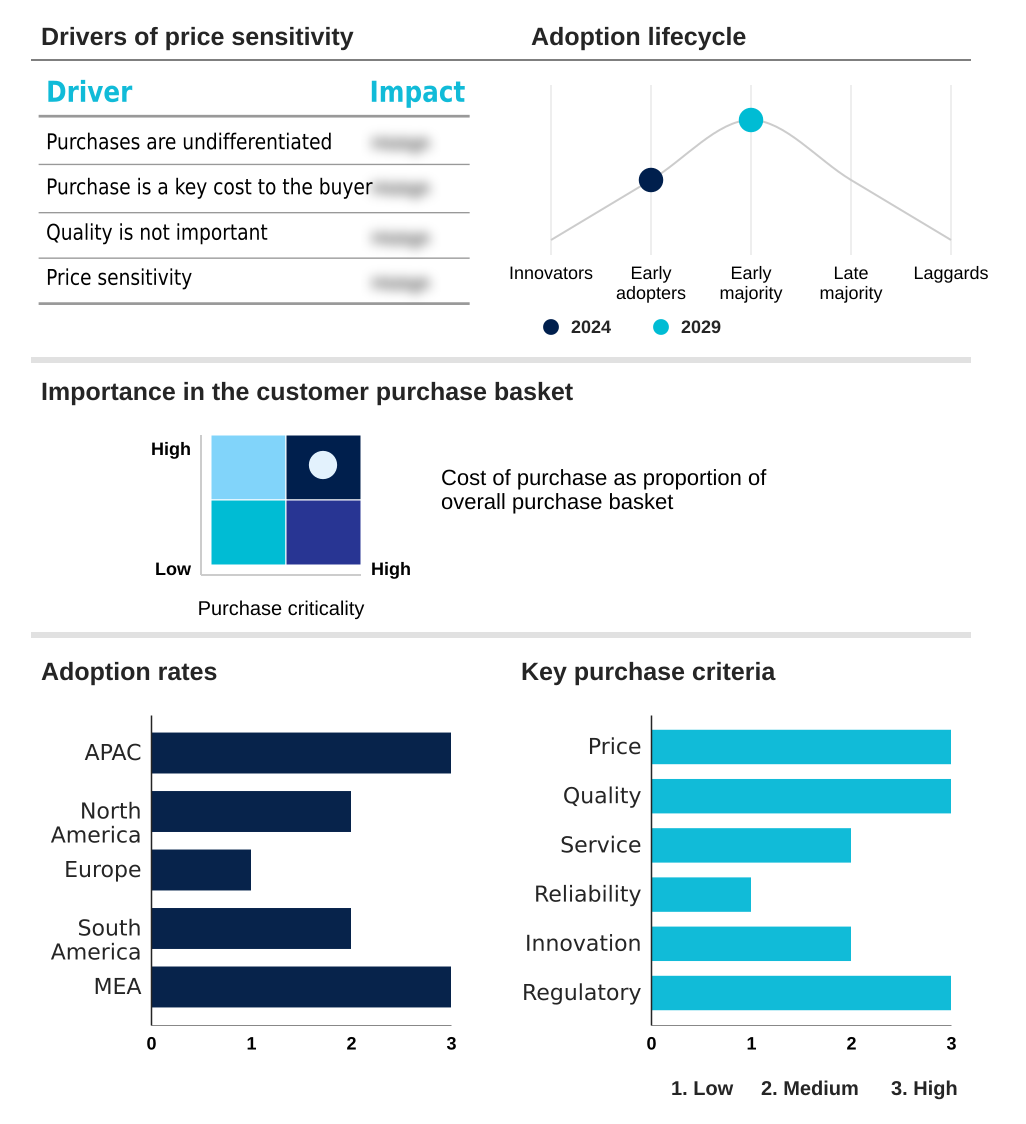
The low-density polyethylene (ldpe) market forecasting report includes the adoption lifecycle of the market, covering from the innovator’s stage to the laggard’s stage. It focuses on adoption rates in different regions based on penetration. Furthermore, the low-density polyethylene (ldpe) market report also includes key purchase criteria and drivers of price sensitivity to help companies evaluate and develop their market growth analysis strategies.

Customer Landscape of Low-density Polyethylene (LDPE) Industry

Competitive Landscape

Companies are implementing various strategies, such as strategic alliances, low-density polyethylene (ldpe) market forecast, partnerships, mergers and acquisitions, geographical expansion, and product/service launches, to enhance their presence in the industry.

Borealis AG - Proprietary technology underpins specialty LDPE grades for advanced packaging and wire & cable, targeting high-performance sectors.

The industry research and growth report includes detailed analyses of the competitive landscape of the market and information about key companies, including:

  • Borealis AG
  • Borouge PLC
  • Braskem SA
  • Chevron Phillips Chemical Co.
  • Dow Chemical Co.
  • Exxon Mobil Corp.
  • Formosa Plastics Corp.
  • INEOS Group Holdings S.A.
  • LG Chem Ltd.
  • Lotte Chemical Corp.
  • LyondellBasell Industries NV
  • Mitsui Chemicals Inc.
  • NOVA Chemicals Corp.
  • Qatar Petrochemical Company (QAPCO) Q.P.J.S.C
  • Reliance Industries Ltd.
  • Saudi Basic Industries
  • Tasnee
  • TotalEnergies SE
  • Westlake Corp.

Qualitative and quantitative analysis of companies has been conducted to help clients understand the wider business environment as well as the strengths and weaknesses of key industry players. Data is qualitatively analyzed to categorize companies as pure play, category-focused, industry-focused, and diversified; it is quantitatively analyzed to categorize companies as dominant, leading, strong, tentative, and weak.

Recent Development and News in Low-density polyethylene (ldpe) market

  • In September, 2024, LyondellBasell Industries NV announces a strategic partnership with a leading chemical recycling firm to offtake pyrolysis oil for its circular polymer production line, enhancing its sustainable feedstock portfolio.
  • In November, 2024, Dow Chemical Co. launches a new series of recyclable mono-material polyethylene resins designed for high-barrier food packaging, enabling downgauging by up to 15% without compromising performance.
  • In January, 2025, The Alliance to End Plastic Waste, in collaboration with SABIC, initiates a large-scale project in Southeast Asia to establish collection and sorting infrastructure for flexible plastic films, addressing a critical gap in the circular economy.
  • In April, 2025, Borouge PLC confirms the successful commissioning of its new world-scale tubular process LDPE plant, adding significant capacity to serve the growing demand for packaging and agricultural films in Asian markets.

Dive into Technavio’s robust research methodology, blending expert interviews, extensive data synthesis, and validated models for unparalleled Low-density Polyethylene (LDPE) Market insights. See full methodology.

Market Scope
Page number 324
Base year 2024
Historic period 2019-2023
Forecast period 2025-2029
Growth momentum & CAGR Accelerate at a CAGR of 4.7%
Market growth 2025-2029 USD 12044.3 million
Market structure Fragmented
YoY growth 2024-2025(%) 4.6%
Key countries China, India, Japan, South Korea, Australia, Indonesia, US, Canada, Mexico, Germany, France, UK, Italy, Spain, The Netherlands, Brazil, Argentina, Colombia, Saudi Arabia, Turkey, UAE, South Africa and Israel
Competitive landscape Leading Companies, Market Positioning of Companies, Competitive Strategies, and Industry Risks

Request Free Sample

Research Analyst Overview

  • The low-density polyethylene (LDPE) market is defined by its dual role as a high-volume thermoplastic polymer and a platform for specialized material innovation.
  • As a member of the polyolefin family, this material is produced from monomer ethylene via high-pressure polymerization in either a tubular reactor or an autoclave reactor, resulting in a distinct molecular structure used in film and sheet manufacturing, extrusion coating, and wire and cable insulation. The paramount boardroom-level issue is the industry-wide transition toward a circular economy.
  • This strategic shift necessitates significant investment in both mechanical recycling and advanced recycling infrastructure, including pyrolysis process facilities, to produce recycled content and meet stringent Extended Producer Responsibility (EPR) mandates. Companies leveraging digital twins and machine learning algorithms in production have demonstrated a quantifiable reduction in off-spec material by over 10%, directly enhancing profitability.
  • This drive for efficiency is critical, as the market contends with competition from materials like LLDPE, PP, PET, PLA, and PHA, alongside the persistent volatility of feedstock prices for both naphtha feedstock and ethane feedstock, while developing solutions like bio-based LDPE from sugarcane-derived ethanol.

What are the Key Data Covered in this Low-density Polyethylene (LDPE) Market Research and Growth Report?

  • What is the expected growth of the Low-density Polyethylene (LDPE) Market between 2025 and 2029?

    • USD 12.04 billion, at a CAGR of 4.7%

  • What segmentation does the market report cover?

    • The report is segmented by Manufacturing Type (Tubular process, Autoclave process), Application (Packaging, Agriculture, Construction, Electrical and electronics, Others), Grade Type (Film grade, Injection molding grade, Extrusion coating grade, Blow molding grade), Distribution Channel (Direct sales, Indirect sales) and Geography (APAC, North America, Europe, South America, Middle East and Africa)

  • Which regions are analyzed in the report?

    • APAC, North America, Europe, South America and Middle East and Africa

  • What are the key growth drivers and market challenges?

    • Robust demand from expanding flexible packaging sector, Intense competition from alternative polymers and sustainable materials

  • Who are the major players in the Low-density Polyethylene (LDPE) Market?

    • Borealis AG, Borouge PLC, Braskem SA, Chevron Phillips Chemical Co., Dow Chemical Co., Exxon Mobil Corp., Formosa Plastics Corp., INEOS Group Holdings S.A., LG Chem Ltd., Lotte Chemical Corp., LyondellBasell Industries NV, Mitsui Chemicals Inc., NOVA Chemicals Corp., Qatar Petrochemical Company (QAPCO) Q.P.J.S.C, Reliance Industries Ltd., Saudi Basic Industries, Tasnee, TotalEnergies SE and Westlake Corp.

Market Research Insights

  • Market dynamics are shaped by a persistent need for high-performance materials in diverse applications, from flexible packaging solutions to sterile packaging in healthcare. The adoption of advanced agricultural methods creates steady demand for greenhouse films and mulch films.
  • In response to efficiency pressures, manufacturers are integrating smart factory concepts; the use of IoT sensors in production has enabled some operators to reduce energy consumption by over 10%. Concurrently, the push for sustainability drives innovation in recyclable mono-material polyethylene, with new designs improving recycling stream purity by over 25% compared to complex multi-layer structures.
  • These shifts reflect an industry balancing performance requirements with circular economy goals.

We can help! Our analysts can customize this low-density polyethylene (ldpe) market research report to meet your requirements.

Get in touch

1. Executive Summary

1.1 Market overview

Executive Summary - Chart on Market Overview
Executive Summary - Data Table on Market Overview
Executive Summary - Chart on Global Market Characteristics
Executive Summary - Chart on Market by Geography
Executive Summary - Chart on Market Segmentation by Manufacturing Type
Executive Summary - Chart on Market Segmentation by Application
Executive Summary - Chart on Market Segmentation by Grade Type
Executive Summary - Chart on Market Segmentation by Distribution Channel
Executive Summary - Chart on Incremental Growth
Executive Summary - Data Table on Incremental Growth
Executive Summary - Chart on Company Market Positioning

2. Technavio Analysis

2.1 Analysis of price sensitivity, lifecycle, customer purchase basket, adoption rates, and purchase criteria

2.2 Criticality of inputs and Factors of differentiation

Chart on Overview on criticality of inputs and factors of differentiation

2.3 Factors of disruption

Chart on Overview on factors of disruption

2.4 Impact of drivers and challenges

Chart on Impact of drivers and challenges in 2024 and 2029

3. Market Landscape

3.1 Market ecosystem

Chart on Parent Market
Data Table on - Parent Market

3.2 Market characteristics

Chart on Market characteristics analysis

3.3 Value chain analysis

Chart on Value chain analysis

4. Market Sizing

4.1 Market definition

Data Table on Offerings of companies included in the market definition

4.2 Market segment analysis

Market segments

4.3 Market size 2024

4.4 Market outlook: Forecast for 2024-2029

Chart on Global - Market size and forecast 2024-2029 ($ million)
Data Table on Global - Market size and forecast 2024-2029 ($ million)
Chart on Global Market: Year-over-year growth 2024-2029 (%)
Data Table on Global Market: Year-over-year growth 2024-2029 (%)

5. Historic Market Size

5.1 Global Low-Density Polyethylene (LDPE) Market 2019 - 2023

Historic Market Size - Data Table on Global Low-Density Polyethylene (LDPE) Market 2019 - 2023 ($ million)

5.2 Manufacturing Type segment analysis 2019 - 2023

Historic Market Size - Manufacturing Type Segment 2019 - 2023 ($ million)

5.3 Application segment analysis 2019 - 2023

Historic Market Size - Application Segment 2019 - 2023 ($ million)

5.4 Grade Type segment analysis 2019 - 2023

Historic Market Size - Grade Type Segment 2019 - 2023 ($ million)

5.5 Distribution Channel segment analysis 2019 - 2023

Historic Market Size - Distribution Channel Segment 2019 - 2023 ($ million)

5.6 Geography segment analysis 2019 - 2023

Historic Market Size - Geography Segment 2019 - 2023 ($ million)

5.7 Country segment analysis 2019 - 2023

Historic Market Size - Country Segment 2019 - 2023 ($ million)

6. Five Forces Analysis

6.1 Five forces summary

Five forces analysis - Comparison between 2024 and 2029

6.2 Bargaining power of buyers

Bargaining power of buyers - Impact of key factors 2024 and 2029

6.3 Bargaining power of suppliers

Bargaining power of suppliers - Impact of key factors in 2024 and 2029

6.4 Threat of new entrants

Threat of new entrants - Impact of key factors in 2024 and 2029

6.5 Threat of substitutes

Threat of substitutes - Impact of key factors in 2024 and 2029

6.6 Threat of rivalry

Threat of rivalry - Impact of key factors in 2024 and 2029

6.7 Market condition

Chart on Market condition - Five forces 2024 and 2029

7. Market Segmentation by Manufacturing Type

7.1 Market segments

Chart on Manufacturing Type - Market share 2024-2029 (%)
Data Table on Manufacturing Type - Market share 2024-2029 (%)

7.2 Comparison by Manufacturing Type

Chart on Comparison by Manufacturing Type
Data Table on Comparison by Manufacturing Type

7.3 Tubular process - Market size and forecast 2024-2029

Chart on Tubular process - Market size and forecast 2024-2029 ($ million)
Data Table on Tubular process - Market size and forecast 2024-2029 ($ million)
Chart on Tubular process - Year-over-year growth 2024-2029 (%)
Data Table on Tubular process - Year-over-year growth 2024-2029 (%)

7.4 Autoclave process - Market size and forecast 2024-2029

Chart on Autoclave process - Market size and forecast 2024-2029 ($ million)
Data Table on Autoclave process - Market size and forecast 2024-2029 ($ million)
Chart on Autoclave process - Year-over-year growth 2024-2029 (%)
Data Table on Autoclave process - Year-over-year growth 2024-2029 (%)

7.5 Market opportunity by Manufacturing Type

Market opportunity by Manufacturing Type ($ million)
Data Table on Market opportunity by Manufacturing Type ($ million)

8. Market Segmentation by Application

8.1 Market segments

Chart on Application - Market share 2024-2029 (%)
Data Table on Application - Market share 2024-2029 (%)

8.2 Comparison by Application

Chart on Comparison by Application
Data Table on Comparison by Application

8.3 Packaging - Market size and forecast 2024-2029

Chart on Packaging - Market size and forecast 2024-2029 ($ million)
Data Table on Packaging - Market size and forecast 2024-2029 ($ million)
Chart on Packaging - Year-over-year growth 2024-2029 (%)
Data Table on Packaging - Year-over-year growth 2024-2029 (%)

8.4 Agriculture - Market size and forecast 2024-2029

Chart on Agriculture - Market size and forecast 2024-2029 ($ million)
Data Table on Agriculture - Market size and forecast 2024-2029 ($ million)
Chart on Agriculture - Year-over-year growth 2024-2029 (%)
Data Table on Agriculture - Year-over-year growth 2024-2029 (%)

8.5 Construction - Market size and forecast 2024-2029

Chart on Construction - Market size and forecast 2024-2029 ($ million)
Data Table on Construction - Market size and forecast 2024-2029 ($ million)
Chart on Construction - Year-over-year growth 2024-2029 (%)
Data Table on Construction - Year-over-year growth 2024-2029 (%)

8.6 Electrical and electronics - Market size and forecast 2024-2029

Chart on Electrical and electronics - Market size and forecast 2024-2029 ($ million)
Data Table on Electrical and electronics - Market size and forecast 2024-2029 ($ million)
Chart on Electrical and electronics - Year-over-year growth 2024-2029 (%)
Data Table on Electrical and electronics - Year-over-year growth 2024-2029 (%)

8.7 Others - Market size and forecast 2024-2029

Chart on Others - Market size and forecast 2024-2029 ($ million)
Data Table on Others - Market size and forecast 2024-2029 ($ million)
Chart on Others - Year-over-year growth 2024-2029 (%)
Data Table on Others - Year-over-year growth 2024-2029 (%)

8.8 Market opportunity by Application

Market opportunity by Application ($ million)
Data Table on Market opportunity by Application ($ million)

9. Market Segmentation by Grade Type

9.1 Market segments

Chart on Grade Type - Market share 2024-2029 (%)
Data Table on Grade Type - Market share 2024-2029 (%)

9.2 Comparison by Grade Type

Chart on Comparison by Grade Type
Data Table on Comparison by Grade Type

9.3 Film grade - Market size and forecast 2024-2029

Chart on Film grade - Market size and forecast 2024-2029 ($ million)
Data Table on Film grade - Market size and forecast 2024-2029 ($ million)
Chart on Film grade - Year-over-year growth 2024-2029 (%)
Data Table on Film grade - Year-over-year growth 2024-2029 (%)

9.4 Injection molding grade - Market size and forecast 2024-2029

Chart on Injection molding grade - Market size and forecast 2024-2029 ($ million)
Data Table on Injection molding grade - Market size and forecast 2024-2029 ($ million)
Chart on Injection molding grade - Year-over-year growth 2024-2029 (%)
Data Table on Injection molding grade - Year-over-year growth 2024-2029 (%)

9.5 Extrusion coating grade - Market size and forecast 2024-2029

Chart on Extrusion coating grade - Market size and forecast 2024-2029 ($ million)
Data Table on Extrusion coating grade - Market size and forecast 2024-2029 ($ million)
Chart on Extrusion coating grade - Year-over-year growth 2024-2029 (%)
Data Table on Extrusion coating grade - Year-over-year growth 2024-2029 (%)

9.6 Blow molding grade - Market size and forecast 2024-2029

Chart on Blow molding grade - Market size and forecast 2024-2029 ($ million)
Data Table on Blow molding grade - Market size and forecast 2024-2029 ($ million)
Chart on Blow molding grade - Year-over-year growth 2024-2029 (%)
Data Table on Blow molding grade - Year-over-year growth 2024-2029 (%)

9.7 Market opportunity by Grade Type

Market opportunity by Grade Type ($ million)
Data Table on Market opportunity by Grade Type ($ million)

10. Market Segmentation by Distribution Channel

10.1 Market segments

Chart on Distribution Channel - Market share 2024-2029 (%)
Data Table on Distribution Channel - Market share 2024-2029 (%)

10.2 Comparison by Distribution Channel

Chart on Comparison by Distribution Channel
Data Table on Comparison by Distribution Channel

10.3 Direct sales - Market size and forecast 2024-2029

Chart on Direct sales - Market size and forecast 2024-2029 ($ million)
Data Table on Direct sales - Market size and forecast 2024-2029 ($ million)
Chart on Direct sales - Year-over-year growth 2024-2029 (%)
Data Table on Direct sales - Year-over-year growth 2024-2029 (%)

10.4 Indirect sales - Market size and forecast 2024-2029

Chart on Indirect sales - Market size and forecast 2024-2029 ($ million)
Data Table on Indirect sales - Market size and forecast 2024-2029 ($ million)
Chart on Indirect sales - Year-over-year growth 2024-2029 (%)
Data Table on Indirect sales - Year-over-year growth 2024-2029 (%)

10.5 Market opportunity by Distribution Channel

Market opportunity by Distribution Channel ($ million)
Data Table on Market opportunity by Distribution Channel ($ million)

11. Customer Landscape

11.1 Customer landscape overview

Analysis of price sensitivity, lifecycle, customer purchase basket, adoption rates, and purchase criteria

12. Geographic Landscape

12.1 Geographic segmentation

Chart on Market share by geography 2024-2029 (%)
Data Table on Market share by geography 2024-2029 (%)

12.2 Geographic comparison

Chart on Geographic comparison
Data Table on Geographic comparison

12.3 APAC - Market size and forecast 2024-2029

Chart on APAC - Market size and forecast 2024-2029 ($ million)
Data Table on APAC - Market size and forecast 2024-2029 ($ million)
Chart on APAC - Year-over-year growth 2024-2029 (%)
Data Table on APAC - Year-over-year growth 2024-2029 (%)
Chart on Regional Comparison - APAC
Data Table on Regional Comparison - APAC

12.3.1 China - Market size and forecast 2024-2029

Chart on China - Market size and forecast 2024-2029 ($ million)
Data Table on China - Market size and forecast 2024-2029 ($ million)
Chart on China - Year-over-year growth 2024-2029 (%)
Data Table on China - Year-over-year growth 2024-2029 (%)

12.3.2 India - Market size and forecast 2024-2029

Chart on India - Market size and forecast 2024-2029 ($ million)
Data Table on India - Market size and forecast 2024-2029 ($ million)
Chart on India - Year-over-year growth 2024-2029 (%)
Data Table on India - Year-over-year growth 2024-2029 (%)

12.3.3 Japan - Market size and forecast 2024-2029

Chart on Japan - Market size and forecast 2024-2029 ($ million)
Data Table on Japan - Market size and forecast 2024-2029 ($ million)
Chart on Japan - Year-over-year growth 2024-2029 (%)
Data Table on Japan - Year-over-year growth 2024-2029 (%)

12.3.4 South Korea - Market size and forecast 2024-2029

Chart on South Korea - Market size and forecast 2024-2029 ($ million)
Data Table on South Korea - Market size and forecast 2024-2029 ($ million)
Chart on South Korea - Year-over-year growth 2024-2029 (%)
Data Table on South Korea - Year-over-year growth 2024-2029 (%)

12.3.5 Australia - Market size and forecast 2024-2029

Chart on Australia - Market size and forecast 2024-2029 ($ million)
Data Table on Australia - Market size and forecast 2024-2029 ($ million)
Chart on Australia - Year-over-year growth 2024-2029 (%)
Data Table on Australia - Year-over-year growth 2024-2029 (%)

12.3.6 Indonesia - Market size and forecast 2024-2029

Chart on Indonesia - Market size and forecast 2024-2029 ($ million)
Data Table on Indonesia - Market size and forecast 2024-2029 ($ million)
Chart on Indonesia - Year-over-year growth 2024-2029 (%)
Data Table on Indonesia - Year-over-year growth 2024-2029 (%)

12.4 North America - Market size and forecast 2024-2029

Chart on North America - Market size and forecast 2024-2029 ($ million)
Data Table on North America - Market size and forecast 2024-2029 ($ million)
Chart on North America - Year-over-year growth 2024-2029 (%)
Data Table on North America - Year-over-year growth 2024-2029 (%)
Chart on Regional Comparison - North America
Data Table on Regional Comparison - North America

12.4.1 US - Market size and forecast 2024-2029

Chart on US - Market size and forecast 2024-2029 ($ million)
Data Table on US - Market size and forecast 2024-2029 ($ million)
Chart on US - Year-over-year growth 2024-2029 (%)
Data Table on US - Year-over-year growth 2024-2029 (%)

12.4.2 Canada - Market size and forecast 2024-2029

Chart on Canada - Market size and forecast 2024-2029 ($ million)
Data Table on Canada - Market size and forecast 2024-2029 ($ million)
Chart on Canada - Year-over-year growth 2024-2029 (%)
Data Table on Canada - Year-over-year growth 2024-2029 (%)

12.4.3 Mexico - Market size and forecast 2024-2029

Chart on Mexico - Market size and forecast 2024-2029 ($ million)
Data Table on Mexico - Market size and forecast 2024-2029 ($ million)
Chart on Mexico - Year-over-year growth 2024-2029 (%)
Data Table on Mexico - Year-over-year growth 2024-2029 (%)

12.5 Europe - Market size and forecast 2024-2029

Chart on Europe - Market size and forecast 2024-2029 ($ million)
Data Table on Europe - Market size and forecast 2024-2029 ($ million)
Chart on Europe - Year-over-year growth 2024-2029 (%)
Data Table on Europe - Year-over-year growth 2024-2029 (%)
Chart on Regional Comparison - Europe
Data Table on Regional Comparison - Europe

12.5.1 Germany - Market size and forecast 2024-2029

Chart on Germany - Market size and forecast 2024-2029 ($ million)
Data Table on Germany - Market size and forecast 2024-2029 ($ million)
Chart on Germany - Year-over-year growth 2024-2029 (%)
Data Table on Germany - Year-over-year growth 2024-2029 (%)

12.5.2 France - Market size and forecast 2024-2029

Chart on France - Market size and forecast 2024-2029 ($ million)
Data Table on France - Market size and forecast 2024-2029 ($ million)
Chart on France - Year-over-year growth 2024-2029 (%)
Data Table on France - Year-over-year growth 2024-2029 (%)

12.5.3 UK - Market size and forecast 2024-2029

Chart on UK - Market size and forecast 2024-2029 ($ million)
Data Table on UK - Market size and forecast 2024-2029 ($ million)
Chart on UK - Year-over-year growth 2024-2029 (%)
Data Table on UK - Year-over-year growth 2024-2029 (%)

12.5.4 Italy - Market size and forecast 2024-2029

Chart on Italy - Market size and forecast 2024-2029 ($ million)
Data Table on Italy - Market size and forecast 2024-2029 ($ million)
Chart on Italy - Year-over-year growth 2024-2029 (%)
Data Table on Italy - Year-over-year growth 2024-2029 (%)

12.5.5 Spain - Market size and forecast 2024-2029

Chart on Spain - Market size and forecast 2024-2029 ($ million)
Data Table on Spain - Market size and forecast 2024-2029 ($ million)
Chart on Spain - Year-over-year growth 2024-2029 (%)
Data Table on Spain - Year-over-year growth 2024-2029 (%)

12.5.6 The Netherlands - Market size and forecast 2024-2029

Chart on The Netherlands - Market size and forecast 2024-2029 ($ million)
Data Table on The Netherlands - Market size and forecast 2024-2029 ($ million)
Chart on The Netherlands - Year-over-year growth 2024-2029 (%)
Data Table on The Netherlands - Year-over-year growth 2024-2029 (%)

12.6 South America - Market size and forecast 2024-2029

Chart on South America - Market size and forecast 2024-2029 ($ million)
Data Table on South America - Market size and forecast 2024-2029 ($ million)
Chart on South America - Year-over-year growth 2024-2029 (%)
Data Table on South America - Year-over-year growth 2024-2029 (%)
Chart on Regional Comparison - South America
Data Table on Regional Comparison - South America

12.6.1 Brazil - Market size and forecast 2024-2029

Chart on Brazil - Market size and forecast 2024-2029 ($ million)
Data Table on Brazil - Market size and forecast 2024-2029 ($ million)
Chart on Brazil - Year-over-year growth 2024-2029 (%)
Data Table on Brazil - Year-over-year growth 2024-2029 (%)

12.6.2 Argentina - Market size and forecast 2024-2029

Chart on Argentina - Market size and forecast 2024-2029 ($ million)
Data Table on Argentina - Market size and forecast 2024-2029 ($ million)
Chart on Argentina - Year-over-year growth 2024-2029 (%)
Data Table on Argentina - Year-over-year growth 2024-2029 (%)

12.6.3 Colombia - Market size and forecast 2024-2029

Chart on Colombia - Market size and forecast 2024-2029 ($ million)
Data Table on Colombia - Market size and forecast 2024-2029 ($ million)
Chart on Colombia - Year-over-year growth 2024-2029 (%)
Data Table on Colombia - Year-over-year growth 2024-2029 (%)

12.7 Middle East and Africa - Market size and forecast 2024-2029

Chart on Middle East and Africa - Market size and forecast 2024-2029 ($ million)
Data Table on Middle East and Africa - Market size and forecast 2024-2029 ($ million)
Chart on Middle East and Africa - Year-over-year growth 2024-2029 (%)
Data Table on Middle East and Africa - Year-over-year growth 2024-2029 (%)
Chart on Regional Comparison - Middle East and Africa
Data Table on Regional Comparison - Middle East and Africa

12.7.1 Saudi Arabia - Market size and forecast 2024-2029

Chart on Saudi Arabia - Market size and forecast 2024-2029 ($ million)
Data Table on Saudi Arabia - Market size and forecast 2024-2029 ($ million)
Chart on Saudi Arabia - Year-over-year growth 2024-2029 (%)
Data Table on Saudi Arabia - Year-over-year growth 2024-2029 (%)

12.7.2 Turkey - Market size and forecast 2024-2029

Chart on Turkey - Market size and forecast 2024-2029 ($ million)
Data Table on Turkey - Market size and forecast 2024-2029 ($ million)
Chart on Turkey - Year-over-year growth 2024-2029 (%)
Data Table on Turkey - Year-over-year growth 2024-2029 (%)

12.7.3 UAE - Market size and forecast 2024-2029

Chart on UAE - Market size and forecast 2024-2029 ($ million)
Data Table on UAE - Market size and forecast 2024-2029 ($ million)
Chart on UAE - Year-over-year growth 2024-2029 (%)
Data Table on UAE - Year-over-year growth 2024-2029 (%)

12.7.4 South Africa - Market size and forecast 2024-2029

Chart on South Africa - Market size and forecast 2024-2029 ($ million)
Data Table on South Africa - Market size and forecast 2024-2029 ($ million)
Chart on South Africa - Year-over-year growth 2024-2029 (%)
Data Table on South Africa - Year-over-year growth 2024-2029 (%)

12.7.5 Israel - Market size and forecast 2024-2029

Chart on Israel - Market size and forecast 2024-2029 ($ million)
Data Table on Israel - Market size and forecast 2024-2029 ($ million)
Chart on Israel - Year-over-year growth 2024-2029 (%)
Data Table on Israel - Year-over-year growth 2024-2029 (%)

12.8 Market opportunity by geography

Market opportunity by geography ($ million)
Data Tables on Market opportunity by geography ($ million)

13. Drivers, Challenges, and Opportunity

13.1 Market drivers

Robust demand from expanding flexible packaging sector
Increasing application in agriculture for enhanced crop yield and protection
Sustained growth in construction and infrastructure development

13.2 Market challenges

Intense competition from alternative polymers and sustainable materials
Volatility in feedstock prices and persistent supply chain vulnerabilities
Stringent environmental regulations and negative public perception

13.3 Impact of drivers and challenges

Impact of drivers and challenges in 2024 and 2029

13.4 Market opportunities

Accelerated shift towards circular economy and sustainable LDPE
Innovation in high-performance and specialized LDPE grades
Integration of digitalization and Industry 4.0 in production

14. Competitive Landscape

14.1 Overview

14.2

Overview on criticality of inputs and factors of differentiation

14.3 Landscape disruption

Overview on factors of disruption

14.4 Industry risks

Impact of key risks on business

15. Competitive Analysis

15.1 Companies profiled

Companies covered

15.2 Company ranking index

15.3 Market positioning of companies

Matrix on companies position and classification

15.4 Borealis AG

Borealis AG - Overview
Borealis AG - Business segments
Borealis AG - Key offerings
Borealis AG - Segment focus
SWOT

15.5 Chevron Phillips Chemical Co.

Chevron Phillips Chemical Co. - Overview
Chevron Phillips Chemical Co. - Product / Service
Chevron Phillips Chemical Co. - Key offerings
SWOT

15.6 Dow Chemical Co.

Dow Chemical Co. - Overview
Dow Chemical Co. - Business segments
Dow Chemical Co. - Key news
Dow Chemical Co. - Key offerings
Dow Chemical Co. - Segment focus
SWOT

15.7 Exxon Mobil Corp.

Exxon Mobil Corp. - Overview
Exxon Mobil Corp. - Product / Service
Exxon Mobil Corp. - Key offerings
SWOT

15.8 INEOS Group Holdings S.A.

INEOS Group Holdings S.A. - Overview
INEOS Group Holdings S.A. - Product / Service
INEOS Group Holdings S.A. - Key news
INEOS Group Holdings S.A. - Key offerings
SWOT

15.9 LG Chem Ltd.

LG Chem Ltd. - Overview
LG Chem Ltd. - Business segments
LG Chem Ltd. - Key news
LG Chem Ltd. - Key offerings
LG Chem Ltd. - Segment focus
SWOT

15.10 Lotte Chemical Corp.

Lotte Chemical Corp. - Overview
Lotte Chemical Corp. - Business segments
Lotte Chemical Corp. - Key news
Lotte Chemical Corp. - Key offerings
Lotte Chemical Corp. - Segment focus
SWOT

15.11 LyondellBasell Industries NV

LyondellBasell Industries NV - Overview
LyondellBasell Industries NV - Business segments
LyondellBasell Industries NV - Key news
LyondellBasell Industries NV - Key offerings
LyondellBasell Industries NV - Segment focus
SWOT

15.12 NOVA Chemicals Corp.

NOVA Chemicals Corp. - Overview
NOVA Chemicals Corp. - Product / Service
NOVA Chemicals Corp. - Key offerings
SWOT

15.13 Qatar Petrochemical Company (QAPCO) Q.P.J.S.C

Qatar Petrochemical Company (QAPCO) Q.P.J.S.C - Overview
Qatar Petrochemical Company (QAPCO) Q.P.J.S.C - Product / Service
Qatar Petrochemical Company (QAPCO) Q.P.J.S.C - Key offerings
SWOT

15.14 Reliance Industries Ltd.

Reliance Industries Ltd. - Overview
Reliance Industries Ltd. - Business segments
Reliance Industries Ltd. - Key news
Reliance Industries Ltd. - Key offerings
Reliance Industries Ltd. - Segment focus
SWOT

15.15 Saudi Basic Industries

Saudi Basic Industries - Overview
Saudi Basic Industries - Business segments
Saudi Basic Industries - Key offerings
Saudi Basic Industries - Segment focus
SWOT

15.16 Tasnee

Tasnee - Overview
Tasnee - Product / Service
Tasnee - Key offerings
SWOT

15.17 TotalEnergies SE

TotalEnergies SE - Overview
TotalEnergies SE - Business segments
TotalEnergies SE - Key news
TotalEnergies SE - Key offerings
TotalEnergies SE - Segment focus
SWOT

15.18 Westlake Corp.

Westlake Corp. - Overview
Westlake Corp. - Business segments
Westlake Corp. - Key offerings
Westlake Corp. - Segment focus
SWOT

16. Appendix

16.1 Scope of the report

Market definition
Objectives
Notes and caveats

16.2 Inclusions and exclusions checklist

Inclusions checklist
Exclusions checklist

16.3 Currency conversion rates for US$

16.4 Research methodology

16.5 Data procurement

Information sources

16.6 Data validation

16.7 Validation techniques employed for market sizing

16.8 Data synthesis

16.9 360 degree market analysis

16.10 List of abbreviations

Research Methodology

Technavio presents a detailed picture of the market by way of study, synthesis, and summation of data from multiple sources. The analysts have presented the various facets of the market with a particular focus on identifying the key industry influencers. The data thus presented is comprehensive, reliable, and the result of extensive research, both primary and secondary.

INFORMATION SOURCES

Primary sources

  • Manufacturers and suppliers
  • Channel partners
  • Industry experts
  • Strategic decision makers

Secondary sources

  • Industry journals and periodicals
  • Government data
  • Financial reports of key industry players
  • Historical data
  • Press releases

DATA ANALYSIS

Data Synthesis

  • Collation of data
  • Estimation of key figures
  • Analysis of derived insights

Data Validation

  • Triangulation with data models
  • Reference against proprietary databases
  • Corroboration with industry experts

REPORT WRITING

Qualitative

  • Market drivers
  • Market challenges
  • Market trends
  • Five forces analysis

Quantitative

  • Market size and forecast
  • Market segmentation
  • Geographical insights
  • Competitive landscape

Interested in this report?

Get your sample now to see our research methodology and insights!

Download Now

Frequently Asked Questions

Low-density Polyethylene (LDPE) market growth will increase by USD 12044.3 million during 2025-2029.

The Low-density Polyethylene (LDPE) market is expected to grow at a CAGR of 4.7% during 2025-2029.

Low-density Polyethylene (LDPE) market is segmented by Manufacturing type (Tubular process, Autoclave process) Application (Packaging, Agriculture, Construction, Electrical and electronics, Others) Grade type (Film grade, Injection molding grade, Extrusion coating grade, Blow molding grade) Distribution channel (Direct sales, Indirect sales)

Borealis AG, Borouge PLC, Braskem SA, Chevron Phillips Chemical Co., Dow Chemical Co., Exxon Mobil Corp., Formosa Plastics Corp., INEOS Group Holdings S.A., LG Chem Ltd., Lotte Chemical Corp., LyondellBasell Industries NV, Mitsui Chemicals Inc., NOVA Chemicals Corp., Qatar Petrochemical Company (QAPCO) Q.P.J.S.C, Reliance Industries Ltd., Saudi Basic Industries, Tasnee, TotalEnergies SE, Westlake Corp. are a few of the key vendors in the Low-density Polyethylene (LDPE) market.

APAC will register the highest growth rate of 50.4% among the other regions. Therefore, the Low-density Polyethylene (LDPE) market in APAC is expected to garner significant business opportunities for the vendors during the forecast period.

China, India, Japan, South Korea, Australia, Indonesia, US, Canada, Mexico, Germany, France, UK, Italy, Spain, The Netherlands, Brazil, Argentina, Colombia, Saudi Arabia, Turkey, UAE, South Africa, Israel

  • Robust demand from expanding flexible packaging sector is the driving factor this market.

The Low-density Polyethylene (LDPE) market vendors should focus on grabbing business opportunities from the Manufacturing type segment as it accounted for the largest market share in the base year.