Luxury Furniture Market Analysis, Size, and Forecast 2026-2030: Europe (Italy, Germany, and France), North America (US, Canada, and Mexico), APAC (China, Japan, and India), South America (Brazil and Argentina), Middle East and Africa (UAE, Saudi Arabia, and South Africa), and Rest of World (ROW)

Luxury Furniture Market Analysis, Size, and Forecast 2026-2030:
Europe (Italy, Germany, and France), North America (US, Canada, and Mexico), APAC (China, Japan, and India), South America (Brazil and Argentina), Middle East and Africa (UAE, Saudi Arabia, and South Africa), and Rest of World (ROW)

Published: Mar 2026 283 Pages SKU: IRTNTR43980

Market Overview at a Glance

$11.91 B
Market Opportunity
5.8%
CAGR 2025 - 2030
39.7%
Europe Growth
$26.71 B
Residential segment 2024

Luxury Furniture Market Size 2026-2030

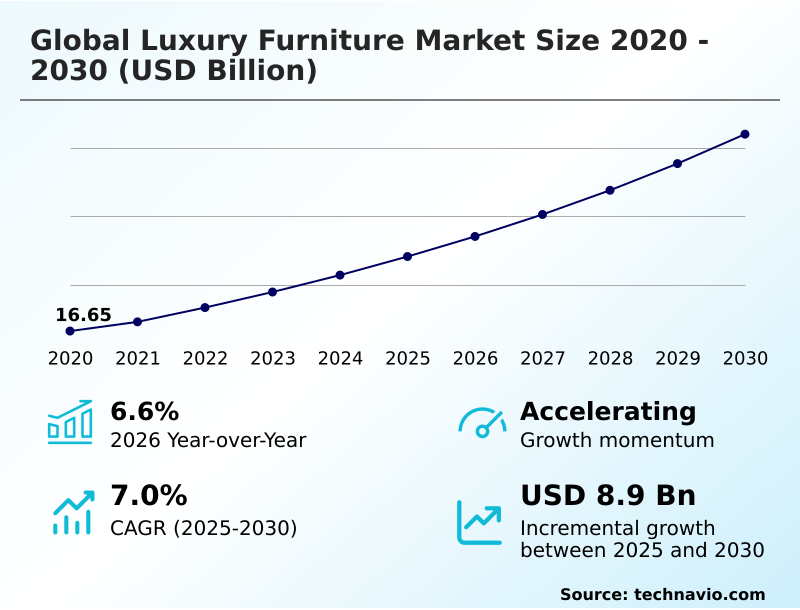
The luxury furniture market size is valued to increase by USD 11.91 billion, at a CAGR of 5.8% from 2025 to 2030. Increasing number of new luxury furniture showroom launches will drive the luxury furniture market.

Major Market Trends & Insights

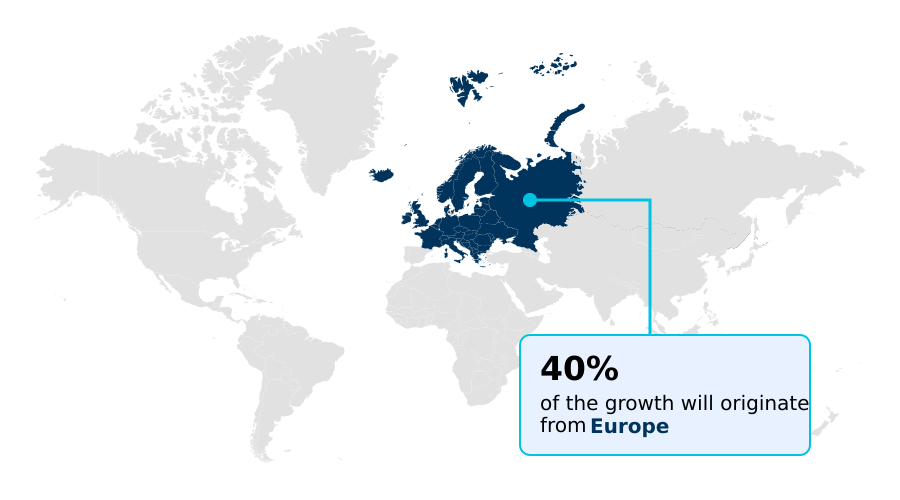
  • Europe dominated the market and accounted for a 39.7% growth during the forecast period.
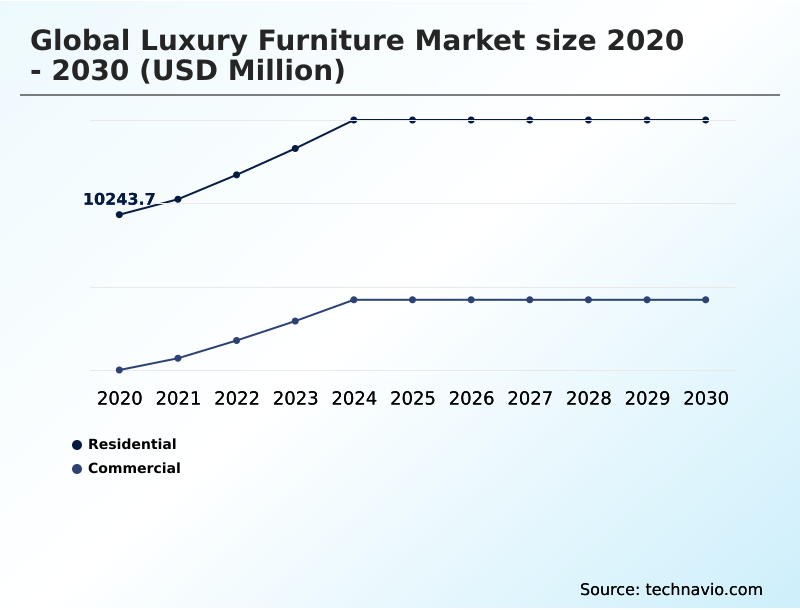
  • By Application - Residential segment was valued at USD 26.71 billion in 2024
  • By Distribution Channel - Offline segment accounted for the largest market revenue share in 2024

Market Size & Forecast

  • Market Opportunities: USD 32.08 billion
  • Market Future Opportunities: USD 11.91 billion
  • CAGR from 2025 to 2030 : 5.8%

Market Summary

  • The luxury furniture market is defined by an emphasis on aesthetic exclusivity and artisanal craftsmanship, catering to a clientele that values heirloom-quality pieces. A significant shift is underway from overt branding to quiet luxury, where the focus is on sustainable materials, premium finishes, and hand-finishing techniques.
  • Innovation is a key dynamic, with smart furniture featuring IoT integration becoming more prevalent, and digital tools like augmented reality and virtual showrooms transforming the phygital retail experience.
  • For instance, a firm specializing in bespoke customization can leverage 3D printing and CNC machining to create complex, ergonomic designs while using a blockchain-backed system to ensure supply chain transparency for ethically sourced wood, metal, and leather.
  • This approach not only enhances the personalized experiences for customers but also streamlines production, meeting demand for both handcrafted furniture and technologically advanced modular sofas. The industry's evolution is shaped by this blend of heritage and forward-thinking technology, from phygital infrastructure in retail to custom ordering platforms that redefine customer engagement.

What will be the Size of the Luxury Furniture Market during the forecast period?

Get Key Insights on Market Forecast (PDF) Request Free Sample

How is the Luxury Furniture Market Segmented?

The luxury furniture industry research report provides comprehensive data (region-wise segment analysis), with forecasts and estimates in "USD million" for the period 2026-2030, as well as historical data from 2020-2024 for the following segments.

  • Application
    • Residential
    • Commercial
  • Distribution channel
    • Offline
    • Online
  • Material
    • Wood
    • Metal
    • Leather
    • Others
  • Geography
    • Europe
      • Italy
      • Germany
      • France
    • North America
      • US
      • Canada
      • Mexico
    • APAC
      • China
      • Japan
      • India
    • South America
      • Brazil
      • Argentina
    • Middle East and Africa
      • UAE
      • Saudi Arabia
      • South Africa
    • Rest of World (ROW)

By Application Insights

The residential segment is estimated to witness significant growth during the forecast period.

The residential segment is the market's primary engine, driven by consumers seeking heirloom-quality pieces and personalized experiences that reflect their values. A clear shift toward quiet luxury is evident, prioritizing handcrafted furniture and aesthetic exclusivity over overt branding.

This is influencing lifestyle branding strategies, compelling manufacturers to focus on circular design and supply chain transparency. The integration of smart furniture is becoming a standard expectation for modern living spaces.

To meet these demands, companies are investing in advanced production, with some achieving a 15% improvement in material efficiency through better design and manufacturing integration, showcasing a commitment to both luxury and responsibility.

Request Free Sample

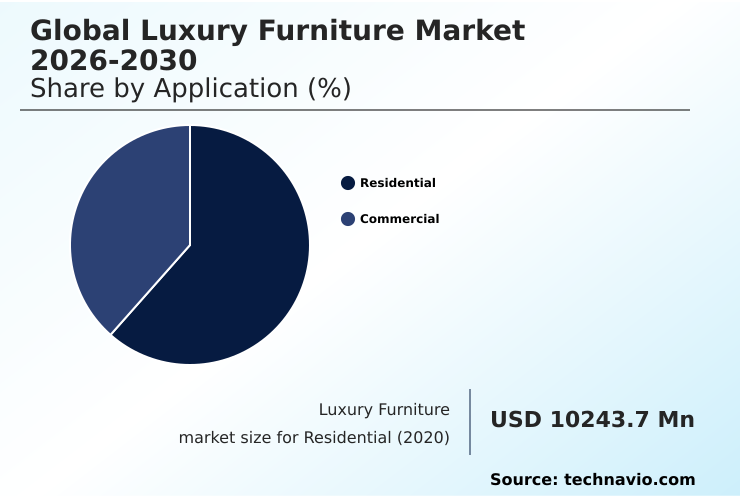
The Residential segment was valued at USD 26.71 billion in 2024 and showed a gradual increase during the forecast period.

Request Free Sample

Regional Analysis

Europe is estimated to contribute 39.7% to the growth of the global market during the forecast period.Technavio’s analysts have elaborately explained the regional trends and drivers that shape the market during the forecast period.

See How Luxury Furniture Market Demand is Rising in Europe Request Free Sample

The market's geography is defined by Europe's dominance, holding 39.7% of the share, built on a rich design heritage and unparalleled artisanal craftsmanship. European brands lead in sustainable sourcing, with nearly 89% of new collections meeting strict eco-design rules.

North America follows, where a 65% expansion in retail square footage highlights investment in phygital infrastructure and experiential showrooms. In APAC, rapid wealth creation fuels demand for collectible design pieces and custom upholstery.

Across regions, there is a universal demand for sustainable materials and ergonomic designs that merge modern aesthetics with comfort and long-term value, reflecting a globally harmonized view of luxury living.
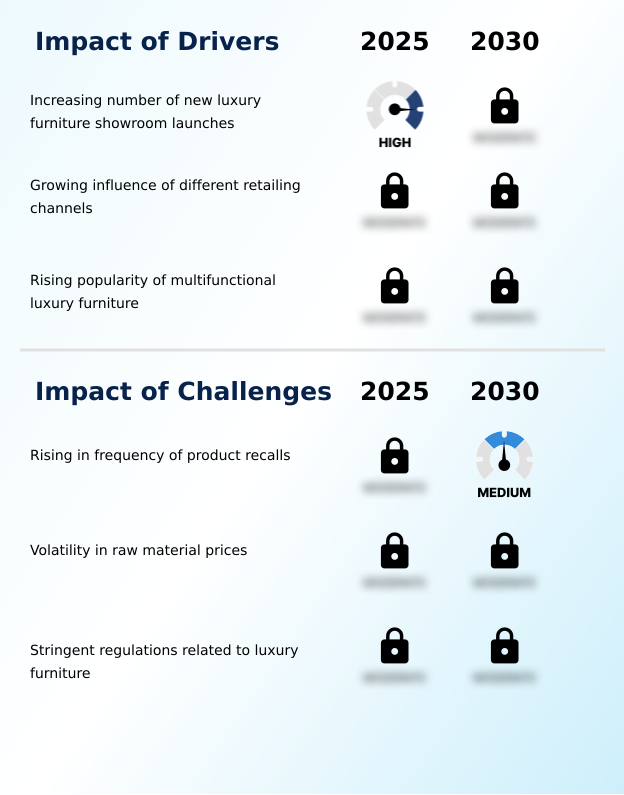
Market Dynamics

Our researchers analyzed the data with 2025 as the base year, along with the key drivers, trends, and challenges. A holistic analysis of drivers will help companies refine their marketing strategies to gain a competitive advantage.

  • The luxury furniture market is navigating a complex landscape of evolving consumer expectations and operational challenges. A critical factor is the impact of raw material volatility on luxury furniture, which pressures manufacturers to innovate supply chains while maintaining quality.
  • Simultaneously, the industry is responding to the demand for multifunctional luxury furniture from millennials, who prioritize space optimization and versatility in urban living environments. This demographic's preferences are also accelerating eco-friendly and organic luxury furniture design trends, pushing brands to adopt sustainable materials and transparent production processes.
  • To meet these demands, companies are embracing luxury furniture design innovation using smart technology, integrating features like IoT connectivity into their products. The role of augmented reality in online furniture retail has become pivotal, allowing customers to visualize high-value items in their homes before purchasing, thereby reducing returns and increasing conversion rates by over 40% compared to static image listings.
  • This digital transformation highlights the importance of omnichannel retailing for luxury brands, as a seamless integration of online platforms and physical showrooms is now essential for delivering the high-touch, personalized experience that luxury consumers expect.

What are the key market drivers leading to the rise in the adoption of Luxury Furniture Industry?

  • The increasing number of new luxury furniture showroom launches is a key driver for market growth.

  • Market growth is propelled by the demand for adaptability and personalization. The rise of multifunctional luxury furniture and modular sofas directly addresses the need for space optimization in modern living spaces.
  • This driver is especially strong in the contract-grade luxury furniture sector, where flexible layouts are key. Bespoke customization remains a primary driver, allowing consumers to tailor premium lifestyle products to their exact specifications, including unique premium finishes.
  • A sophisticated omnichannel approach is crucial for facilitating this customization. Moreover, the seamless IoT integration into furniture enhances functionality, with smart features increasing the perceived value of products by over 25% for tech-savvy buyers.

What are the market trends shaping the Luxury Furniture Industry?

  • A rapid emergence of eco-friendly and organic products is a key upcoming trend in the luxury furniture market. This shift reflects growing consumer demand for sustainability in high-end design.

  • The trend landscape is dominated by sustainability and digitalization. The push for eco-friendly luxury furniture is redefining innovative collections, driving manufacturers to adopt greener processes. Concurrently, the phygital retail experience is being perfected through technology. Augmented reality and virtual showrooms function as powerful digital visualization tools, with some platforms reporting a 40% higher user engagement compared to static galleries.
  • These technologies facilitate custom ordering by allowing clients to visualize intricate designs. Behind the scenes, advanced manufacturing using CNC machining and 3D printing enables the production of these complex, personalized pieces at scale, merging high-tech with high-design.

What challenges does the Luxury Furniture Industry face during its growth?

  • The rising frequency of product recalls presents a key challenge affecting industry growth.

  • Key challenges threaten market stability, primarily from supply chain volatility and the preservation of brand equity. Fluctuating costs for core materials like wood, metal, and leather can impact margins by 10-15% quarterly, complicating financial planning for both experiential retail and luxury e-commerce platforms.
  • A significant operational challenge is the scarcity of artisanal skills, which are essential for the hand-finishing techniques that define luxury. Any failure to deliver a flawless product and exceptional white-glove delivery service can immediately erode consumer trust and damage a brand's reputation, making quality control a critical and ongoing battle.

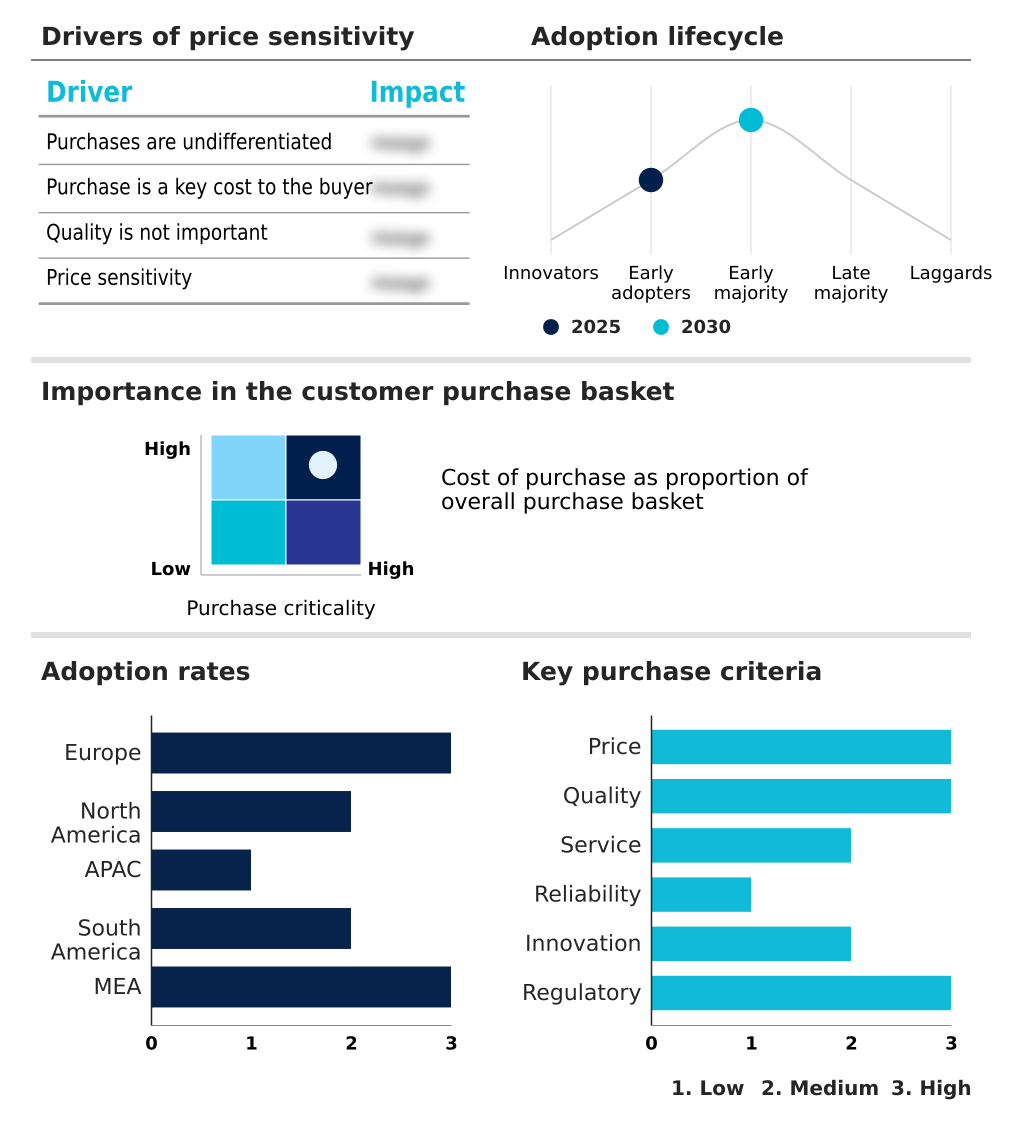
Exclusive Technavio Analysis on Customer Landscape

The luxury furniture market forecasting report includes the adoption lifecycle of the market, covering from the innovator’s stage to the laggard’s stage. It focuses on adoption rates in different regions based on penetration. Furthermore, the luxury furniture market report also includes key purchase criteria and drivers of price sensitivity to help companies evaluate and develop their market growth analysis strategies.

Customer Landscape of Luxury Furniture Industry

Competitive Landscape

Companies are implementing various strategies, such as strategic alliances, luxury furniture market forecast, partnerships, mergers and acquisitions, geographical expansion, and product/service launches, to enhance their presence in the industry.

ANGELO and C. Srl - Provides luxury furniture defined by rigorous shapes and innovative designs, such as sofas with a unique suspension effect achieved through raised metal frames.

The industry research and growth report includes detailed analyses of the competitive landscape of the market and information about key companies, including:

  • ANGELO and C. Srl
  • Club House Italia SpA
  • Eichholtz BV
  • Eric Kuster Metropolitan Ltd.
  • Giorgio Armani SpA
  • Giorgio Collection
  • LONGHI Spa
  • MillerKnoll Inc.
  • Minotti SpA
  • MUEBLES PICO SA
  • Natuzzi SpA
  • Opera Contemporary
  • Reflex Spa
  • Roche Bobois SA
  • Rugiano Srl
  • Silik SRL
  • Vaughan Bassett
  • Williams Sonoma Inc.

Qualitative and quantitative analysis of companies has been conducted to help clients understand the wider business environment as well as the strengths and weaknesses of key industry players. Data is qualitatively analyzed to categorize companies as pure play, category-focused, industry-focused, and diversified; it is quantitatively analyzed to categorize companies as dominant, leading, strong, tentative, and weak.

Recent Development and News in Luxury furniture market

  • In August 2025, Maison Sia, celebrated as India's destination for global luxury home decor, launched its luxury furniture line in India.
  • In September 2025, Sherrill Furniture Co. is set to debut Aure, a new brand showcasing luxury with a lighter touch, at High Point.
  • In March 2025, POS Interiors, a workplace design specialist, introduced its Brands by POS digital platform to streamline high-specification office furniture procurement in the UK.
  • In June 2025, UCUORO entered the Indian market through the Salone concept, opening a luxe gallery of curated furniture.

Dive into Technavio’s robust research methodology, blending expert interviews, extensive data synthesis, and validated models for unparalleled Luxury Furniture Market insights. See full methodology.

Market Scope
Page number 283
Base year 2025
Historic period 2020-2024
Forecast period 2026-2030
Growth momentum & CAGR Accelerate at a CAGR of 5.8%
Market growth 2026-2030 USD 11911.6 million
Market structure Fragmented
YoY growth 2025-2026(%) 5.3%
Key countries Italy, Germany, France, UK, Spain, Switzerland, US, Canada, Mexico, China, Japan, India, South Korea, Australia, Indonesia, Brazil, Argentina, Chile, UAE, Saudi Arabia, South Africa, Egypt and Israel
Competitive landscape Leading Companies, Market Positioning of Companies, Competitive Strategies, and Industry Risks

Request Free Sample

Research Analyst Overview

  • The market is undergoing a significant transformation, balancing artisanal craftsmanship with technological innovation. The core of the industry remains focused on heirloom-quality pieces that offer aesthetic exclusivity through hand-finishing techniques and bespoke customization. However, product strategy at the boardroom level now mandates the integration of smart furniture with IoT integration and the use of sustainable materials.
  • This strategic pivot has led to the adoption of advanced manufacturing like CNC machining and 3D printing for creating ergonomic designs and complex modular sofas. For instance, integrating these technologies has enabled some firms to reduce custom order processing time by 30%.
  • The consumer experience is enhanced by augmented reality and virtual showrooms, creating a phygital infrastructure that supports the trend toward quiet luxury. This requires a mastery of materials, from traditional wood, metal, and leather with premium finishes to innovative eco-friendly alternatives.
  • Success hinges on delivering eco-friendly luxury furniture, including multifunctional luxury furniture and custom upholstery, that resonates with modern consumer values while maintaining the allure of handcrafted furniture.

What are the Key Data Covered in this Luxury Furniture Market Research and Growth Report?

  • What is the expected growth of the Luxury Furniture Market between 2026 and 2030?

    • USD 11.91 billion, at a CAGR of 5.8%

  • What segmentation does the market report cover?

    • The report is segmented by Application (Residential, and Commercial), Distribution Channel (Offline, and Online), Material (Wood, Metal, Leather, and Others) and Geography (Europe, North America, APAC, South America, Middle East and Africa)

  • Which regions are analyzed in the report?

    • Europe, North America, APAC, South America and Middle East and Africa

  • What are the key growth drivers and market challenges?

    • Increasing number of new luxury furniture showroom launches, Rising in frequency of product recalls

  • Who are the major players in the Luxury Furniture Market?

    • ANGELO and C. Srl, Club House Italia SpA, Eichholtz BV, Eric Kuster Metropolitan Ltd., Giorgio Armani SpA, Giorgio Collection, LONGHI Spa, MillerKnoll Inc., Minotti SpA, MUEBLES PICO SA, Natuzzi SpA, Opera Contemporary, Reflex Spa, Roche Bobois SA, Rugiano Srl, Silik SRL, Vaughan Bassett and Williams Sonoma Inc.

Market Research Insights

  • The market's dynamism is driven by a shift toward premium lifestyle products that offer personalized experiences. Brands are curating innovative collections with modern aesthetics to meet evolving tastes. A key dynamic is the omnichannel approach, blending experiential showrooms with luxury e-commerce platforms.
  • For example, leading firms have expanded physical retail square footage by 65% while seeing digital visualization tools like AR boost customer engagement fourfold over traditional online catalogs. Furthermore, sustainable sourcing is non-negotiable, with some European brands reporting that 89% of new products comply with updated eco-design regulations.
  • This focus on supply chain transparency and design heritage reinforces brand equity in a competitive landscape where a phygital retail experience is paramount for success.

We can help! Our analysts can customize this luxury furniture market research report to meet your requirements.

Get in touch

1. Executive Summary

1.1 Market overview

Executive Summary - Chart on Market Overview
Executive Summary - Data Table on Market Overview
Executive Summary - Chart on Global Market Characteristics
Executive Summary - Chart on Market by Geography
Executive Summary - Chart on Market Segmentation by Application
Executive Summary - Chart on Market Segmentation by Distribution Channel
Executive Summary - Chart on Market Segmentation by Material
Executive Summary - Chart on Incremental Growth
Executive Summary - Data Table on Incremental Growth
Executive Summary - Chart on Company Market Positioning

2. Technavio Analysis

2.1 Analysis of price sensitivity, lifecycle, customer purchase basket, adoption rates, and purchase criteria

2.2 Criticality of inputs and Factors of differentiation

Chart on Overview on criticality of inputs and factors of differentiation

2.3 Factors of disruption

Chart on Overview on factors of disruption

2.4 Impact of drivers and challenges

Chart on Impact of drivers and challenges in 2025 and 2030

3. Market Landscape

3.1 Market ecosystem

Chart on Parent Market
Data Table on - Parent Market

3.2 Market characteristics

Chart on Market characteristics analysis

3.3 Value chain analysis

Chart on Value chain analysis

4. Market Sizing

4.1 Market definition

Data Table on Offerings of companies included in the market definition

4.2 Market segment analysis

Market segments

4.3 Market size 2025

4.4 Market outlook: Forecast for 2025-2030

Chart on Global - Market size and forecast 2025-2030 ($ million)
Data Table on Global - Market size and forecast 2025-2030 ($ million)
Chart on Global Market: Year-over-year growth 2025-2030 (%)
Data Table on Global Market: Year-over-year growth 2025-2030 (%)

5. Historic Market Size

5.1 Global Luxury Furniture Market 2020 - 2024

Historic Market Size - Data Table on Global Luxury Furniture Market 2020 - 2024 ($ million)

5.2 Application segment analysis 2020 - 2024

Historic Market Size - Application Segment 2020 - 2024 ($ million)

5.3 Distribution Channel segment analysis 2020 - 2024

Historic Market Size - Distribution Channel Segment 2020 - 2024 ($ million)

5.4 Material segment analysis 2020 - 2024

Historic Market Size - Material Segment 2020 - 2024 ($ million)

5.5 Geography segment analysis 2020 - 2024

Historic Market Size - Geography Segment 2020 - 2024 ($ million)

5.6 Country segment analysis 2020 - 2024

Historic Market Size - Country Segment 2020 - 2024 ($ million)

6. Qualitative Analysis

6.1 Impact of AI in global luxury furniture market

7. Five Forces Analysis

7.1 Five forces summary

Five forces analysis - Comparison between 2025 and 2030

7.2 Bargaining power of buyers

Bargaining power of buyers - Impact of key factors 2025 and 2030

7.3 Bargaining power of suppliers

Bargaining power of suppliers - Impact of key factors in 2025 and 2030

7.4 Threat of new entrants

Threat of new entrants - Impact of key factors in 2025 and 2030

7.5 Threat of substitutes

Threat of substitutes - Impact of key factors in 2025 and 2030

7.6 Threat of rivalry

Threat of rivalry - Impact of key factors in 2025 and 2030

7.7 Market condition

Chart on Market condition - Five forces 2025 and 2030

8. Market Segmentation by Application

8.1 Market segments

Chart on Application - Market share 2025-2030 (%)
Data Table on Application - Market share 2025-2030 (%)

8.2 Comparison by Application

Chart on Comparison by Application
Data Table on Comparison by Application

8.3 Residential - Market size and forecast 2025-2030

Chart on Residential - Market size and forecast 2025-2030 ($ million)
Data Table on Residential - Market size and forecast 2025-2030 ($ million)
Chart on Residential - Year-over-year growth 2025-2030 (%)
Data Table on Residential - Year-over-year growth 2025-2030 (%)

8.4 Commercial - Market size and forecast 2025-2030

Chart on Commercial - Market size and forecast 2025-2030 ($ million)
Data Table on Commercial - Market size and forecast 2025-2030 ($ million)
Chart on Commercial - Year-over-year growth 2025-2030 (%)
Data Table on Commercial - Year-over-year growth 2025-2030 (%)

8.5 Market opportunity by Application

Market opportunity by Application ($ million)
Data Table on Market opportunity by Application ($ million)

9. Market Segmentation by Distribution Channel

9.1 Market segments

Chart on Distribution Channel - Market share 2025-2030 (%)
Data Table on Distribution Channel - Market share 2025-2030 (%)

9.2 Comparison by Distribution Channel

Chart on Comparison by Distribution Channel
Data Table on Comparison by Distribution Channel

9.3 Offline - Market size and forecast 2025-2030

Chart on Offline - Market size and forecast 2025-2030 ($ million)
Data Table on Offline - Market size and forecast 2025-2030 ($ million)
Chart on Offline - Year-over-year growth 2025-2030 (%)
Data Table on Offline - Year-over-year growth 2025-2030 (%)

9.4 Online - Market size and forecast 2025-2030

Chart on Online - Market size and forecast 2025-2030 ($ million)
Data Table on Online - Market size and forecast 2025-2030 ($ million)
Chart on Online - Year-over-year growth 2025-2030 (%)
Data Table on Online - Year-over-year growth 2025-2030 (%)

9.5 Market opportunity by Distribution Channel

Market opportunity by Distribution Channel ($ million)
Data Table on Market opportunity by Distribution Channel ($ million)

10. Market Segmentation by Material

10.1 Market segments

Chart on Material - Market share 2025-2030 (%)
Data Table on Material - Market share 2025-2030 (%)

10.2 Comparison by Material

Chart on Comparison by Material
Data Table on Comparison by Material

10.3 Wood - Market size and forecast 2025-2030

Chart on Wood - Market size and forecast 2025-2030 ($ million)
Data Table on Wood - Market size and forecast 2025-2030 ($ million)
Chart on Wood - Year-over-year growth 2025-2030 (%)
Data Table on Wood - Year-over-year growth 2025-2030 (%)

10.4 Metal - Market size and forecast 2025-2030

Chart on Metal - Market size and forecast 2025-2030 ($ million)
Data Table on Metal - Market size and forecast 2025-2030 ($ million)
Chart on Metal - Year-over-year growth 2025-2030 (%)
Data Table on Metal - Year-over-year growth 2025-2030 (%)

10.5 Leather - Market size and forecast 2025-2030

Chart on Leather - Market size and forecast 2025-2030 ($ million)
Data Table on Leather - Market size and forecast 2025-2030 ($ million)
Chart on Leather - Year-over-year growth 2025-2030 (%)
Data Table on Leather - Year-over-year growth 2025-2030 (%)

10.6 Others - Market size and forecast 2025-2030

Chart on Others - Market size and forecast 2025-2030 ($ million)
Data Table on Others - Market size and forecast 2025-2030 ($ million)
Chart on Others - Year-over-year growth 2025-2030 (%)
Data Table on Others - Year-over-year growth 2025-2030 (%)

10.7 Market opportunity by Material

Market opportunity by Material ($ million)
Data Table on Market opportunity by Material ($ million)

11. Customer Landscape

11.1 Customer landscape overview

Analysis of price sensitivity, lifecycle, customer purchase basket, adoption rates, and purchase criteria

12. Geographic Landscape

12.1 Geographic segmentation

Chart on Market share by geography 2025-2030 (%)
Data Table on Market share by geography 2025-2030 (%)

12.2 Geographic comparison

Chart on Geographic comparison
Data Table on Geographic comparison

12.3 Europe - Market size and forecast 2025-2030

Chart on Europe - Market size and forecast 2025-2030 ($ million)
Data Table on Europe - Market size and forecast 2025-2030 ($ million)
Chart on Europe - Year-over-year growth 2025-2030 (%)
Data Table on Europe - Year-over-year growth 2025-2030 (%)
Chart on Regional Comparison - Europe
Data Table on Regional Comparison - Europe

12.3.1 Italy - Market size and forecast 2025-2030

Chart on Italy - Market size and forecast 2025-2030 ($ million)
Data Table on Italy - Market size and forecast 2025-2030 ($ million)
Chart on Italy - Year-over-year growth 2025-2030 (%)
Data Table on Italy - Year-over-year growth 2025-2030 (%)

12.3.2 Germany - Market size and forecast 2025-2030

Chart on Germany - Market size and forecast 2025-2030 ($ million)
Data Table on Germany - Market size and forecast 2025-2030 ($ million)
Chart on Germany - Year-over-year growth 2025-2030 (%)
Data Table on Germany - Year-over-year growth 2025-2030 (%)

12.3.3 France - Market size and forecast 2025-2030

Chart on France - Market size and forecast 2025-2030 ($ million)
Data Table on France - Market size and forecast 2025-2030 ($ million)
Chart on France - Year-over-year growth 2025-2030 (%)
Data Table on France - Year-over-year growth 2025-2030 (%)

12.3.4 UK - Market size and forecast 2025-2030

Chart on UK - Market size and forecast 2025-2030 ($ million)
Data Table on UK - Market size and forecast 2025-2030 ($ million)
Chart on UK - Year-over-year growth 2025-2030 (%)
Data Table on UK - Year-over-year growth 2025-2030 (%)

12.3.5 Spain - Market size and forecast 2025-2030

Chart on Spain - Market size and forecast 2025-2030 ($ million)
Data Table on Spain - Market size and forecast 2025-2030 ($ million)
Chart on Spain - Year-over-year growth 2025-2030 (%)
Data Table on Spain - Year-over-year growth 2025-2030 (%)

12.3.6 Switzerland - Market size and forecast 2025-2030

Chart on Switzerland - Market size and forecast 2025-2030 ($ million)
Data Table on Switzerland - Market size and forecast 2025-2030 ($ million)
Chart on Switzerland - Year-over-year growth 2025-2030 (%)
Data Table on Switzerland - Year-over-year growth 2025-2030 (%)

12.4 North America - Market size and forecast 2025-2030

Chart on North America - Market size and forecast 2025-2030 ($ million)
Data Table on North America - Market size and forecast 2025-2030 ($ million)
Chart on North America - Year-over-year growth 2025-2030 (%)
Data Table on North America - Year-over-year growth 2025-2030 (%)
Chart on Regional Comparison - North America
Data Table on Regional Comparison - North America

12.4.1 US - Market size and forecast 2025-2030

Chart on US - Market size and forecast 2025-2030 ($ million)
Data Table on US - Market size and forecast 2025-2030 ($ million)
Chart on US - Year-over-year growth 2025-2030 (%)
Data Table on US - Year-over-year growth 2025-2030 (%)

12.4.2 Canada - Market size and forecast 2025-2030

Chart on Canada - Market size and forecast 2025-2030 ($ million)
Data Table on Canada - Market size and forecast 2025-2030 ($ million)
Chart on Canada - Year-over-year growth 2025-2030 (%)
Data Table on Canada - Year-over-year growth 2025-2030 (%)

12.4.3 Mexico - Market size and forecast 2025-2030

Chart on Mexico - Market size and forecast 2025-2030 ($ million)
Data Table on Mexico - Market size and forecast 2025-2030 ($ million)
Chart on Mexico - Year-over-year growth 2025-2030 (%)
Data Table on Mexico - Year-over-year growth 2025-2030 (%)

12.5 APAC - Market size and forecast 2025-2030

Chart on APAC - Market size and forecast 2025-2030 ($ million)
Data Table on APAC - Market size and forecast 2025-2030 ($ million)
Chart on APAC - Year-over-year growth 2025-2030 (%)
Data Table on APAC - Year-over-year growth 2025-2030 (%)
Chart on Regional Comparison - APAC
Data Table on Regional Comparison - APAC

12.5.1 China - Market size and forecast 2025-2030

Chart on China - Market size and forecast 2025-2030 ($ million)
Data Table on China - Market size and forecast 2025-2030 ($ million)
Chart on China - Year-over-year growth 2025-2030 (%)
Data Table on China - Year-over-year growth 2025-2030 (%)

12.5.2 Japan - Market size and forecast 2025-2030

Chart on Japan - Market size and forecast 2025-2030 ($ million)
Data Table on Japan - Market size and forecast 2025-2030 ($ million)
Chart on Japan - Year-over-year growth 2025-2030 (%)
Data Table on Japan - Year-over-year growth 2025-2030 (%)

12.5.3 India - Market size and forecast 2025-2030

Chart on India - Market size and forecast 2025-2030 ($ million)
Data Table on India - Market size and forecast 2025-2030 ($ million)
Chart on India - Year-over-year growth 2025-2030 (%)
Data Table on India - Year-over-year growth 2025-2030 (%)

12.5.4 South Korea - Market size and forecast 2025-2030

Chart on South Korea - Market size and forecast 2025-2030 ($ million)
Data Table on South Korea - Market size and forecast 2025-2030 ($ million)
Chart on South Korea - Year-over-year growth 2025-2030 (%)
Data Table on South Korea - Year-over-year growth 2025-2030 (%)

12.5.5 Australia - Market size and forecast 2025-2030

Chart on Australia - Market size and forecast 2025-2030 ($ million)
Data Table on Australia - Market size and forecast 2025-2030 ($ million)
Chart on Australia - Year-over-year growth 2025-2030 (%)
Data Table on Australia - Year-over-year growth 2025-2030 (%)

12.5.6 Indonesia - Market size and forecast 2025-2030

Chart on Indonesia - Market size and forecast 2025-2030 ($ million)
Data Table on Indonesia - Market size and forecast 2025-2030 ($ million)
Chart on Indonesia - Year-over-year growth 2025-2030 (%)
Data Table on Indonesia - Year-over-year growth 2025-2030 (%)

12.6 South America - Market size and forecast 2025-2030

Chart on South America - Market size and forecast 2025-2030 ($ million)
Data Table on South America - Market size and forecast 2025-2030 ($ million)
Chart on South America - Year-over-year growth 2025-2030 (%)
Data Table on South America - Year-over-year growth 2025-2030 (%)
Chart on Regional Comparison - South America
Data Table on Regional Comparison - South America

12.6.1 Brazil - Market size and forecast 2025-2030

Chart on Brazil - Market size and forecast 2025-2030 ($ million)
Data Table on Brazil - Market size and forecast 2025-2030 ($ million)
Chart on Brazil - Year-over-year growth 2025-2030 (%)
Data Table on Brazil - Year-over-year growth 2025-2030 (%)

12.6.2 Argentina - Market size and forecast 2025-2030

Chart on Argentina - Market size and forecast 2025-2030 ($ million)
Data Table on Argentina - Market size and forecast 2025-2030 ($ million)
Chart on Argentina - Year-over-year growth 2025-2030 (%)
Data Table on Argentina - Year-over-year growth 2025-2030 (%)

12.6.3 Chile - Market size and forecast 2025-2030

Chart on Chile - Market size and forecast 2025-2030 ($ million)
Data Table on Chile - Market size and forecast 2025-2030 ($ million)
Chart on Chile - Year-over-year growth 2025-2030 (%)
Data Table on Chile - Year-over-year growth 2025-2030 (%)

12.7 Middle East and Africa - Market size and forecast 2025-2030

Chart on Middle East and Africa - Market size and forecast 2025-2030 ($ million)
Data Table on Middle East and Africa - Market size and forecast 2025-2030 ($ million)
Chart on Middle East and Africa - Year-over-year growth 2025-2030 (%)
Data Table on Middle East and Africa - Year-over-year growth 2025-2030 (%)
Chart on Regional Comparison - Middle East and Africa
Data Table on Regional Comparison - Middle East and Africa

12.7.1 UAE - Market size and forecast 2025-2030

Chart on UAE - Market size and forecast 2025-2030 ($ million)
Data Table on UAE - Market size and forecast 2025-2030 ($ million)
Chart on UAE - Year-over-year growth 2025-2030 (%)
Data Table on UAE - Year-over-year growth 2025-2030 (%)

12.7.2 Saudi Arabia - Market size and forecast 2025-2030

Chart on Saudi Arabia - Market size and forecast 2025-2030 ($ million)
Data Table on Saudi Arabia - Market size and forecast 2025-2030 ($ million)
Chart on Saudi Arabia - Year-over-year growth 2025-2030 (%)
Data Table on Saudi Arabia - Year-over-year growth 2025-2030 (%)

12.7.3 South Africa - Market size and forecast 2025-2030

Chart on South Africa - Market size and forecast 2025-2030 ($ million)
Data Table on South Africa - Market size and forecast 2025-2030 ($ million)
Chart on South Africa - Year-over-year growth 2025-2030 (%)
Data Table on South Africa - Year-over-year growth 2025-2030 (%)

12.7.4 Egypt - Market size and forecast 2025-2030

Chart on Egypt - Market size and forecast 2025-2030 ($ million)
Data Table on Egypt - Market size and forecast 2025-2030 ($ million)
Chart on Egypt - Year-over-year growth 2025-2030 (%)
Data Table on Egypt - Year-over-year growth 2025-2030 (%)

12.7.5 Israel - Market size and forecast 2025-2030

Chart on Israel - Market size and forecast 2025-2030 ($ million)
Data Table on Israel - Market size and forecast 2025-2030 ($ million)
Chart on Israel - Year-over-year growth 2025-2030 (%)
Data Table on Israel - Year-over-year growth 2025-2030 (%)

12.8 Market opportunity by geography

Market opportunity by geography ($ million)
Data Tables on Market opportunity by geography ($ million)

13. Drivers, Challenges, and Opportunity

13.1 Market drivers

Increasing number of new luxury furniture showroom launches
Growing influence of different retailing channels
Rising popularity of multifunctional luxury furniture

13.2 Market challenges

Rising in frequency of product recalls
Volatility in raw material prices of furniture
Stringent regulations related to luxury furniture

13.3 Impact of drivers and challenges

Impact of drivers and challenges in 2025 and 2030

13.4 Market opportunities

Rapid emergence of eco-friendly and organic luxury furniture
Growth in demand for luxury furniture among millennials
Innovation-driven transformation in luxury furniture design

14. Competitive Landscape

14.1 Overview

14.2

Overview on criticality of inputs and factors of differentiation

14.3 Landscape disruption

Overview on factors of disruption

14.4 Industry risks

Impact of key risks on business

15. Competitive Analysis

15.1 Companies profiled

Companies covered

15.2 Company ranking index

15.3 Market positioning of companies

Matrix on companies position and classification

15.4 ANGELO and C. Srl

ANGELO and C. Srl - Overview
ANGELO and C. Srl - Product / Service
ANGELO and C. Srl - Key offerings
SWOT

15.5 Club House Italia SpA

Club House Italia SpA - Overview
Club House Italia SpA - Product / Service
Club House Italia SpA - Key offerings
SWOT

15.6 Eichholtz BV

Eichholtz BV - Overview
Eichholtz BV - Product / Service
Eichholtz BV - Key offerings
SWOT

15.7 Eric Kuster Metropolitan Ltd.

Eric Kuster Metropolitan Ltd. - Overview
Eric Kuster Metropolitan Ltd. - Product / Service
Eric Kuster Metropolitan Ltd. - Key offerings
SWOT

15.8 Giorgio Armani SpA

Giorgio Armani SpA - Overview
Giorgio Armani SpA - Product / Service
Giorgio Armani SpA - Key offerings
SWOT

15.9 Giorgio Collection

Giorgio Collection - Overview
Giorgio Collection - Product / Service
Giorgio Collection - Key offerings
SWOT

15.10 MillerKnoll Inc.

MillerKnoll Inc. - Overview
MillerKnoll Inc. - Business segments
MillerKnoll Inc. - Key offerings
MillerKnoll Inc. - Segment focus
SWOT

15.11 Minotti SpA

Minotti SpA - Overview
Minotti SpA - Product / Service
Minotti SpA - Key offerings
SWOT

15.12 MUEBLES PICO SA

MUEBLES PICO SA - Overview
MUEBLES PICO SA - Product / Service
MUEBLES PICO SA - Key offerings
SWOT

15.13 Natuzzi SpA

Natuzzi SpA - Overview
Natuzzi SpA - Business segments
Natuzzi SpA - Key offerings
Natuzzi SpA - Segment focus
SWOT

15.14 Opera Contemporary

Opera Contemporary - Overview
Opera Contemporary - Product / Service
Opera Contemporary - Key offerings
SWOT

15.15 Reflex Spa

Reflex Spa - Overview
Reflex Spa - Product / Service
Reflex Spa - Key offerings
SWOT

15.16 Rugiano Srl

Rugiano Srl - Overview
Rugiano Srl - Product / Service
Rugiano Srl - Key offerings
SWOT

15.17 Silik SRL

Silik SRL - Overview
Silik SRL - Product / Service
Silik SRL - Key offerings
SWOT

15.18 Williams Sonoma Inc.

Williams Sonoma Inc. - Overview
Williams Sonoma Inc. - Product / Service
Williams Sonoma Inc. - Key offerings
SWOT

16. Appendix

16.1 Scope of the report

Market definition
Objectives
Notes and caveats

16.2 Inclusions and exclusions checklist

Inclusions checklist
Exclusions checklist

16.3 Currency conversion rates for US$

16.4 Research methodology

16.5 Data procurement

Information sources

16.6 Data validation

16.7 Validation techniques employed for market sizing

16.8 Data synthesis

16.9 360 degree market analysis

16.10 List of abbreviations

Research Methodology

Technavio presents a detailed picture of the market by way of study, synthesis, and summation of data from multiple sources. The analysts have presented the various facets of the market with a particular focus on identifying the key industry influencers. The data thus presented is comprehensive, reliable, and the result of extensive research, both primary and secondary.

INFORMATION SOURCES

Primary sources

  • Manufacturers and suppliers
  • Channel partners
  • Industry experts
  • Strategic decision makers

Secondary sources

  • Industry journals and periodicals
  • Government data
  • Financial reports of key industry players
  • Historical data
  • Press releases

DATA ANALYSIS

Data Synthesis

  • Collation of data
  • Estimation of key figures
  • Analysis of derived insights

Data Validation

  • Triangulation with data models
  • Reference against proprietary databases
  • Corroboration with industry experts

REPORT WRITING

Qualitative

  • Market drivers
  • Market challenges
  • Market trends
  • Five forces analysis

Quantitative

  • Market size and forecast
  • Market segmentation
  • Geographical insights
  • Competitive landscape

Interested in this report?

Get your sample now to see our research methodology and insights!

Download Now

Frequently Asked Questions

Luxury Furniture market growth will increase by USD 11911.6 million during 2026-2030.

The Luxury Furniture market is expected to grow at a CAGR of 5.8% during 2026-2030.

Luxury Furniture market is segmented by Application (Residential, Commercial) Distribution channel (Offline, Online) Material (Wood, Metal, Leather, Others)

ANGELO and C. Srl, Club House Italia SpA, Eichholtz BV, Eric Kuster Metropolitan Ltd., Giorgio Armani SpA, Giorgio Collection, LONGHI Spa, MillerKnoll Inc., Minotti SpA, MUEBLES PICO SA, Natuzzi SpA, Opera Contemporary, Reflex Spa, Roche Bobois SA, Rugiano Srl, Silik SRL, Vaughan Bassett, Williams Sonoma Inc. are a few of the key vendors in the Luxury Furniture market.

Europe will register the highest growth rate of 39.7% among the other regions. Therefore, the Luxury Furniture market in Europe is expected to garner significant business opportunities for the vendors during the forecast period.

Italy, Germany, France, UK, Spain, Switzerland, US, Canada, Mexico, China, Japan, India, South Korea, Australia, Indonesia, Brazil, Argentina, Chile, UAE, Saudi Arabia, South Africa, Egypt, Israel

  • Increasing number of new luxury furniture showroom launches is the driving factor this market.

The Luxury Furniture market vendors should focus on grabbing business opportunities from the Application segment as it accounted for the largest market share in the base year.
RIA - Research AI Assistant
Ask RIA