Upholstered Furniture Market Analysis, Size, and Forecast 2026-2030: APAC (China, Japan, and India), North America (US, Canada, and Mexico), Europe (Germany, UK, and France), South America (Brazil and Argentina), Middle East and Africa (Saudi Arabia, UAE, and South Africa), and Rest of World (ROW)

Upholstered Furniture Market Analysis, Size, and Forecast 2026-2030:
APAC (China, Japan, and India), North America (US, Canada, and Mexico), Europe (Germany, UK, and France), South America (Brazil and Argentina), Middle East and Africa (Saudi Arabia, UAE, and South Africa), and Rest of World (ROW)

Published: Mar 2026 282 Pages SKU: IRTNTR74138

Market Overview at a Glance

$18.71 B
Market Opportunity
5%
CAGR 2025 - 2030
47.5%
APAC Growth
$44.69 B
Offline segment 2024

Upholstered Furniture Market Size 2026-2030

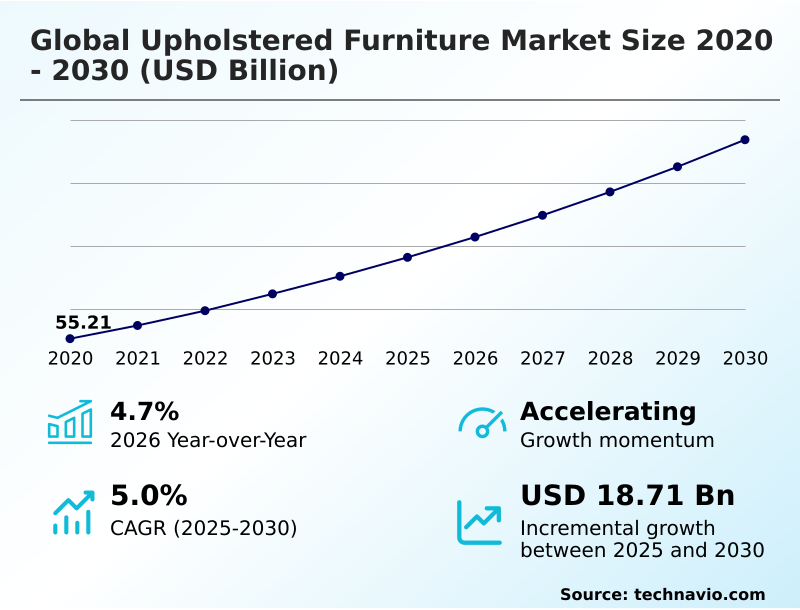
The upholstered furniture market size is valued to increase by USD 18.71 billion, at a CAGR of 5% from 2025 to 2030. Growing influence of different retailing channels will drive the upholstered furniture market.

Major Market Trends & Insights

  • APAC dominated the market and accounted for a 47.5% growth during the forecast period.
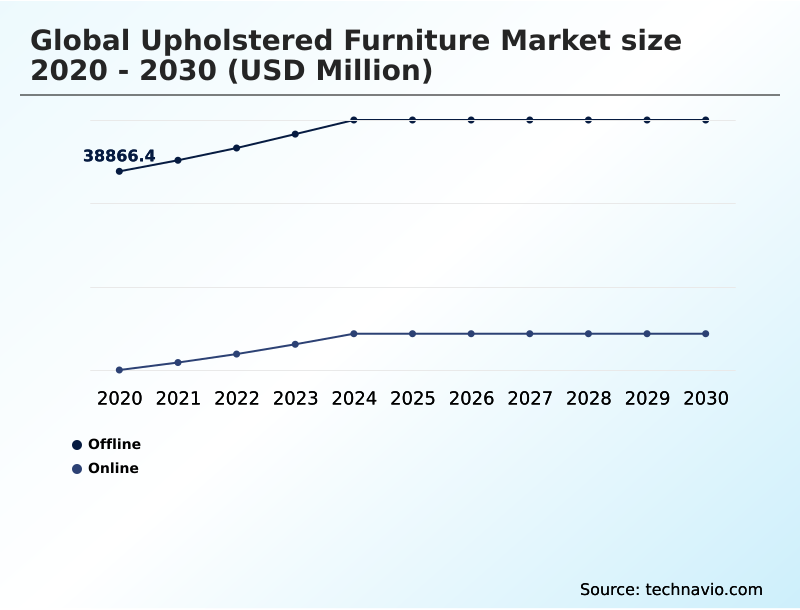
  • By Distribution Channel - Offline segment was valued at USD 44.69 billion in 2024
  • By Type - Sofas and chairs segment accounted for the largest market revenue share in 2024

Market Size & Forecast

  • Market Opportunities: USD 31.66 billion
  • Market Future Opportunities: USD 18.71 billion
  • CAGR from 2025 to 2030 : 5%

Market Summary

  • The upholstered furniture market is undergoing a significant transformation, driven by shifting consumer lifestyles and technological advancements. Demand is growing for products that offer both aesthetic appeal and functional versatility, such as modular sectionals and custom-crafted upholstered furniture that can be adapted to various living spaces.
  • Central to this evolution is the emphasis on ergonomic support, as the line between home and office continues to blur. The adoption of omnichannel retailing strategies has become critical, allowing consumers to seamlessly transition from online discovery, often enhanced with augmented reality tools, to in-person product evaluation.
  • In response to heightened environmental awareness, manufacturers are increasingly adopting green manufacturing standards and exploring circular economy models. This involves using sustainable materials like high-performance synthetic fabrics made from recycled content and ensuring supply chain traceability.
  • A key business scenario involves optimizing logistics for bulky items, where advanced analytics can reduce delivery-related costs by up to 15%, improving both profitability and customer satisfaction. This focus on sustainability, customization, and integrated technology defines the modern market, pushing companies to innovate beyond traditional product design and toward creating tech-integrated living environments.

What will be the Size of the Upholstered Furniture Market during the forecast period?

Get Key Insights on Market Forecast (PDF) Request Free Sample

How is the Upholstered Furniture Market Segmented?

The upholstered furniture industry research report provides comprehensive data (region-wise segment analysis), with forecasts and estimates in "USD million" for the period 2026-2030, as well as historical data from 2020-2024 for the following segments.

  • Distribution channel
    • Offline
    • Online
  • Type
    • Sofas and chairs
    • Beds and mattresses
    • Others
  • End-user
    • Residentials
    • Commercials
  • Geography
    • APAC
      • China
      • Japan
      • India
    • North America
      • US
      • Canada
      • Mexico
    • Europe
      • Germany
      • UK
      • France
    • South America
      • Brazil
      • Argentina
    • Middle East and Africa
      • Saudi Arabia
      • UAE
      • South Africa
    • Rest of World (ROW)

By Distribution Channel Insights

The offline segment is estimated to witness significant growth during the forecast period.

The offline segment remains pivotal, anchored by the consumer need for tactile product evaluation. Physical retail environments, evolving into experience-oriented spaces, allow customers to assess materials like polyurethane foam and the quality of ergonomic support firsthand.

These urban-centric showrooms provide an immersive brand experience through curated living concepts and personalized design support, which digital platforms cannot fully replicate.

This channel is crucial for custom-crafted upholstered furniture and high-value modular sofas, where white-glove delivery services add significant value.

Integration within an omnichannel retailing strategy solidifies the physical store’s role, with analysis showing that such integrated journeys boost conversion rates by over 15% by bridging online discovery with in-person validation.

Request Free Sample

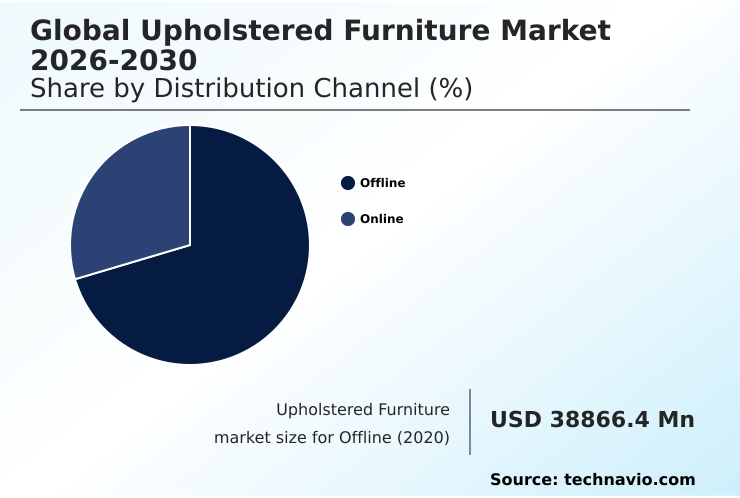
The Offline segment was valued at USD 44.69 billion in 2024 and showed a gradual increase during the forecast period.

Request Free Sample

Regional Analysis

APAC is estimated to contribute 47.5% to the growth of the global market during the forecast period.Technavio’s analysts have elaborately explained the regional trends and drivers that shape the market during the forecast period.

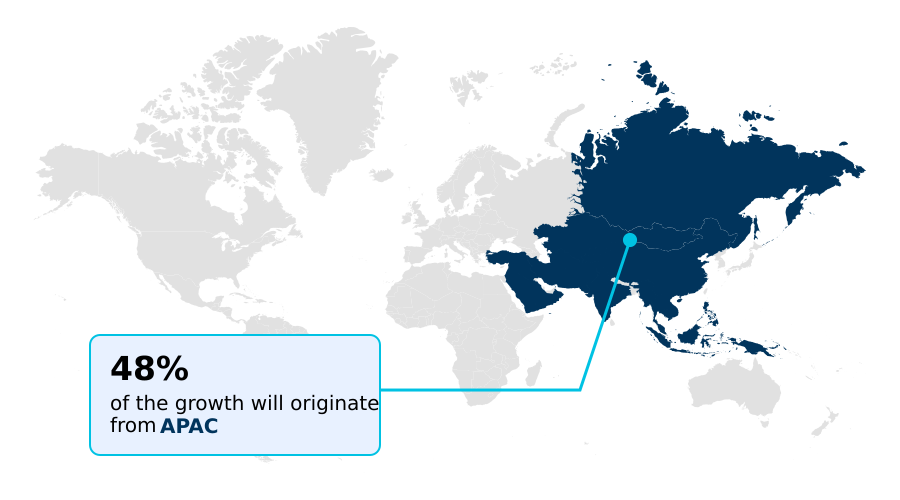
See How Upholstered Furniture Market Demand is Rising in APAC Request Free Sample

The geographic landscape is shaped by regional dynamics, with APAC leading due to rapid expansion in residential infrastructure. High-growth urban centers drive demand for solutions tailored to micro-apartment living, fueling material-based segmentation.

In North America and Europe, the focus is on premium, long-term household assets, with handcrafted solid wood furniture and advanced power motion seating gaining share.

The commercial sector, particularly boutique hotel furnishing and co-working space design, demands durable, high-traffic seating solutions.

Across regions, technology adoption is a key differentiator; augmented reality tools are now used in over 30% of leading online furniture retailers, while manufacturing innovations like smart leather marking and precision cutting improve material efficiency.

Features like embedded wireless charging are becoming standard.

Market Dynamics

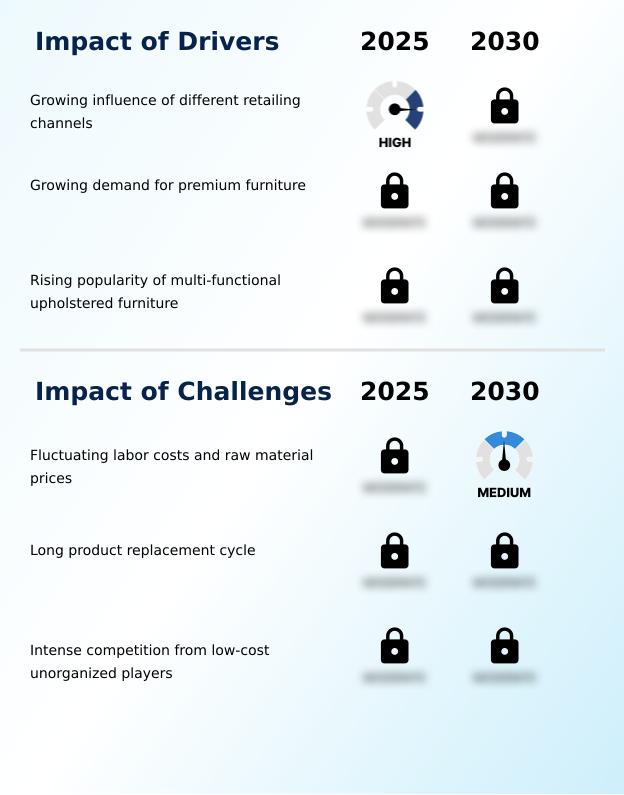
Our researchers analyzed the data with 2025 as the base year, along with the key drivers, trends, and challenges. A holistic analysis of drivers will help companies refine their marketing strategies to gain a competitive advantage.

  • Strategic analysis of the upholstered furniture market reveals distinct regional and segmental dynamics. The sofas and chairs segment growth remains robust, closely followed by emerging beds and mattresses market trends. A key consideration for businesses is the offline versus online furniture retail dichotomy, where creating a seamless experience is paramount.
  • The market is largely driven by residential upholstered furniture demand, but commercial upholstered furniture applications in hospitality and corporate sectors present significant opportunities. A major trend influencing production is the eco-friendly furniture manufacturing process, which aligns with consumer interest in sustainable upholstery material sourcing. This is particularly relevant for multifunctional furniture for urban homes, a rapidly expanding category.
  • Understanding premium furniture market drivers is essential for profitability, as is mitigating the impact of raw material prices through efficient upholstered furniture supply chain logistics.
  • Technological integration is a key differentiator, exemplified by the smart sofa with wireless charging and the rising demand for ergonomic home office chair design, which have seen adoption rates increase by over 40% in the last two years. Innovations like augmented reality in furniture retail and options for modular sectional sofa customization are reshaping customer interactions.
  • Core industry shifts toward a circular economy in furniture design and development of tech-integrated living room furniture are setting new standards. Quality is assured through high-performance fabric durability testing and superior FSC-certified wood frame construction, all delivered through a cohesive omnichannel retail strategy for furniture.

What are the key market drivers leading to the rise in the adoption of Upholstered Furniture Industry?

  • The growing influence of diverse retailing channels, encompassing both digital and physical formats, is a key driver for the global upholstered furniture market.

  • The normalization of hybrid work models is a primary driver, transforming the home as a multifunctional environment and fueling demand for ergonomic upholstered office chairs and multifunctional recliners.
  • This trend, coupled with ongoing residential modernization, propels sales of space-saving furniture designs like sleeper sofas. Consumers increasingly prioritize brand reliability and premium materials sourcing, especially for luxury upholstered furniture.
  • The expansion of digital retail channels offers flexible purchasing formats, enhanced by tools for virtual product visualization, which has been shown to increase purchase confidence by over 25%.
  • Furthermore, the growing social commerce influence is shaping consumer preferences, amplifying awareness and accessibility, thereby broadening the customer base.

What are the market trends shaping the Upholstered Furniture Industry?

  • The rapid emergence of eco-friendly and organic upholstered furniture is a defining market trend. This shift reflects growing consumer demand for sustainability and wellness in home furnishings.

  • A significant trend is the industry's pivot toward circular economy models, driven by an aspirational lifestyle model focused on sustainability. This shift accelerates the adoption of sustainable fabric upholstery using materials like recycled polyester, organic cotton, and natural latex. Manufacturers are also innovating with bio-based leather alternatives and low-volatile organic compound adhesives to meet stringent green manufacturing standards.
  • This evolution toward tech-integrated living environments sees features like automated adjustment mechanisms and biometric sensors becoming more common, with designs favoring soft, curved silhouettes. The implementation of digital product passports has improved supply chain transparency by 40%, meeting consumer demand for verifiable eco-credentials and transforming sustainability from a niche preference into a core market driver.

What challenges does the Upholstered Furniture Industry face during its growth?

  • Fluctuating labor costs and raw material prices present a key challenge to the industry, affecting production efficiency and profitability.

  • Key challenges stem from managing costs amidst international trade fluctuations and intense competition from regional manufacturing clusters. Achieving end-to-end supply chain traceability for materials like FSC-certified wood frames remains a complex hurdle, pressuring firms to adopt lean domestic upholstery operations for greater control.
  • Maintaining design originality is critical in a saturated market, where differentiating high-performance synthetic fabrics or fire-retardant upholstery is difficult. Meeting demand for wear-resistant seating for high-density urban living and collaborative lounge areas requires significant investment.
  • Despite the push for pricing transparency, raw material volatility complicates stable pricing, with some input costs shifting by up to 20% quarterly, directly impacting profit margins and strategies for targeting domestic consumption patterns.

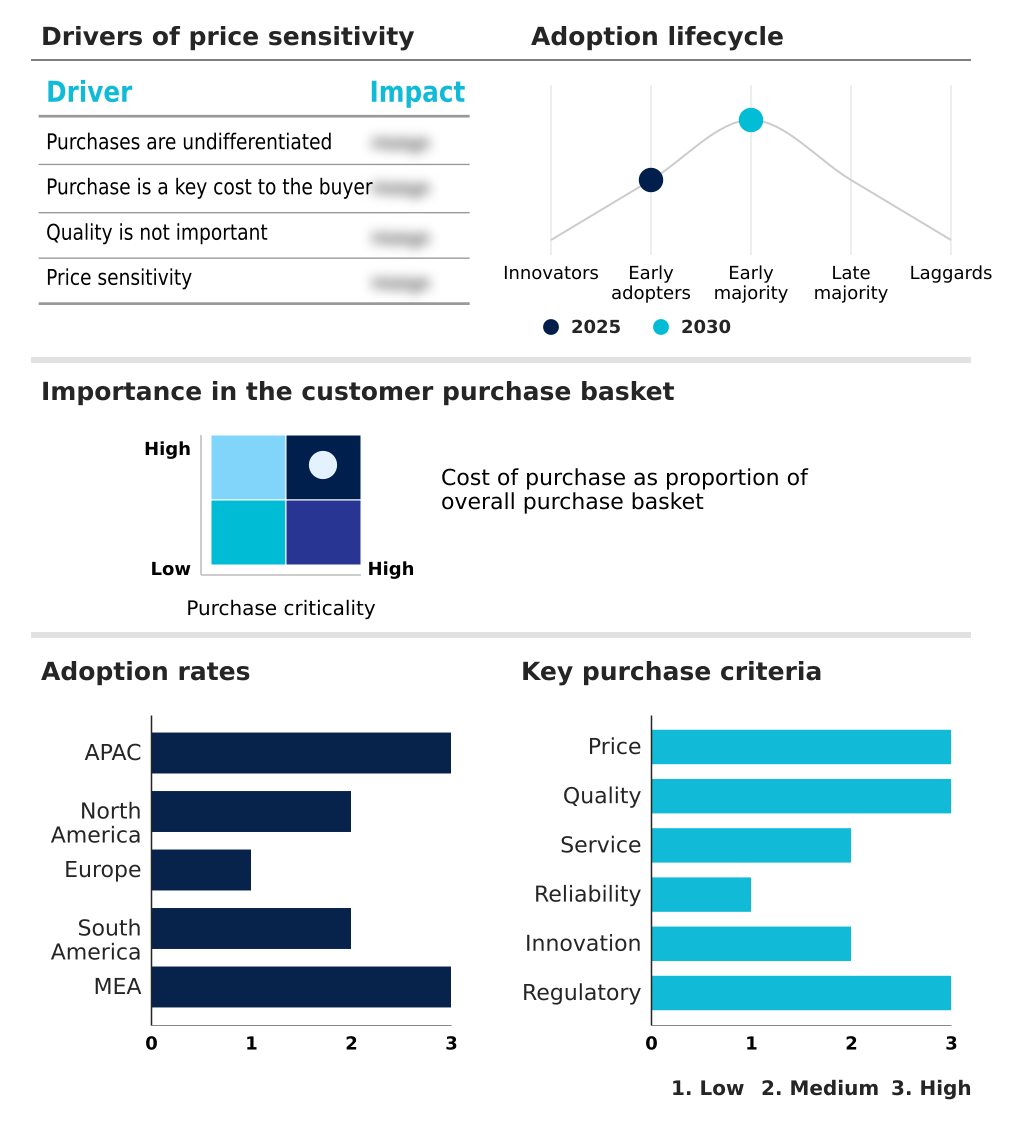
Exclusive Technavio Analysis on Customer Landscape

The upholstered furniture market forecasting report includes the adoption lifecycle of the market, covering from the innovator’s stage to the laggard’s stage. It focuses on adoption rates in different regions based on penetration. Furthermore, the upholstered furniture market report also includes key purchase criteria and drivers of price sensitivity to help companies evaluate and develop their market growth analysis strategies.

Customer Landscape of Upholstered Furniture Industry

Competitive Landscape

Companies are implementing various strategies, such as strategic alliances, upholstered furniture market forecast, partnerships, mergers and acquisitions, geographical expansion, and product/service launches, to enhance their presence in the industry.

Ashley Furniture Industries - Key market offerings encompass a broad range of customizable upholstered seating and bedding solutions, including sofas, sectionals, recliners, and accent chairs designed for modern living spaces.

The industry research and growth report includes detailed analyses of the competitive landscape of the market and information about key companies, including:

  • Ashley Furniture Industries
  • Bassett Furniture Industries
  • Century Furniture LLC
  • Craftmaster Furniture Inc.
  • Delta Furniture
  • DFS Furniture PLC
  • Ekornes Ltd.
  • Flexsteel Industries Inc.
  • Hooker Furnishings Corp.
  • Hughes Furniture Industries Inc.
  • Inter IKEA Holding BV
  • Intermountain Furniture Manufacturing
  • LaZBoy Inc.
  • Lee Industries
  • Mayo Manufacturing Corp.
  • Natuzzi SpA
  • Norwalk Custom Order Furniture LLC
  • Palliser Furniture Ltd.
  • Rowe Fine Furniture Inc.
  • Sherrill Furniture

Qualitative and quantitative analysis of companies has been conducted to help clients understand the wider business environment as well as the strengths and weaknesses of key industry players. Data is qualitatively analyzed to categorize companies as pure play, category-focused, industry-focused, and diversified; it is quantitatively analyzed to categorize companies as dominant, leading, strong, tentative, and weak.

Recent Development and News in Upholstered furniture market

  • In January 2025, Ashley Furniture Industries received recognition as one of America's most innovative companies, reflecting its market-leading initiatives.
  • In March 2025, Inter IKEA Holding BV inaugurated a major mixed-use urban destination in Shanghai, integrating digital planning services with physical showrooms to enhance the metropolitan consumer experience.
  • In April 2025, Natuzzi SpA unveiled its 'Rooted in Harmony' collection at Milan Design Week and initiated a strategic shift in production for the North American market from China to Italy.
  • In May 2025, La-Z-Boy Inc. completed the acquisition of a fifteen-store network, significantly bolstering its company-owned gallery count as part of its ongoing strategic initiatives.

Dive into Technavio’s robust research methodology, blending expert interviews, extensive data synthesis, and validated models for unparalleled Upholstered Furniture Market insights. See full methodology.

Market Scope
Page number 282
Base year 2025
Historic period 2020-2024
Forecast period 2026-2030
Growth momentum & CAGR Accelerate at a CAGR of 5%
Market growth 2026-2030 USD 18710.9 million
Market structure Fragmented
YoY growth 2025-2026(%) 4.7%
Key countries China, Japan, India, South Korea, Australia, Indonesia, US, Canada, Mexico, Germany, UK, France, Italy, Spain, The Netherlands, Brazil, Argentina, Chile, Saudi Arabia, UAE, South Africa, Israel and Turkey
Competitive landscape Leading Companies, Market Positioning of Companies, Competitive Strategies, and Industry Risks

Request Free Sample

Research Analyst Overview

  • The market is pivoting toward advanced material science and sustainable production. Core components like polyurethane foam and polyester fiberfill are being challenged by natural latex and recycled polyester. Boardroom decisions now center on compliance with green manufacturing standards, mandating the use of FSC-certified wood frames and low-volatile organic compound adhesives.
  • The push for sustainability also drives innovation in sustainable fabric upholstery, including organic cotton and bio-based leather alternatives. This shift impacts product design, with a focus on circular economy models and supply chain traceability, validated through digital product passports.
  • In manufacturing, lean domestic upholstery operations leverage smart leather marking and precision cutting technologies, which have jointly reduced material waste by over 25%. Products like modular sofas, multifunctional recliners, and ergonomic upholstered office chairs now define the market. Technology integration, from Blue Steel Spring technology to power motion seating with embedded wireless charging and motorized adjustability, is standard.
  • The consumer experience is shaped by omnichannel retailing, augmented reality tools, and premium white-glove delivery services.

What are the Key Data Covered in this Upholstered Furniture Market Research and Growth Report?

  • What is the expected growth of the Upholstered Furniture Market between 2026 and 2030?

    • USD 18.71 billion, at a CAGR of 5%

  • What segmentation does the market report cover?

    • The report is segmented by Distribution Channel (Offline, and Online), Type (Sofas and chairs, Beds and mattresses, and Others), End-user (Residentials, and Commercials) and Geography (APAC, North America, Europe, South America, Middle East and Africa)

  • Which regions are analyzed in the report?

    • APAC, North America, Europe, South America and Middle East and Africa

  • What are the key growth drivers and market challenges?

    • Growing influence of different retailing channels, Fluctuating labor costs and raw material prices

  • Who are the major players in the Upholstered Furniture Market?

    • Ashley Furniture Industries, Bassett Furniture Industries, Century Furniture LLC, Craftmaster Furniture Inc., Delta Furniture, DFS Furniture PLC, Ekornes Ltd., Flexsteel Industries Inc., Hooker Furnishings Corp., Hughes Furniture Industries Inc., Inter IKEA Holding BV, Intermountain Furniture Manufacturing, LaZBoy Inc., Lee Industries, Mayo Manufacturing Corp., Natuzzi SpA, Norwalk Custom Order Furniture LLC, Palliser Furniture Ltd., Rowe Fine Furniture Inc. and Sherrill Furniture

Market Research Insights

  • The market's dynamism is driven by a shift toward an aspirational lifestyle model, where consumers seek curated living concepts rather than mere products. This is reshaping domestic consumption patterns, especially in areas with high-density urban living, demanding innovative space-saving furniture designs.
  • The rise of digital retail channels and social commerce influence has amplified pricing transparency, forcing brands to compete on design originality and reliability. An omnichannel purchase journey is now standard, with firms that integrate virtual product visualization into their platforms reporting a 20% higher customer engagement rate.
  • Simultaneously, the focus on premium materials sourcing supports a trend where experience-oriented spaces are influencing residential modernization, leading to a 15% year-over-year increase in the specification of commercial-grade durability for long-term household assets.

We can help! Our analysts can customize this upholstered furniture market research report to meet your requirements.

Get in touch

1. Executive Summary

1.1 Market overview

Executive Summary - Chart on Market Overview
Executive Summary - Data Table on Market Overview
Executive Summary - Chart on Global Market Characteristics
Executive Summary - Chart on Market by Geography
Executive Summary - Chart on Market Segmentation by Distribution Channel
Executive Summary - Chart on Market Segmentation by Type
Executive Summary - Chart on Market Segmentation by End-user
Executive Summary - Chart on Incremental Growth
Executive Summary - Data Table on Incremental Growth
Executive Summary - Chart on Company Market Positioning

2. Technavio Analysis

2.1 Analysis of price sensitivity, lifecycle, customer purchase basket, adoption rates, and purchase criteria

2.2 Criticality of inputs and Factors of differentiation

Chart on Overview on criticality of inputs and factors of differentiation

2.3 Factors of disruption

Chart on Overview on factors of disruption

2.4 Impact of drivers and challenges

Chart on Impact of drivers and challenges in 2025 and 2030

3. Market Landscape

3.1 Market ecosystem

Chart on Parent Market
Data Table on - Parent Market

3.2 Market characteristics

Chart on Market characteristics analysis

3.3 Value chain analysis

Chart on Value chain analysis

4. Market Sizing

4.1 Market definition

Data Table on Offerings of companies included in the market definition

4.2 Market segment analysis

Market segments

4.3 Market size 2025

4.4 Market outlook: Forecast for 2025-2030

Chart on Global - Market size and forecast 2025-2030 ($ million)
Data Table on Global - Market size and forecast 2025-2030 ($ million)
Chart on Global Market: Year-over-year growth 2025-2030 (%)
Data Table on Global Market: Year-over-year growth 2025-2030 (%)

5. Historic Market Size

5.1 Global Upholstered Furniture Market 2020 - 2024

Historic Market Size - Data Table on Global Upholstered Furniture Market 2020 - 2024 ($ million)

5.2 Distribution Channel segment analysis 2020 - 2024

Historic Market Size - Distribution Channel Segment 2020 - 2024 ($ million)

5.3 Type segment analysis 2020 - 2024

Historic Market Size - Type Segment 2020 - 2024 ($ million)

5.4 End-user segment analysis 2020 - 2024

Historic Market Size - End-user Segment 2020 - 2024 ($ million)

5.5 Geography segment analysis 2020 - 2024

Historic Market Size - Geography Segment 2020 - 2024 ($ million)

5.6 Country segment analysis 2020 - 2024

Historic Market Size - Country Segment 2020 - 2024 ($ million)

6. Qualitative Analysis

6.1 Impact of AI on Global Upholstered Furniture Market

6.2 Impact of Geopolitical Conflicts on Global Upholstered Furniture Market

7. Five Forces Analysis

7.1 Five forces summary

Five forces analysis - Comparison between 2025 and 2030

7.2 Bargaining power of buyers

Bargaining power of buyers - Impact of key factors 2025 and 2030

7.3 Bargaining power of suppliers

Bargaining power of suppliers - Impact of key factors in 2025 and 2030

7.4 Threat of new entrants

Threat of new entrants - Impact of key factors in 2025 and 2030

7.5 Threat of substitutes

Threat of substitutes - Impact of key factors in 2025 and 2030

7.6 Threat of rivalry

Threat of rivalry - Impact of key factors in 2025 and 2030

7.7 Market condition

Chart on Market condition - Five forces 2025 and 2030

8. Market Segmentation by Distribution Channel

8.1 Market segments

Chart on Distribution Channel - Market share 2025-2030 (%)
Data Table on Distribution Channel - Market share 2025-2030 (%)

8.2 Comparison by Distribution Channel

Chart on Comparison by Distribution Channel
Data Table on Comparison by Distribution Channel

8.3 Offline - Market size and forecast 2025-2030

Chart on Offline - Market size and forecast 2025-2030 ($ million)
Data Table on Offline - Market size and forecast 2025-2030 ($ million)
Chart on Offline - Year-over-year growth 2025-2030 (%)
Data Table on Offline - Year-over-year growth 2025-2030 (%)

8.4 Online - Market size and forecast 2025-2030

Chart on Online - Market size and forecast 2025-2030 ($ million)
Data Table on Online - Market size and forecast 2025-2030 ($ million)
Chart on Online - Year-over-year growth 2025-2030 (%)
Data Table on Online - Year-over-year growth 2025-2030 (%)

8.5 Market opportunity by Distribution Channel

Market opportunity by Distribution Channel ($ million)
Data Table on Market opportunity by Distribution Channel ($ million)

9. Market Segmentation by Type

9.1 Market segments

Chart on Type - Market share 2025-2030 (%)
Data Table on Type - Market share 2025-2030 (%)

9.2 Comparison by Type

Chart on Comparison by Type
Data Table on Comparison by Type

9.3 Sofas and chairs - Market size and forecast 2025-2030

Chart on Sofas and chairs - Market size and forecast 2025-2030 ($ million)
Data Table on Sofas and chairs - Market size and forecast 2025-2030 ($ million)
Chart on Sofas and chairs - Year-over-year growth 2025-2030 (%)
Data Table on Sofas and chairs - Year-over-year growth 2025-2030 (%)

9.4 Beds and mattresses - Market size and forecast 2025-2030

Chart on Beds and mattresses - Market size and forecast 2025-2030 ($ million)
Data Table on Beds and mattresses - Market size and forecast 2025-2030 ($ million)
Chart on Beds and mattresses - Year-over-year growth 2025-2030 (%)
Data Table on Beds and mattresses - Year-over-year growth 2025-2030 (%)

9.5 Others - Market size and forecast 2025-2030

Chart on Others - Market size and forecast 2025-2030 ($ million)
Data Table on Others - Market size and forecast 2025-2030 ($ million)
Chart on Others - Year-over-year growth 2025-2030 (%)
Data Table on Others - Year-over-year growth 2025-2030 (%)

9.6 Market opportunity by Type

Market opportunity by Type ($ million)
Data Table on Market opportunity by Type ($ million)

10. Market Segmentation by End-user

10.1 Market segments

Chart on End-user - Market share 2025-2030 (%)
Data Table on End-user - Market share 2025-2030 (%)

10.2 Comparison by End-user

Chart on Comparison by End-user
Data Table on Comparison by End-user

10.3 Residentials - Market size and forecast 2025-2030

Chart on Residentials - Market size and forecast 2025-2030 ($ million)
Data Table on Residentials - Market size and forecast 2025-2030 ($ million)
Chart on Residentials - Year-over-year growth 2025-2030 (%)
Data Table on Residentials - Year-over-year growth 2025-2030 (%)

10.4 Commercials - Market size and forecast 2025-2030

Chart on Commercials - Market size and forecast 2025-2030 ($ million)
Data Table on Commercials - Market size and forecast 2025-2030 ($ million)
Chart on Commercials - Year-over-year growth 2025-2030 (%)
Data Table on Commercials - Year-over-year growth 2025-2030 (%)

10.5 Market opportunity by End-user

Market opportunity by End-user ($ million)
Data Table on Market opportunity by End-user ($ million)

11. Customer Landscape

11.1 Customer landscape overview

Analysis of price sensitivity, lifecycle, customer purchase basket, adoption rates, and purchase criteria

12. Geographic Landscape

12.1 Geographic segmentation

Chart on Market share by geography 2025-2030 (%)
Data Table on Market share by geography 2025-2030 (%)

12.2 Geographic comparison

Chart on Geographic comparison
Data Table on Geographic comparison

12.3 APAC - Market size and forecast 2025-2030

Chart on APAC - Market size and forecast 2025-2030 ($ million)
Data Table on APAC - Market size and forecast 2025-2030 ($ million)
Chart on APAC - Year-over-year growth 2025-2030 (%)
Data Table on APAC - Year-over-year growth 2025-2030 (%)
Chart on Regional Comparison - APAC
Data Table on Regional Comparison - APAC

12.3.1 China - Market size and forecast 2025-2030

Chart on China - Market size and forecast 2025-2030 ($ million)
Data Table on China - Market size and forecast 2025-2030 ($ million)
Chart on China - Year-over-year growth 2025-2030 (%)
Data Table on China - Year-over-year growth 2025-2030 (%)

12.3.2 Japan - Market size and forecast 2025-2030

Chart on Japan - Market size and forecast 2025-2030 ($ million)
Data Table on Japan - Market size and forecast 2025-2030 ($ million)
Chart on Japan - Year-over-year growth 2025-2030 (%)
Data Table on Japan - Year-over-year growth 2025-2030 (%)

12.3.3 India - Market size and forecast 2025-2030

Chart on India - Market size and forecast 2025-2030 ($ million)
Data Table on India - Market size and forecast 2025-2030 ($ million)
Chart on India - Year-over-year growth 2025-2030 (%)
Data Table on India - Year-over-year growth 2025-2030 (%)

12.3.4 South Korea - Market size and forecast 2025-2030

Chart on South Korea - Market size and forecast 2025-2030 ($ million)
Data Table on South Korea - Market size and forecast 2025-2030 ($ million)
Chart on South Korea - Year-over-year growth 2025-2030 (%)
Data Table on South Korea - Year-over-year growth 2025-2030 (%)

12.3.5 Australia - Market size and forecast 2025-2030

Chart on Australia - Market size and forecast 2025-2030 ($ million)
Data Table on Australia - Market size and forecast 2025-2030 ($ million)
Chart on Australia - Year-over-year growth 2025-2030 (%)
Data Table on Australia - Year-over-year growth 2025-2030 (%)

12.3.6 Indonesia - Market size and forecast 2025-2030

Chart on Indonesia - Market size and forecast 2025-2030 ($ million)
Data Table on Indonesia - Market size and forecast 2025-2030 ($ million)
Chart on Indonesia - Year-over-year growth 2025-2030 (%)
Data Table on Indonesia - Year-over-year growth 2025-2030 (%)

12.4 North America - Market size and forecast 2025-2030

Chart on North America - Market size and forecast 2025-2030 ($ million)
Data Table on North America - Market size and forecast 2025-2030 ($ million)
Chart on North America - Year-over-year growth 2025-2030 (%)
Data Table on North America - Year-over-year growth 2025-2030 (%)
Chart on Regional Comparison - North America
Data Table on Regional Comparison - North America

12.4.1 US - Market size and forecast 2025-2030

Chart on US - Market size and forecast 2025-2030 ($ million)
Data Table on US - Market size and forecast 2025-2030 ($ million)
Chart on US - Year-over-year growth 2025-2030 (%)
Data Table on US - Year-over-year growth 2025-2030 (%)

12.4.2 Canada - Market size and forecast 2025-2030

Chart on Canada - Market size and forecast 2025-2030 ($ million)
Data Table on Canada - Market size and forecast 2025-2030 ($ million)
Chart on Canada - Year-over-year growth 2025-2030 (%)
Data Table on Canada - Year-over-year growth 2025-2030 (%)

12.4.3 Mexico - Market size and forecast 2025-2030

Chart on Mexico - Market size and forecast 2025-2030 ($ million)
Data Table on Mexico - Market size and forecast 2025-2030 ($ million)
Chart on Mexico - Year-over-year growth 2025-2030 (%)
Data Table on Mexico - Year-over-year growth 2025-2030 (%)

12.5 Europe - Market size and forecast 2025-2030

Chart on Europe - Market size and forecast 2025-2030 ($ million)
Data Table on Europe - Market size and forecast 2025-2030 ($ million)
Chart on Europe - Year-over-year growth 2025-2030 (%)
Data Table on Europe - Year-over-year growth 2025-2030 (%)
Chart on Regional Comparison - Europe
Data Table on Regional Comparison - Europe

12.5.1 Germany - Market size and forecast 2025-2030

Chart on Germany - Market size and forecast 2025-2030 ($ million)
Data Table on Germany - Market size and forecast 2025-2030 ($ million)
Chart on Germany - Year-over-year growth 2025-2030 (%)
Data Table on Germany - Year-over-year growth 2025-2030 (%)

12.5.2 UK - Market size and forecast 2025-2030

Chart on UK - Market size and forecast 2025-2030 ($ million)
Data Table on UK - Market size and forecast 2025-2030 ($ million)
Chart on UK - Year-over-year growth 2025-2030 (%)
Data Table on UK - Year-over-year growth 2025-2030 (%)

12.5.3 France - Market size and forecast 2025-2030

Chart on France - Market size and forecast 2025-2030 ($ million)
Data Table on France - Market size and forecast 2025-2030 ($ million)
Chart on France - Year-over-year growth 2025-2030 (%)
Data Table on France - Year-over-year growth 2025-2030 (%)

12.5.4 Italy - Market size and forecast 2025-2030

Chart on Italy - Market size and forecast 2025-2030 ($ million)
Data Table on Italy - Market size and forecast 2025-2030 ($ million)
Chart on Italy - Year-over-year growth 2025-2030 (%)
Data Table on Italy - Year-over-year growth 2025-2030 (%)

12.5.5 Spain - Market size and forecast 2025-2030

Chart on Spain - Market size and forecast 2025-2030 ($ million)
Data Table on Spain - Market size and forecast 2025-2030 ($ million)
Chart on Spain - Year-over-year growth 2025-2030 (%)
Data Table on Spain - Year-over-year growth 2025-2030 (%)

12.5.6 The Netherlands - Market size and forecast 2025-2030

Chart on The Netherlands - Market size and forecast 2025-2030 ($ million)
Data Table on The Netherlands - Market size and forecast 2025-2030 ($ million)
Chart on The Netherlands - Year-over-year growth 2025-2030 (%)
Data Table on The Netherlands - Year-over-year growth 2025-2030 (%)

12.6 South America - Market size and forecast 2025-2030

Chart on South America - Market size and forecast 2025-2030 ($ million)
Data Table on South America - Market size and forecast 2025-2030 ($ million)
Chart on South America - Year-over-year growth 2025-2030 (%)
Data Table on South America - Year-over-year growth 2025-2030 (%)
Chart on Regional Comparison - South America
Data Table on Regional Comparison - South America

12.6.1 Brazil - Market size and forecast 2025-2030

Chart on Brazil - Market size and forecast 2025-2030 ($ million)
Data Table on Brazil - Market size and forecast 2025-2030 ($ million)
Chart on Brazil - Year-over-year growth 2025-2030 (%)
Data Table on Brazil - Year-over-year growth 2025-2030 (%)

12.6.2 Argentina - Market size and forecast 2025-2030

Chart on Argentina - Market size and forecast 2025-2030 ($ million)
Data Table on Argentina - Market size and forecast 2025-2030 ($ million)
Chart on Argentina - Year-over-year growth 2025-2030 (%)
Data Table on Argentina - Year-over-year growth 2025-2030 (%)

12.6.3 Chile - Market size and forecast 2025-2030

Chart on Chile - Market size and forecast 2025-2030 ($ million)
Data Table on Chile - Market size and forecast 2025-2030 ($ million)
Chart on Chile - Year-over-year growth 2025-2030 (%)
Data Table on Chile - Year-over-year growth 2025-2030 (%)

12.7 Middle East and Africa - Market size and forecast 2025-2030

Chart on Middle East and Africa - Market size and forecast 2025-2030 ($ million)
Data Table on Middle East and Africa - Market size and forecast 2025-2030 ($ million)
Chart on Middle East and Africa - Year-over-year growth 2025-2030 (%)
Data Table on Middle East and Africa - Year-over-year growth 2025-2030 (%)
Chart on Regional Comparison - Middle East and Africa
Data Table on Regional Comparison - Middle East and Africa

12.7.1 Saudi Arabia - Market size and forecast 2025-2030

Chart on Saudi Arabia - Market size and forecast 2025-2030 ($ million)
Data Table on Saudi Arabia - Market size and forecast 2025-2030 ($ million)
Chart on Saudi Arabia - Year-over-year growth 2025-2030 (%)
Data Table on Saudi Arabia - Year-over-year growth 2025-2030 (%)

12.7.2 UAE - Market size and forecast 2025-2030

Chart on UAE - Market size and forecast 2025-2030 ($ million)
Data Table on UAE - Market size and forecast 2025-2030 ($ million)
Chart on UAE - Year-over-year growth 2025-2030 (%)
Data Table on UAE - Year-over-year growth 2025-2030 (%)

12.7.3 South Africa - Market size and forecast 2025-2030

Chart on South Africa - Market size and forecast 2025-2030 ($ million)
Data Table on South Africa - Market size and forecast 2025-2030 ($ million)
Chart on South Africa - Year-over-year growth 2025-2030 (%)
Data Table on South Africa - Year-over-year growth 2025-2030 (%)

12.7.4 Israel - Market size and forecast 2025-2030

Chart on Israel - Market size and forecast 2025-2030 ($ million)
Data Table on Israel - Market size and forecast 2025-2030 ($ million)
Chart on Israel - Year-over-year growth 2025-2030 (%)
Data Table on Israel - Year-over-year growth 2025-2030 (%)

12.7.5 Turkey - Market size and forecast 2025-2030

Chart on Turkey - Market size and forecast 2025-2030 ($ million)
Data Table on Turkey - Market size and forecast 2025-2030 ($ million)
Chart on Turkey - Year-over-year growth 2025-2030 (%)
Data Table on Turkey - Year-over-year growth 2025-2030 (%)

12.8 Market opportunity by geography

Market opportunity by geography ($ million)
Data Tables on Market opportunity by geography ($ million)

13. Drivers, Challenges, and Opportunity

13.1 Market drivers

Growing influence of different retailing channels
Growing demand for premium furniture
Rising popularity of multi-functional upholstered furniture

13.2 Market challenges

Fluctuating labor costs and raw material prices
Long product replacement cycle
Intense competition from low-cost unorganized players

13.3 Impact of drivers and challenges

Impact of drivers and challenges in 2025 and 2030

13.4 Market opportunities

Rapid emergence of eco-friendly and organic upholstered furniture
Increase in mergers and acquisitions activities
Technological innovations in upholstered furniture

14. Competitive Landscape

14.1 Overview

14.2

Overview on criticality of inputs and factors of differentiation

14.3 Landscape disruption

Overview on factors of disruption

14.4 Industry risks

Impact of key risks on business

15. Competitive Analysis

15.1 Companies profiled

Companies covered

15.2 Company ranking index

15.3 Market positioning of companies

Matrix on companies position and classification

15.4 Ashley Furniture Industries

Ashley Furniture Industries - Overview
Ashley Furniture Industries - Product / Service
Ashley Furniture Industries - Key offerings
SWOT

15.5 Bassett Furniture Industries

Bassett Furniture Industries - Overview
Bassett Furniture Industries - Business segments
Bassett Furniture Industries - Key offerings
Bassett Furniture Industries - Segment focus
SWOT

15.6 Century Furniture LLC

Century Furniture LLC - Overview
Century Furniture LLC - Product / Service
Century Furniture LLC - Key offerings
SWOT

15.7 Craftmaster Furniture Inc.

Craftmaster Furniture Inc. - Overview
Craftmaster Furniture Inc. - Product / Service
Craftmaster Furniture Inc. - Key offerings
SWOT

15.8 Delta Furniture

Delta Furniture - Overview
Delta Furniture - Product / Service
Delta Furniture - Key offerings
SWOT

15.9 DFS Furniture PLC

DFS Furniture PLC - Overview
DFS Furniture PLC - Product / Service
DFS Furniture PLC - Key offerings
SWOT

15.10 Ekornes Ltd.

Ekornes Ltd. - Overview
Ekornes Ltd. - Product / Service
Ekornes Ltd. - Key offerings
SWOT

15.11 Flexsteel Industries Inc.

Flexsteel Industries Inc. - Overview
Flexsteel Industries Inc. - Product / Service
Flexsteel Industries Inc. - Key offerings
SWOT

15.12 Hooker Furnishings Corp.

Hooker Furnishings Corp. - Overview
Hooker Furnishings Corp. - Business segments
Hooker Furnishings Corp. - Key offerings
Hooker Furnishings Corp. - Segment focus
SWOT

15.13 Hughes Furniture Industries Inc.

Hughes Furniture Industries Inc. - Overview
Hughes Furniture Industries Inc. - Product / Service
Hughes Furniture Industries Inc. - Key offerings
SWOT

15.14 Inter IKEA Holding BV

Inter IKEA Holding BV - Overview
Inter IKEA Holding BV - Product / Service
Inter IKEA Holding BV - Key news
Inter IKEA Holding BV - Key offerings
SWOT

15.15 Intermountain Furniture Manufacturing

Intermountain Furniture Manufacturing - Overview
Intermountain Furniture Manufacturing - Product / Service
Intermountain Furniture Manufacturing - Key offerings
SWOT

15.16 LaZBoy Inc.

LaZBoy Inc. - Overview
LaZBoy Inc. - Business segments
LaZBoy Inc. - Key offerings
LaZBoy Inc. - Segment focus
SWOT

15.17 Lee Industries

Lee Industries - Overview
Lee Industries - Product / Service
Lee Industries - Key offerings
SWOT

15.18 Mayo Manufacturing Corp.

Mayo Manufacturing Corp. - Overview
Mayo Manufacturing Corp. - Product / Service
Mayo Manufacturing Corp. - Key offerings
SWOT

16. Appendix

16.1 Scope of the report

Market definition
Objectives
Notes and caveats

16.2 Inclusions and exclusions checklist

Inclusions checklist
Exclusions checklist

16.3 Currency conversion rates for US$

16.4 Research methodology

16.5 Data procurement

Information sources

16.6 Data validation

16.7 Validation techniques employed for market sizing

16.8 Data synthesis

16.9 360 degree market analysis

16.10 List of abbreviations

Research Methodology

Technavio presents a detailed picture of the market by way of study, synthesis, and summation of data from multiple sources. The analysts have presented the various facets of the market with a particular focus on identifying the key industry influencers. The data thus presented is comprehensive, reliable, and the result of extensive research, both primary and secondary.

INFORMATION SOURCES

Primary sources

  • Manufacturers and suppliers
  • Channel partners
  • Industry experts
  • Strategic decision makers

Secondary sources

  • Industry journals and periodicals
  • Government data
  • Financial reports of key industry players
  • Historical data
  • Press releases

DATA ANALYSIS

Data Synthesis

  • Collation of data
  • Estimation of key figures
  • Analysis of derived insights

Data Validation

  • Triangulation with data models
  • Reference against proprietary databases
  • Corroboration with industry experts

REPORT WRITING

Qualitative

  • Market drivers
  • Market challenges
  • Market trends
  • Five forces analysis

Quantitative

  • Market size and forecast
  • Market segmentation
  • Geographical insights
  • Competitive landscape

Interested in this report?

Get your sample now to see our research methodology and insights!

Download Now

Frequently Asked Questions

Upholstered Furniture market growth will increase by USD 18710.9 million during 2026-2030.

The Upholstered Furniture market is expected to grow at a CAGR of 5% during 2026-2030.

Upholstered Furniture market is segmented by Distribution channel (Offline, Online) Type (Sofas and chairs, Beds and mattresses, Others) End-user (Residentials, Commercials)

Ashley Furniture Industries, Bassett Furniture Industries, Century Furniture LLC, Craftmaster Furniture Inc., Delta Furniture, DFS Furniture PLC, Ekornes Ltd., Flexsteel Industries Inc., Hooker Furnishings Corp., Hughes Furniture Industries Inc., Inter IKEA Holding BV, Intermountain Furniture Manufacturing, LaZBoy Inc., Lee Industries, Mayo Manufacturing Corp., Natuzzi SpA, Norwalk Custom Order Furniture LLC, Palliser Furniture Ltd., Rowe Fine Furniture Inc., Sherrill Furniture are a few of the key vendors in the Upholstered Furniture market.

APAC will register the highest growth rate of 47.5% among the other regions. Therefore, the Upholstered Furniture market in APAC is expected to garner significant business opportunities for the vendors during the forecast period.

China, Japan, India, South Korea, Australia, Indonesia, US, Canada, Mexico, Germany, UK, France, Italy, Spain, The Netherlands, Brazil, Argentina, Chile, Saudi Arabia, UAE, South Africa, Israel, Turkey

  • Growing influence of different retailing channels is the driving factor this market.

The Upholstered Furniture market vendors should focus on grabbing business opportunities from the Distribution channel segment as it accounted for the largest market share in the base year.
RIA - Research AI Assistant
Ask RIA