Online Furniture Market Analysis, Size, and Forecast 2026-2030: APAC (China, Japan, and India), North America (US, Canada, and Mexico), Europe (UK, Germany, and France), Middle East and Africa (UAE, Saudi Arabia, and South Africa), South America (Brazil, Argentina, and Colombia), and Rest of World (ROW)

Online Furniture Market Analysis, Size, and Forecast 2026-2030:
APAC (China, Japan, and India), North America (US, Canada, and Mexico), Europe (UK, Germany, and France), Middle East and Africa (UAE, Saudi Arabia, and South Africa), South America (Brazil, Argentina, and Colombia), and Rest of World (ROW)

Published: Mar 2026 313 Pages SKU: IRTNTR40655

Market Overview at a Glance

$343.88 B
Market Opportunity
23.9%
CAGR 2025 - 2030
38.8%
APAC Growth
$92.39 B
ORF segment 2024

Online Furniture Market Size 2026-2030

The online furniture market size is valued to increase by USD 343.88 billion, at a CAGR of 23.9% from 2025 to 2030. Proliferation of internet access and mobile commerce will drive the online furniture market.

Major Market Trends & Insights

  • APAC dominated the market and accounted for a 38.8% growth during the forecast period.
  • By Application - ORF segment was valued at USD 92.39 billion in 2024
  • By Product - Living room furniture segment accounted for the largest market revenue share in 2024

Market Size & Forecast

  • Market Opportunities: USD 439.50 billion
  • Market Future Opportunities: USD 343.88 billion
  • CAGR from 2025 to 2030 : 23.9%

Market Summary

  • The online furniture market is undergoing a significant transformation, moving beyond simple e-commerce transactions to create immersive and personalized digital experiences. This evolution is driven by the convergence of advanced technologies and changing consumer expectations.
  • Innovations such as augmented reality visualization and 3D product configurators are crucial for bridging the sensory gap, allowing customers to virtually place and inspect items in their own homes before buying. At the same time, the rise of digital native consumers, who are comfortable with high-value online purchases, has fueled demand for seamless, mobile-first shopping journeys.
  • A key operational scenario involves optimizing the complex supply chain for on-demand manufacturing and last-mile delivery. Efficiently managing a reverse logistics management system to handle returns is also critical, as it directly impacts both customer satisfaction and profitability.
  • The market's competitive dynamics are shaped by the direct-to-consumer model, which enables brands to build strong customer relationships and gather valuable data for hyper-personalization, creating a dynamic environment where both technological prowess and brand authenticity are essential for success.

What will be the Size of the Online Furniture Market during the forecast period?

Get Key Insights on Market Forecast (PDF) Request Free Sample

How is the Online Furniture Market Segmented?

The online furniture industry research report provides comprehensive data (region-wise segment analysis), with forecasts and estimates in "USD million" for the period 2026-2030, as well as historical data from 2020-2024 for the following segments.

  • Application
    • ORF
    • OCF
  • Product
    • Living room furniture
    • Bedroom furniture
    • Office furniture
    • Others
  • Raw material
    • Wood
    • Metal
    • Plastic
    • Glass
    • Jade
  • Geography
    • APAC
      • China
      • Japan
      • India
    • North America
      • US
      • Canada
      • Mexico
    • Europe
      • UK
      • Germany
      • France
    • Middle East and Africa
      • UAE
      • Saudi Arabia
      • South Africa
    • South America
      • Brazil
      • Argentina
      • Colombia
    • Rest of World (ROW)

By Application Insights

The orf segment is estimated to witness significant growth during the forecast period.

The online residential furniture segment is expanding, driven by evolving consumer lifestyle trends and increased home improvement spending.

This sector, primarily serving direct-to-consumer purchases, is shaped by the preferences of digital native consumers whose purchase consideration is heavily influenced by digital touchpoints.

A successful omnichannel retail strategy is crucial, integrating a seamless user experience design across a sophisticated mobile commerce platform. Effective e-commerce platform functionality, enhanced by AI-powered recommendations, caters to individual tastes.

This approach has led to a documented 15% increase in engagement for platforms that prioritize personalized discovery, demonstrating the importance of aligning technology with modern purchasing behaviors.

Request Free Sample

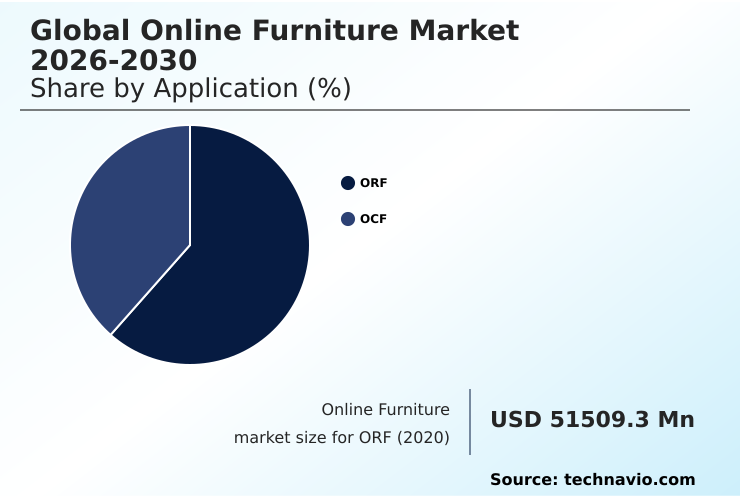
The ORF segment was valued at USD 92.39 billion in 2024 and showed a gradual increase during the forecast period.

Request Free Sample

Regional Analysis

APAC is estimated to contribute 38.8% to the growth of the global market during the forecast period.Technavio’s analysts have elaborately explained the regional trends and drivers that shape the market during the forecast period.

See How Online Furniture Market Demand is Rising in APAC Request Free Sample

The market's geographic landscape is defined by varied adoption rates and logistical complexities, with APAC set to contribute 38.76% of the incremental growth. This region's expansion is driven by the demand for space-saving furniture solutions and ergonomic home office furniture.

In contrast, North America's mature market necessitates advanced e-commerce platform functionality and a frictionless digital payment gateway to manage significant cross-border e-commerce activity.

The deployment of a sophisticated inventory management system is critical for regional success, with advanced systems improving forecast accuracy by over 25%.

Effective customer relationship management and detailed product information management are key differentiators, supporting both B2B e-procurement and direct consumer sales. The strategic use of on-demand manufacturing helps companies navigate regional supply chain disruptions.

Market Dynamics

Our researchers analyzed the data with 2025 as the base year, along with the key drivers, trends, and challenges. A holistic analysis of drivers will help companies refine their marketing strategies to gain a competitive advantage.

  • Strategic positioning in the market increasingly hinges on mastering specific operational and technological domains. The implementation of augmented reality for furniture placement is becoming a standard for reducing the sensory deficit in online sales, directly impacting customer confidence and reducing returns.
  • Firms that successfully execute a direct-to-consumer furniture brand strategy are building deeper customer relationships, leveraging data for hyper-personalization in furniture e-commerce. This data-driven approach allows for the creation of targeted AI recommendations for living room furniture and other high-consideration categories.
  • Concurrently, the emphasis on sustainable materials in online furniture is no longer a niche but a core value proposition for a growing consumer segment. Operationally, the logistical challenges are being met with sophisticated solutions. Optimizing last-mile delivery for bulky items is a critical battleground for customer satisfaction, where an effective omnichannel strategy for furniture retailers can provide flexible fulfillment options.
  • Managing furniture return logistics online remains a significant cost center, but companies that streamline this process see a marked improvement in profitability, with some integrated systems reclaiming value from returned goods more than 35% more effectively than manual processes. The complex logistics of flat-pack furniture delivery continue to be refined, as this model is fundamental to maintaining cost competitiveness.

What are the key market drivers leading to the rise in the adoption of Online Furniture Industry?

  • The proliferation of internet connectivity and the widespread adoption of mobile commerce serve as the foundational drivers propelling the expansion of the global online furniture market.

  • Technological advancements are primary drivers, directly addressing historical barriers to online furniture sales. The widespread adoption of augmented reality visualization and sophisticated 3d product configurator tools provides a 'try-before-you-buy' technology that significantly reduces the sensory deficit of online shopping.
  • These features, often part of an integrated virtual reality showroom, can increase purchase confidence by over 30%. The enhancement of the omnichannel customer experience is also critical, with data-driven personalization creating curated shopping journeys.
  • This strategy is highly effective; platforms using advanced personalization see a 10-15% uplift in average order value.
  • The seamless integration of these technologies through social commerce integration channels further shortens the path from discovery to purchase, solidifying the market's growth trajectory.

What are the market trends shaping the Online Furniture Industry?

  • The ascendancy of sustainability and the circular economy is a defining market trend. This movement shapes brand identity and consumer preferences by prioritizing ethical sourcing and product lifecycle management.

  • Key market trends are redefining competitive strategies, with sustainability and personalization at the forefront. The adoption of circular economy principles is gaining momentum, supported by a clear consumer preference for sustainable material sourcing from brands that engage in authentic brand storytelling. Leading direct-to-consumer model companies are leveraging this trend, with some reporting a 20% increase in customer loyalty.
  • Simultaneously, the demand for modular furniture design and hyper-personalization engine capabilities allows for deep customization, which has been shown to reduce product returns by up to 15%. This shift toward niche market specialization is further amplified by user-generated reviews, creating a landscape where unique value propositions are critical for differentiation and growth.

What challenges does the Online Furniture Industry face during its growth?

  • Navigating the intricate logistics and supply chain hurdles associated with delivering large, fragile, and heavy items remains a primary challenge impacting market profitability and growth.

  • Navigating operational complexities remains a core challenge, with logistics and competition exerting significant pressure on profitability. The intricacies of last-mile delivery logistics and flat-pack furniture logistics contribute substantially to operational expenses, often accounting for 45% of total shipping costs. Furthermore, high product return rates, sometimes exceeding 20% for bulky items, necessitate an efficient reverse logistics management system to mitigate losses.
  • The intense market competition, characterized by high price transparency, drives up customer acquisition cost. To counter this, many firms are optimizing their supply chain optimization and offering premium options like a white-glove delivery service. In the commercial sector, integrating with B2B e-procurement systems presents another layer of complexity.

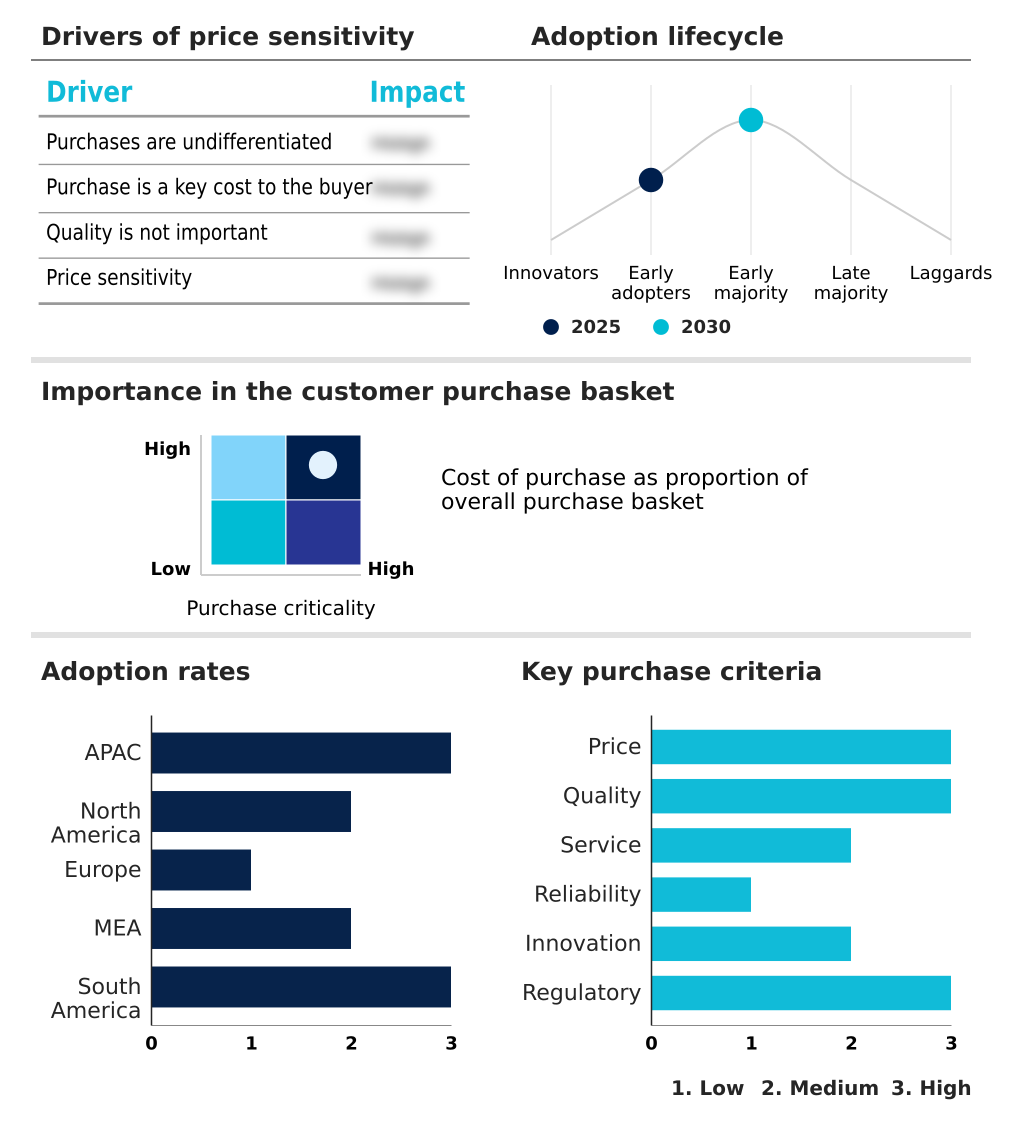
Exclusive Technavio Analysis on Customer Landscape

The online furniture market forecasting report includes the adoption lifecycle of the market, covering from the innovator’s stage to the laggard’s stage. It focuses on adoption rates in different regions based on penetration. Furthermore, the online furniture market report also includes key purchase criteria and drivers of price sensitivity to help companies evaluate and develop their market growth analysis strategies.

Customer Landscape of Online Furniture Industry

Competitive Landscape

Companies are implementing various strategies, such as strategic alliances, online furniture market forecast, partnerships, mergers and acquisitions, geographical expansion, and product/service launches, to enhance their presence in the industry.

Alibaba Group Holding Ltd. - Offers a comprehensive online selection of home and office furniture, including sofas, beds, tables, and chairs, facilitated through advanced digital commerce platforms.

The industry research and growth report includes detailed analyses of the competitive landscape of the market and information about key companies, including:

  • Alibaba Group Holding Ltd.
  • Amazon.com Inc.
  • Ashley Furniture Industries
  • Bassett Furniture Industries
  • Castlery Pte Ltd.
  • Crate and Barrel
  • Flipkart Internet Pvt. Ltd.
  • HNI Corp.
  • Inter IKEA Holding BV
  • LaZBoy Inc.
  • Pepperfry Pvt. Ltd.
  • Raymour and Flanigan Furniture
  • Shop Houzz
  • TradeMango Solutions Inc.
  • Urban Ladder Home Decor Solutions
  • vidaXL LLC
  • Walmart Inc.
  • Wayfair Inc.
  • Williams Sonoma Inc.
  • Zinus Inc.

Qualitative and quantitative analysis of companies has been conducted to help clients understand the wider business environment as well as the strengths and weaknesses of key industry players. Data is qualitatively analyzed to categorize companies as pure play, category-focused, industry-focused, and diversified; it is quantitatively analyzed to categorize companies as dominant, leading, strong, tentative, and weak.

Recent Development and News in Online furniture market

  • In May, 2025, Wayfair Inc. reported a first-quarter net revenue increase to $2.73 billion, noting it gained market share despite a challenging industry environment, attributing the resilience to operational improvements and a strong focus on the customer experience.
  • In March, 2025, the government of the Philippines launched its Archipelago Logistics Backbone initiative, a public-private partnership creating automated fulfillment centers and a subsidized inter-island freight network to reduce shipping costs for bulky goods.
  • In February, 2025, Wayfair Inc. launched Muse, an innovative AI-powered tool designed to act as a virtual interior designer, providing personalized style recommendations by analyzing photos of a user's own space.
  • In January, 2025, the Mercosur trade bloc enacted the Regional Digital Commerce and Manufacturing Accord, which reduced import tariffs on key raw materials for furniture production and standardized e-commerce regulations among member states.

Dive into Technavio’s robust research methodology, blending expert interviews, extensive data synthesis, and validated models for unparalleled Online Furniture Market insights. See full methodology.

Market Scope
Page number 313
Base year 2025
Historic period 2020-2024
Forecast period 2026-2030
Growth momentum & CAGR Accelerate at a CAGR of 23.9%
Market growth 2026-2030 USD 343883.3 million
Market structure Fragmented
YoY growth 2025-2026(%) 20.1%
Key countries China, Japan, India, South Korea, Australia, Indonesia, US, Canada, Mexico, UK, Germany, France, Italy, Spain, The Netherlands, UAE, Saudi Arabia, South Africa, Egypt, Nigeria, Brazil, Argentina and Colombia
Competitive landscape Leading Companies, Market Positioning of Companies, Competitive Strategies, and Industry Risks

Request Free Sample

Research Analyst Overview

  • The online furniture market's architecture is being rebuilt by interconnected technologies and business models. An effective omnichannel retail strategy is no longer optional, integrating everything from the mobile commerce platform to the back-end supply chain optimization.
  • The front-end experience relies on a sophisticated 3d product configurator and augmented reality visualization, while the back end is powered by a hyper-personalization engine and a robust product information management system. Success requires mastering complex logistics, including last-mile delivery logistics for bulky goods and efficient reverse logistics management for returns.
  • The direct-to-consumer model thrives by leveraging data for on-demand manufacturing and refined user experience design. Furthermore, the market is pivoting toward circular economy principles, making sustainable material sourcing a key differentiator. A well-executed system for data-driven personalization can increase conversion rates by over 18%, proving that technological integration is central to achieving scalable and profitable growth in this competitive sector.

What are the Key Data Covered in this Online Furniture Market Research and Growth Report?

  • What is the expected growth of the Online Furniture Market between 2026 and 2030?

    • USD 343.88 billion, at a CAGR of 23.9%

  • What segmentation does the market report cover?

    • The report is segmented by Application (ORF, and OCF), Product (Living room furniture, Bedroom furniture, Office furniture, and Others), Raw Material (Wood, Metal, Plastic, Glass, and Jade) and Geography (APAC, North America, Europe, Middle East and Africa, South America)

  • Which regions are analyzed in the report?

    • APAC, North America, Europe, Middle East and Africa and South America

  • What are the key growth drivers and market challenges?

    • Proliferation of internet access and mobile commerce, Navigating intricate logistics and supply chain hurdles

  • Who are the major players in the Online Furniture Market?

    • Alibaba Group Holding Ltd., Amazon.com Inc., Ashley Furniture Industries, Bassett Furniture Industries, Castlery Pte Ltd., Crate and Barrel, Flipkart Internet Pvt. Ltd., HNI Corp., Inter IKEA Holding BV, LaZBoy Inc., Pepperfry Pvt. Ltd., Raymour and Flanigan Furniture, Shop Houzz, TradeMango Solutions Inc., Urban Ladder Home Decor Solutions, vidaXL LLC, Walmart Inc., Wayfair Inc., Williams Sonoma Inc. and Zinus Inc.

Market Research Insights

  • The market's dynamic is increasingly shaped by a focus on the omnichannel customer experience, where try-before-you-buy technology mitigates the inherent sensory deficit of online shopping. The integration of social commerce integration into purchasing journeys has become standard, with some platforms reporting a 30% higher conversion rate from social referrals.
  • As brands adopt a robust brand storytelling approach to differentiate, they also contend with rising customer acquisition costs. These costs can be offset by strategies that improve customer lifetime value, as evidenced by niche market specialization firms that achieve up to 40% better retention than generalist retailers. Consequently, balancing brand building with performance marketing is a critical strategic consideration.

We can help! Our analysts can customize this online furniture market research report to meet your requirements.

Get in touch

1. Executive Summary

1.1 Market overview

Executive Summary - Chart on Market Overview
Executive Summary - Data Table on Market Overview
Executive Summary - Chart on Global Market Characteristics
Executive Summary - Chart on Market by Geography
Executive Summary - Chart on Market Segmentation by Application
Executive Summary - Chart on Market Segmentation by Product
Executive Summary - Chart on Market Segmentation by Raw Material
Executive Summary - Chart on Incremental Growth
Executive Summary - Data Table on Incremental Growth
Executive Summary - Chart on Company Market Positioning

2. Technavio Analysis

2.1 Analysis of price sensitivity, lifecycle, customer purchase basket, adoption rates, and purchase criteria

2.2 Criticality of inputs and Factors of differentiation

Chart on Overview on criticality of inputs and factors of differentiation

2.3 Factors of disruption

Chart on Overview on factors of disruption

2.4 Impact of drivers and challenges

Chart on Impact of drivers and challenges in 2025 and 2030

3. Market Landscape

3.1 Market ecosystem

Chart on Parent Market
Data Table on - Parent Market

3.2 Market characteristics

Chart on Market characteristics analysis

3.3 Value chain analysis

Chart on Value chain analysis

4. Market Sizing

4.1 Market definition

Data Table on Offerings of companies included in the market definition

4.2 Market segment analysis

Market segments

4.3 Market size 2025

4.4 Market outlook: Forecast for 2025-2030

Chart on Global - Market size and forecast 2025-2030 ($ million)
Data Table on Global - Market size and forecast 2025-2030 ($ million)
Chart on Global Market: Year-over-year growth 2025-2030 (%)
Data Table on Global Market: Year-over-year growth 2025-2030 (%)

5. Historic Market Size

5.1 Global Online Furniture Market 2020 - 2024

Historic Market Size - Data Table on Global Online Furniture Market 2020 - 2024 ($ million)

5.2 Application segment analysis 2020 - 2024

Historic Market Size - Application Segment 2020 - 2024 ($ million)

5.3 Product segment analysis 2020 - 2024

Historic Market Size - Product Segment 2020 - 2024 ($ million)

5.4 Raw Material segment analysis 2020 - 2024

Historic Market Size - Raw Material Segment 2020 - 2024 ($ million)

5.5 Geography segment analysis 2020 - 2024

Historic Market Size - Geography Segment 2020 - 2024 ($ million)

5.6 Country segment analysis 2020 - 2024

Historic Market Size - Country Segment 2020 - 2024 ($ million)

6. Qualitative Analysis

6.1 The impact of AI on global online furniture market

7. Five Forces Analysis

7.1 Five forces summary

Five forces analysis - Comparison between 2025 and 2030

7.2 Bargaining power of buyers

Bargaining power of buyers - Impact of key factors 2025 and 2030

7.3 Bargaining power of suppliers

Bargaining power of suppliers - Impact of key factors in 2025 and 2030

7.4 Threat of new entrants

Threat of new entrants - Impact of key factors in 2025 and 2030

7.5 Threat of substitutes

Threat of substitutes - Impact of key factors in 2025 and 2030

7.6 Threat of rivalry

Threat of rivalry - Impact of key factors in 2025 and 2030

7.7 Market condition

Chart on Market condition - Five forces 2025 and 2030

8. Market Segmentation by Application

8.1 Market segments

Chart on Application - Market share 2025-2030 (%)
Data Table on Application - Market share 2025-2030 (%)

8.2 Comparison by Application

Chart on Comparison by Application
Data Table on Comparison by Application

8.3 ORF - Market size and forecast 2025-2030

Chart on ORF - Market size and forecast 2025-2030 ($ million)
Data Table on ORF - Market size and forecast 2025-2030 ($ million)
Chart on ORF - Year-over-year growth 2025-2030 (%)
Data Table on ORF - Year-over-year growth 2025-2030 (%)

8.4 OCF - Market size and forecast 2025-2030

Chart on OCF - Market size and forecast 2025-2030 ($ million)
Data Table on OCF - Market size and forecast 2025-2030 ($ million)
Chart on OCF - Year-over-year growth 2025-2030 (%)
Data Table on OCF - Year-over-year growth 2025-2030 (%)

8.5 Market opportunity by Application

Market opportunity by Application ($ million)
Data Table on Market opportunity by Application ($ million)

9. Market Segmentation by Product

9.1 Market segments

Chart on Product - Market share 2025-2030 (%)
Data Table on Product - Market share 2025-2030 (%)

9.2 Comparison by Product

Chart on Comparison by Product
Data Table on Comparison by Product

9.3 Living room furniture - Market size and forecast 2025-2030

Chart on Living room furniture - Market size and forecast 2025-2030 ($ million)
Data Table on Living room furniture - Market size and forecast 2025-2030 ($ million)
Chart on Living room furniture - Year-over-year growth 2025-2030 (%)
Data Table on Living room furniture - Year-over-year growth 2025-2030 (%)

9.4 Bedroom furniture - Market size and forecast 2025-2030

Chart on Bedroom furniture - Market size and forecast 2025-2030 ($ million)
Data Table on Bedroom furniture - Market size and forecast 2025-2030 ($ million)
Chart on Bedroom furniture - Year-over-year growth 2025-2030 (%)
Data Table on Bedroom furniture - Year-over-year growth 2025-2030 (%)

9.5 Office furniture - Market size and forecast 2025-2030

Chart on Office furniture - Market size and forecast 2025-2030 ($ million)
Data Table on Office furniture - Market size and forecast 2025-2030 ($ million)
Chart on Office furniture - Year-over-year growth 2025-2030 (%)
Data Table on Office furniture - Year-over-year growth 2025-2030 (%)

9.6 Others - Market size and forecast 2025-2030

Chart on Others - Market size and forecast 2025-2030 ($ million)
Data Table on Others - Market size and forecast 2025-2030 ($ million)
Chart on Others - Year-over-year growth 2025-2030 (%)
Data Table on Others - Year-over-year growth 2025-2030 (%)

9.7 Market opportunity by Product

Market opportunity by Product ($ million)
Data Table on Market opportunity by Product ($ million)

10. Market Segmentation by Raw Material

10.1 Market segments

Chart on Raw Material - Market share 2025-2030 (%)
Data Table on Raw Material - Market share 2025-2030 (%)

10.2 Comparison by Raw Material

Chart on Comparison by Raw Material
Data Table on Comparison by Raw Material

10.3 Wood - Market size and forecast 2025-2030

Chart on Wood - Market size and forecast 2025-2030 ($ million)
Data Table on Wood - Market size and forecast 2025-2030 ($ million)
Chart on Wood - Year-over-year growth 2025-2030 (%)
Data Table on Wood - Year-over-year growth 2025-2030 (%)

10.4 Metal - Market size and forecast 2025-2030

Chart on Metal - Market size and forecast 2025-2030 ($ million)
Data Table on Metal - Market size and forecast 2025-2030 ($ million)
Chart on Metal - Year-over-year growth 2025-2030 (%)
Data Table on Metal - Year-over-year growth 2025-2030 (%)

10.5 Plastic - Market size and forecast 2025-2030

Chart on Plastic - Market size and forecast 2025-2030 ($ million)
Data Table on Plastic - Market size and forecast 2025-2030 ($ million)
Chart on Plastic - Year-over-year growth 2025-2030 (%)
Data Table on Plastic - Year-over-year growth 2025-2030 (%)

10.6 Glass - Market size and forecast 2025-2030

Chart on Glass - Market size and forecast 2025-2030 ($ million)
Data Table on Glass - Market size and forecast 2025-2030 ($ million)
Chart on Glass - Year-over-year growth 2025-2030 (%)
Data Table on Glass - Year-over-year growth 2025-2030 (%)

10.7 Jade - Market size and forecast 2025-2030

Chart on Jade - Market size and forecast 2025-2030 ($ million)
Data Table on Jade - Market size and forecast 2025-2030 ($ million)
Chart on Jade - Year-over-year growth 2025-2030 (%)
Data Table on Jade - Year-over-year growth 2025-2030 (%)

10.8 Market opportunity by Raw Material

Market opportunity by Raw Material ($ million)
Data Table on Market opportunity by Raw Material ($ million)

11. Customer Landscape

11.1 Customer landscape overview

Analysis of price sensitivity, lifecycle, customer purchase basket, adoption rates, and purchase criteria

12. Geographic Landscape

12.1 Geographic segmentation

Chart on Market share by geography 2025-2030 (%)
Data Table on Market share by geography 2025-2030 (%)

12.2 Geographic comparison

Chart on Geographic comparison
Data Table on Geographic comparison

12.3 APAC - Market size and forecast 2025-2030

Chart on APAC - Market size and forecast 2025-2030 ($ million)
Data Table on APAC - Market size and forecast 2025-2030 ($ million)
Chart on APAC - Year-over-year growth 2025-2030 (%)
Data Table on APAC - Year-over-year growth 2025-2030 (%)
Chart on Regional Comparison - APAC
Data Table on Regional Comparison - APAC

12.3.1 China - Market size and forecast 2025-2030

Chart on China - Market size and forecast 2025-2030 ($ million)
Data Table on China - Market size and forecast 2025-2030 ($ million)
Chart on China - Year-over-year growth 2025-2030 (%)
Data Table on China - Year-over-year growth 2025-2030 (%)

12.3.2 Japan - Market size and forecast 2025-2030

Chart on Japan - Market size and forecast 2025-2030 ($ million)
Data Table on Japan - Market size and forecast 2025-2030 ($ million)
Chart on Japan - Year-over-year growth 2025-2030 (%)
Data Table on Japan - Year-over-year growth 2025-2030 (%)

12.3.3 India - Market size and forecast 2025-2030

Chart on India - Market size and forecast 2025-2030 ($ million)
Data Table on India - Market size and forecast 2025-2030 ($ million)
Chart on India - Year-over-year growth 2025-2030 (%)
Data Table on India - Year-over-year growth 2025-2030 (%)

12.3.4 South Korea - Market size and forecast 2025-2030

Chart on South Korea - Market size and forecast 2025-2030 ($ million)
Data Table on South Korea - Market size and forecast 2025-2030 ($ million)
Chart on South Korea - Year-over-year growth 2025-2030 (%)
Data Table on South Korea - Year-over-year growth 2025-2030 (%)

12.3.5 Australia - Market size and forecast 2025-2030

Chart on Australia - Market size and forecast 2025-2030 ($ million)
Data Table on Australia - Market size and forecast 2025-2030 ($ million)
Chart on Australia - Year-over-year growth 2025-2030 (%)
Data Table on Australia - Year-over-year growth 2025-2030 (%)

12.3.6 Indonesia - Market size and forecast 2025-2030

Chart on Indonesia - Market size and forecast 2025-2030 ($ million)
Data Table on Indonesia - Market size and forecast 2025-2030 ($ million)
Chart on Indonesia - Year-over-year growth 2025-2030 (%)
Data Table on Indonesia - Year-over-year growth 2025-2030 (%)

12.4 North America - Market size and forecast 2025-2030

Chart on North America - Market size and forecast 2025-2030 ($ million)
Data Table on North America - Market size and forecast 2025-2030 ($ million)
Chart on North America - Year-over-year growth 2025-2030 (%)
Data Table on North America - Year-over-year growth 2025-2030 (%)
Chart on Regional Comparison - North America
Data Table on Regional Comparison - North America

12.4.1 US - Market size and forecast 2025-2030

Chart on US - Market size and forecast 2025-2030 ($ million)
Data Table on US - Market size and forecast 2025-2030 ($ million)
Chart on US - Year-over-year growth 2025-2030 (%)
Data Table on US - Year-over-year growth 2025-2030 (%)

12.4.2 Canada - Market size and forecast 2025-2030

Chart on Canada - Market size and forecast 2025-2030 ($ million)
Data Table on Canada - Market size and forecast 2025-2030 ($ million)
Chart on Canada - Year-over-year growth 2025-2030 (%)
Data Table on Canada - Year-over-year growth 2025-2030 (%)

12.4.3 Mexico - Market size and forecast 2025-2030

Chart on Mexico - Market size and forecast 2025-2030 ($ million)
Data Table on Mexico - Market size and forecast 2025-2030 ($ million)
Chart on Mexico - Year-over-year growth 2025-2030 (%)
Data Table on Mexico - Year-over-year growth 2025-2030 (%)

12.5 Europe - Market size and forecast 2025-2030

Chart on Europe - Market size and forecast 2025-2030 ($ million)
Data Table on Europe - Market size and forecast 2025-2030 ($ million)
Chart on Europe - Year-over-year growth 2025-2030 (%)
Data Table on Europe - Year-over-year growth 2025-2030 (%)
Chart on Regional Comparison - Europe
Data Table on Regional Comparison - Europe

12.5.1 UK - Market size and forecast 2025-2030

Chart on UK - Market size and forecast 2025-2030 ($ million)
Data Table on UK - Market size and forecast 2025-2030 ($ million)
Chart on UK - Year-over-year growth 2025-2030 (%)
Data Table on UK - Year-over-year growth 2025-2030 (%)

12.5.2 Germany - Market size and forecast 2025-2030

Chart on Germany - Market size and forecast 2025-2030 ($ million)
Data Table on Germany - Market size and forecast 2025-2030 ($ million)
Chart on Germany - Year-over-year growth 2025-2030 (%)
Data Table on Germany - Year-over-year growth 2025-2030 (%)

12.5.3 France - Market size and forecast 2025-2030

Chart on France - Market size and forecast 2025-2030 ($ million)
Data Table on France - Market size and forecast 2025-2030 ($ million)
Chart on France - Year-over-year growth 2025-2030 (%)
Data Table on France - Year-over-year growth 2025-2030 (%)

12.5.4 Italy - Market size and forecast 2025-2030

Chart on Italy - Market size and forecast 2025-2030 ($ million)
Data Table on Italy - Market size and forecast 2025-2030 ($ million)
Chart on Italy - Year-over-year growth 2025-2030 (%)
Data Table on Italy - Year-over-year growth 2025-2030 (%)

12.5.5 Spain - Market size and forecast 2025-2030

Chart on Spain - Market size and forecast 2025-2030 ($ million)
Data Table on Spain - Market size and forecast 2025-2030 ($ million)
Chart on Spain - Year-over-year growth 2025-2030 (%)
Data Table on Spain - Year-over-year growth 2025-2030 (%)

12.5.6 The Netherlands - Market size and forecast 2025-2030

Chart on The Netherlands - Market size and forecast 2025-2030 ($ million)
Data Table on The Netherlands - Market size and forecast 2025-2030 ($ million)
Chart on The Netherlands - Year-over-year growth 2025-2030 (%)
Data Table on The Netherlands - Year-over-year growth 2025-2030 (%)

12.6 Middle East and Africa - Market size and forecast 2025-2030

Chart on Middle East and Africa - Market size and forecast 2025-2030 ($ million)
Data Table on Middle East and Africa - Market size and forecast 2025-2030 ($ million)
Chart on Middle East and Africa - Year-over-year growth 2025-2030 (%)
Data Table on Middle East and Africa - Year-over-year growth 2025-2030 (%)
Chart on Regional Comparison - Middle East and Africa
Data Table on Regional Comparison - Middle East and Africa

12.6.1 UAE - Market size and forecast 2025-2030

Chart on UAE - Market size and forecast 2025-2030 ($ million)
Data Table on UAE - Market size and forecast 2025-2030 ($ million)
Chart on UAE - Year-over-year growth 2025-2030 (%)
Data Table on UAE - Year-over-year growth 2025-2030 (%)

12.6.2 Saudi Arabia - Market size and forecast 2025-2030

Chart on Saudi Arabia - Market size and forecast 2025-2030 ($ million)
Data Table on Saudi Arabia - Market size and forecast 2025-2030 ($ million)
Chart on Saudi Arabia - Year-over-year growth 2025-2030 (%)
Data Table on Saudi Arabia - Year-over-year growth 2025-2030 (%)

12.6.3 South Africa - Market size and forecast 2025-2030

Chart on South Africa - Market size and forecast 2025-2030 ($ million)
Data Table on South Africa - Market size and forecast 2025-2030 ($ million)
Chart on South Africa - Year-over-year growth 2025-2030 (%)
Data Table on South Africa - Year-over-year growth 2025-2030 (%)

12.6.4 Egypt - Market size and forecast 2025-2030

Chart on Egypt - Market size and forecast 2025-2030 ($ million)
Data Table on Egypt - Market size and forecast 2025-2030 ($ million)
Chart on Egypt - Year-over-year growth 2025-2030 (%)
Data Table on Egypt - Year-over-year growth 2025-2030 (%)

12.6.5 Nigeria - Market size and forecast 2025-2030

Chart on Nigeria - Market size and forecast 2025-2030 ($ million)
Data Table on Nigeria - Market size and forecast 2025-2030 ($ million)
Chart on Nigeria - Year-over-year growth 2025-2030 (%)
Data Table on Nigeria - Year-over-year growth 2025-2030 (%)

12.7 South America - Market size and forecast 2025-2030

Chart on South America - Market size and forecast 2025-2030 ($ million)
Data Table on South America - Market size and forecast 2025-2030 ($ million)
Chart on South America - Year-over-year growth 2025-2030 (%)
Data Table on South America - Year-over-year growth 2025-2030 (%)
Chart on Regional Comparison - South America
Data Table on Regional Comparison - South America

12.7.1 Brazil - Market size and forecast 2025-2030

Chart on Brazil - Market size and forecast 2025-2030 ($ million)
Data Table on Brazil - Market size and forecast 2025-2030 ($ million)
Chart on Brazil - Year-over-year growth 2025-2030 (%)
Data Table on Brazil - Year-over-year growth 2025-2030 (%)

12.7.2 Argentina - Market size and forecast 2025-2030

Chart on Argentina - Market size and forecast 2025-2030 ($ million)
Data Table on Argentina - Market size and forecast 2025-2030 ($ million)
Chart on Argentina - Year-over-year growth 2025-2030 (%)
Data Table on Argentina - Year-over-year growth 2025-2030 (%)

12.7.3 Colombia - Market size and forecast 2025-2030

Chart on Colombia - Market size and forecast 2025-2030 ($ million)
Data Table on Colombia - Market size and forecast 2025-2030 ($ million)
Chart on Colombia - Year-over-year growth 2025-2030 (%)
Data Table on Colombia - Year-over-year growth 2025-2030 (%)

12.8 Market opportunity by geography

Market opportunity by geography ($ million)
Data Tables on Market opportunity by geography ($ million)

13. Drivers, Challenges, and Opportunity

13.1 Market drivers

Proliferation of internet access and mobile commerce
Technological advancements in visualization and platform functionality
Evolving consumer lifestyles and purchasing behaviors

13.2 Market challenges

Navigating intricate logistics and supply chain hurdles
Overcoming inherent sensory deficit and managing costly product returns
Contending with market saturation, intense competition, and margin erosion

13.3 Impact of drivers and challenges

Impact of drivers and challenges in 2025 and 2030

13.4 Market opportunities

Ascendancy of sustainability and circular economy
Proliferation of hyper-personalization and customization
Rise of direct-to-consumer models and niche specialization

14. Competitive Landscape

14.1 Overview

14.2

Overview on criticality of inputs and factors of differentiation

14.3 Landscape disruption

Overview on factors of disruption

14.4 Industry risks

Impact of key risks on business

15. Competitive Analysis

15.1 Companies profiled

Companies covered

15.2 Company ranking index

15.3 Market positioning of companies

Matrix on companies position and classification

15.4 Alibaba Group Holding Ltd.

Alibaba Group Holding Ltd. - Overview
Alibaba Group Holding Ltd. - Business segments
Alibaba Group Holding Ltd. - Key news
Alibaba Group Holding Ltd. - Key offerings
Alibaba Group Holding Ltd. - Segment focus
SWOT

15.5 Amazon.com Inc.

Amazon.com Inc. - Overview
Amazon.com Inc. - Business segments
Amazon.com Inc. - Key news
Amazon.com Inc. - Key offerings
Amazon.com Inc. - Segment focus
SWOT

15.6 Ashley Furniture Industries

Ashley Furniture Industries - Overview
Ashley Furniture Industries - Product / Service
Ashley Furniture Industries - Key offerings
SWOT

15.7 Bassett Furniture Industries

Bassett Furniture Industries - Overview
Bassett Furniture Industries - Business segments
Bassett Furniture Industries - Key offerings
Bassett Furniture Industries - Segment focus
SWOT

15.8 Flipkart Internet Pvt. Ltd.

Flipkart Internet Pvt. Ltd. - Overview
Flipkart Internet Pvt. Ltd. - Product / Service
Flipkart Internet Pvt. Ltd. - Key offerings
SWOT

15.9 HNI Corp.

HNI Corp. - Overview
HNI Corp. - Business segments
HNI Corp. - Key offerings
HNI Corp. - Segment focus
SWOT

15.10 Inter IKEA Holding BV

Inter IKEA Holding BV - Overview
Inter IKEA Holding BV - Product / Service
Inter IKEA Holding BV - Key news
Inter IKEA Holding BV - Key offerings
SWOT

15.11 LaZBoy Inc.

LaZBoy Inc. - Overview
LaZBoy Inc. - Business segments
LaZBoy Inc. - Key offerings
LaZBoy Inc. - Segment focus
SWOT

15.12 Pepperfry Pvt. Ltd.

Pepperfry Pvt. Ltd. - Overview
Pepperfry Pvt. Ltd. - Product / Service
Pepperfry Pvt. Ltd. - Key offerings
SWOT

15.13 Raymour and Flanigan Furniture

Raymour and Flanigan Furniture - Overview
Raymour and Flanigan Furniture - Product / Service
Raymour and Flanigan Furniture - Key offerings
SWOT

15.14 Urban Ladder Home Decor Solutions

Urban Ladder Home Decor Solutions - Overview
Urban Ladder Home Decor Solutions - Product / Service
Urban Ladder Home Decor Solutions - Key offerings
SWOT

15.15 vidaXL LLC

vidaXL LLC - Overview
vidaXL LLC - Product / Service
vidaXL LLC - Key offerings
SWOT

15.16 Walmart Inc.

Walmart Inc. - Overview
Walmart Inc. - Product / Service
Walmart Inc. - Key offerings
SWOT

15.17 Wayfair Inc.

Wayfair Inc. - Overview
Wayfair Inc. - Business segments
Wayfair Inc. - Key offerings
Wayfair Inc. - Segment focus
SWOT

15.18 Williams Sonoma Inc.

Williams Sonoma Inc. - Overview
Williams Sonoma Inc. - Product / Service
Williams Sonoma Inc. - Key offerings
SWOT

16. Appendix

16.1 Scope of the report

Market definition
Objectives
Notes and caveats

16.2 Inclusions and exclusions checklist

Inclusions checklist
Exclusions checklist

16.3 Currency conversion rates for US$

16.4 Research methodology

16.5 Data procurement

Information sources

16.6 Data validation

16.7 Validation techniques employed for market sizing

16.8 Data synthesis

16.9 360 degree market analysis

16.10 List of abbreviations

Research Methodology

Technavio presents a detailed picture of the market by way of study, synthesis, and summation of data from multiple sources. The analysts have presented the various facets of the market with a particular focus on identifying the key industry influencers. The data thus presented is comprehensive, reliable, and the result of extensive research, both primary and secondary.

INFORMATION SOURCES

Primary sources

  • Manufacturers and suppliers
  • Channel partners
  • Industry experts
  • Strategic decision makers

Secondary sources

  • Industry journals and periodicals
  • Government data
  • Financial reports of key industry players
  • Historical data
  • Press releases

DATA ANALYSIS

Data Synthesis

  • Collation of data
  • Estimation of key figures
  • Analysis of derived insights

Data Validation

  • Triangulation with data models
  • Reference against proprietary databases
  • Corroboration with industry experts

REPORT WRITING

Qualitative

  • Market drivers
  • Market challenges
  • Market trends
  • Five forces analysis

Quantitative

  • Market size and forecast
  • Market segmentation
  • Geographical insights
  • Competitive landscape

Interested in this report?

Get your sample now to see our research methodology and insights!

Download Now

Frequently Asked Questions

Online Furniture market growth will increase by USD 343883.3 million during 2026-2030.

The Online Furniture market is expected to grow at a CAGR of 23.9% during 2026-2030.

Online Furniture market is segmented by Application (ORF, OCF) Product (Living room furniture, Bedroom furniture, Office furniture, Others) Raw material (Wood, Metal, Plastic, Glass, Jade)

Alibaba Group Holding Ltd., Amazon.com Inc., Ashley Furniture Industries, Bassett Furniture Industries, Castlery Pte Ltd., Crate and Barrel, Flipkart Internet Pvt. Ltd., HNI Corp., Inter IKEA Holding BV, LaZBoy Inc., Pepperfry Pvt. Ltd., Raymour and Flanigan Furniture, Shop Houzz, TradeMango Solutions Inc., Urban Ladder Home Decor Solutions, vidaXL LLC, Walmart Inc., Wayfair Inc., Williams Sonoma Inc., Zinus Inc. are a few of the key vendors in the Online Furniture market.

APAC will register the highest growth rate of 38.8% among the other regions. Therefore, the Online Furniture market in APAC is expected to garner significant business opportunities for the vendors during the forecast period.

China, Japan, India, South Korea, Australia, Indonesia, US, Canada, Mexico, UK, Germany, France, Italy, Spain, The Netherlands, UAE, Saudi Arabia, South Africa, Egypt, Nigeria, Brazil, Argentina, Colombia

  • Proliferation of internet access and mobile commerce is the driving factor this market.

The Online Furniture market vendors should focus on grabbing business opportunities from the Application segment as it accounted for the largest market share in the base year.