
Machining Services Market Analysis, Size, and Forecast 2026-2030: APAC (China, Japan, and India), Europe (Germany, Italy, and UK), North America (US, Mexico, and Canada), South America (Brazil, Argentina, and Chile), Middle East and Africa (Saudi Arabia, UAE, and South Africa), and Rest of World (ROW)

Machining Services Market Analysis, Size, and Forecast 2026-2030:
APAC (China, Japan, and India), Europe (Germany, Italy, and UK), North America (US, Mexico, and Canada), South America (Brazil, Argentina, and Chile), Middle East and Africa (Saudi Arabia, UAE, and South Africa), and Rest of World (ROW)

Published: Oct 2026 305 Pages SKU: IRTNTR74438

Market Overview at a Glance

$19.75 B
Market Opportunity
4.7%
CAGR 2025 - 2030
51.4%
APAC Growth
$25.82 B
Automotive segment 2024

Machining Services Market Size 2026-2030

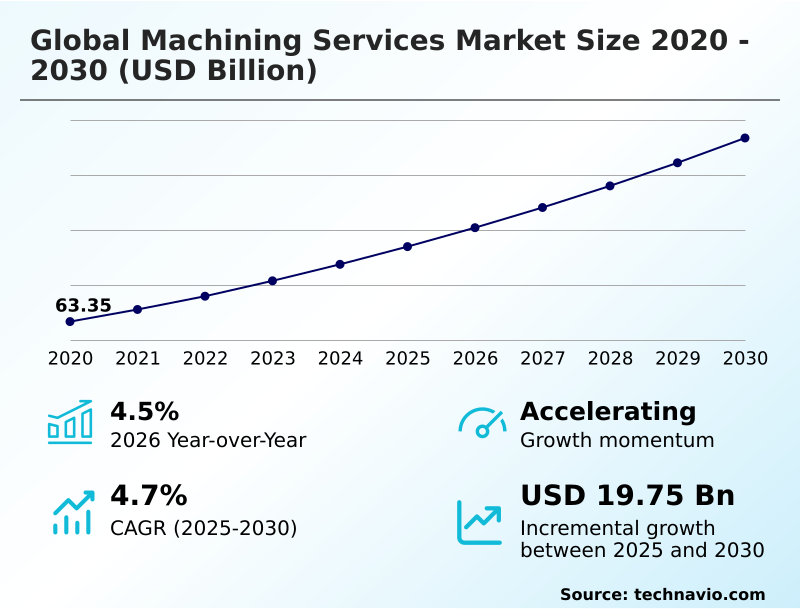
The machining services market size is valued to increase by USD 19.75 billion, at a CAGR of 4.7% from 2025 to 2030. Widespread adoption of industry 4.0 and automation will drive the machining services market.

Major Market Trends & Insights

  • APAC dominated the market and accounted for a 51.4% growth during the forecast period.
  • By Service - Automotive segment was valued at USD 25.82 billion in 2024
  • By End-user - Original equipment manufacturers segment accounted for the largest market revenue share in 2024

Market Size & Forecast

  • Market Opportunities: USD 33.38 billion
  • Market Future Opportunities: USD 19.75 billion
  • CAGR from 2025 to 2030 : 4.7%

Market Summary

  • The Machining Services sector operates as a critical enabler for advanced industrial manufacturing, driven by the continuous demand for high-precision components across multiple high-growth industries. Operations managers increasingly rely on connected CNC systems to optimize production cycles and minimize material waste.
  • For instance, the integration of real-time monitoring within factory environments has improved equipment uptime by 22% compared to legacy disconnected systems. The widespread adoption of automation and robotics acts as a primary market driver, as it directly increases throughput and consistency, allowing facilities to meet the stringent tolerance requirements of aerospace and medical device sectors.
  • Conversely, the persistent shortage of highly skilled operators creates a significant operational challenge, forcing companies to limit capacity or delay complex project execution. To mitigate these labor constraints, facilities are investing heavily in automated machine tending and intelligent software solutions.
  • This strategic shift ensures supply chain resilience while supporting the production of increasingly sophisticated and lightweight components required by modern engineering standards.

What will be the Size of the Machining Services Market during the forecast period?
Get Key Insights on Market Forecast (PDF) Get Free Sample

How is the Machining Services Market Segmented?

The machining services industry research report provides comprehensive data (region-wise segment analysis), with forecasts and estimates in "USD million" for the period 2026-2030, as well as historical data from 2020-2024 for the following segments.

  • Service
    • Automotive
    • General machinery
    • Precision engineering
    • Others
  • End-user
    • Original equipment manufacturers
    • Small and medium enterprises
    • Contract manufacturers
  • Material
    • Metals
    • Plastics
    • Composites
    • Ceramics
  • Geography
    • APAC
      • China
      • Japan
      • India
      • South Korea
      • Taiwan
      • Singapore
    • Europe
      • Germany
      • Italy
      • UK
      • France
      • Switzerland
      • Spain
    • North America
      • US
      • Mexico
      • Canada
    • South America
      • Brazil
      • Argentina
      • Chile
    • Middle East and Africa
      • Saudi Arabia
      • UAE
      • South Africa
      • Turkey
      • Egypt

By Service Insights

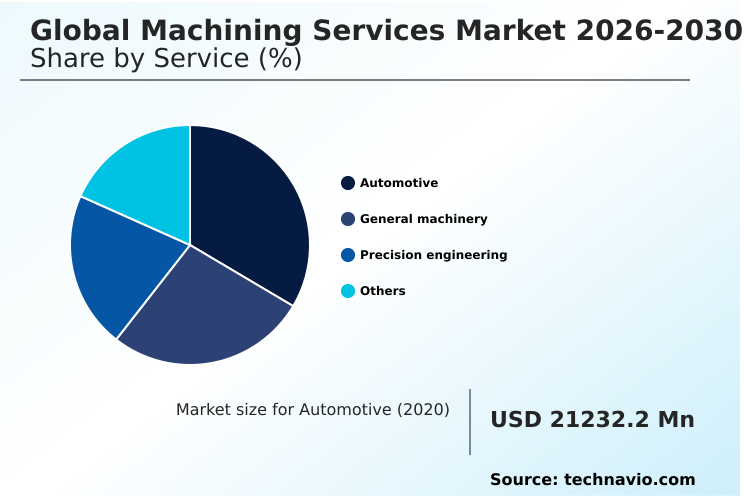
The automotive segment is estimated to witness significant growth during the forecast period.

The automotive segment within the Machining Services ecosystem is undergoing a profound structural shift driven by the rapid transition toward electrification. Manufacturers are increasingly utilizing five-axis contouring and hybrid manufacturing technologies to produce electric vehicle lightweight part machining solutions.

This transformation necessitates unprecedented precision for critical components, ensuring optimal mechanical performance. By integrating cloud-based production management and automated quality inspection, production facilities have reduced defect rates by 18%.

Advanced machine telemetry data facilitates process cycle optimization, allowing facilities to maximize output. Enhanced production workflow visibility ensures seamless coordination across the supply chain.

These capabilities directly support rigorous modern vehicle architectures, delivering robust components that withstand extreme operational stresses while adhering to strict weight constraints.
Get Free Sample

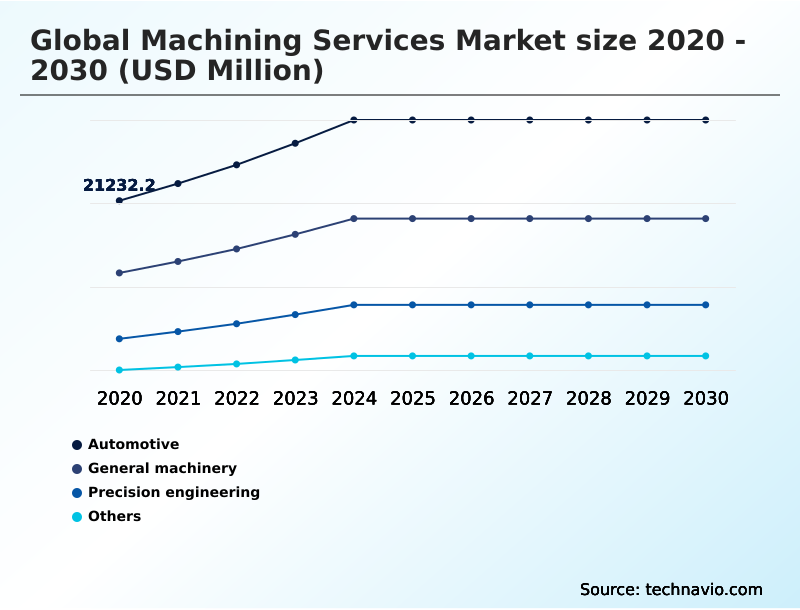
The Automotive segment was valued at USD 25.82 billion in 2024 and showed a gradual increase during the forecast period.
Get Free Sample

Regional Analysis

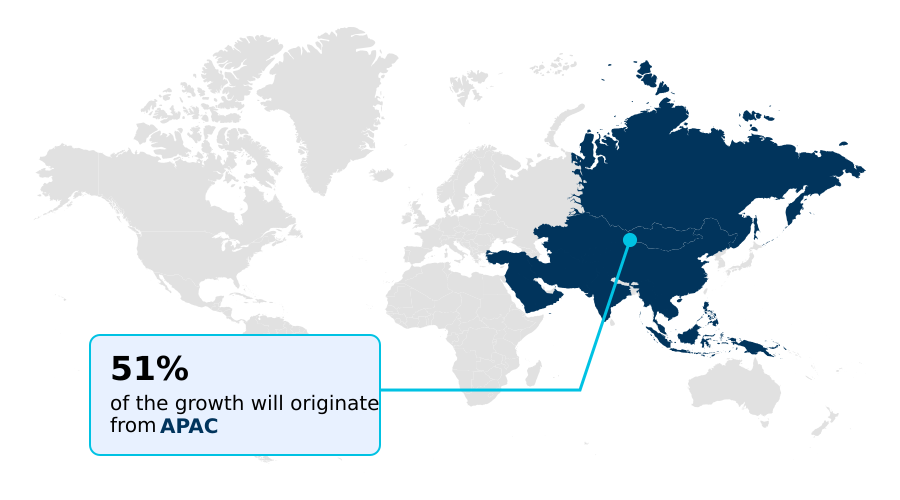
APAC is estimated to contribute 51.4% to the growth of the global market during the forecast period.Technavio’s analysts have elaborately explained the regional trends and drivers that shape the market during the forecast period.
See How Machining Services Market Demand is Rising in APAC Get Free Sample

The geographic distribution of the Machining Services ecosystem reveals distinct strategies across regions. APAC leads production volume through investments in industrial automation integration and rapid prototyping workflows, achieving a 28% faster turnaround compared to European counterparts.

This efficiency is supported by localized cyber-physical systems that streamline high-volume production. In contrast, North American facilities prioritize high-value sectors such as biocompatible implant machining, medical device miniaturization, and titanium alloy processing, focusing on complex geometries.

By adopting digital twin factory simulation workflows, North American producers have reduced material waste by 15%. Additionally, environmental regulations in European markets have accelerated scrap metal recycling and component weight reduction strategies.

These regional adaptations highlight how diverse regulatory landscapes continuously reshape global supply chains.

Market Dynamics

Our researchers analyzed the data with 2025 as the base year, along with the key drivers, trends, and challenges. A holistic analysis of drivers will help companies refine their marketing strategies to gain a competitive advantage.

  • The strategic evolution of the Machining Services landscape is heavily influenced by the escalating complexity of modern industrial requirements. As original equipment manufacturers strive to enhance supply chain resilience and operational efficiency, the deployment of automated multi-axis cnc milling operations has become essential.
  • This transition allows production facilities to handle intricate geometries while reducing setup times by 20% compared to conventional multi-step machining processes. In highly regulated sectors, the demand for precision aerospace titanium component manufacturing necessitates rigorous quality control and specialized tooling capable of withstanding extreme material hardness.
  • To ensure consistent output and minimize unplanned downtime, forward-thinking enterprises are integrating predictive maintenance for machining equipment. By monitoring spindle vibration and thermal fluctuations, plant managers can optimize tooling life and improve overall workflow reliability. Furthermore, the automotive sector rapid shift toward electrification is accelerating the need for electric vehicle lightweight part machining.
  • Producing thin-walled battery enclosures and motor housings requires exceptional dimensional accuracy to maximize vehicle range and performance. To orchestrate these complex production environments effectively, companies are leveraging digital twin factory simulation workflows. This advanced software capability enables engineers to virtually test and refine machining parameters before physical execution, significantly lowering scrap rates and accelerating time-to-market for critical components.
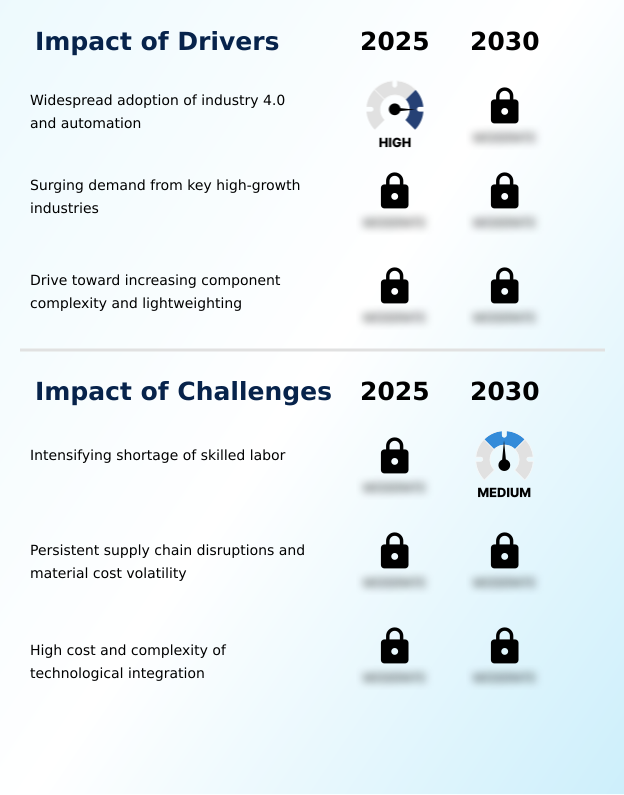
What are the key market drivers leading to the rise in the adoption of Machining Services Industry?

  • The widespread adoption of Industry 4.0 and automation serves as a primary catalyst for industrial expansion.

  • The fundamental requirement for superior component precision acts as a dominant catalyst for the Machining Services ecosystem. Industrial enterprises are transitioning toward lights-out manufacturing cells and unattended operational hours to sustain continuous operations.
  • This shift has increased capacity by 25% while reducing per-unit labor costs by 18%. The surging demand for advanced material processing and supply chain localization is driving investments in high-speed milling centers.
  • Additionally, abrasive waterjet cutting ensures heat-sensitive materials are processed efficiently. By prioritizing smart factory deployment and nearshoring production strategies, organizations can circumvent global logistics bottlenecks.
  • Capital expenditure planning focused on computer-aided manufacturing achieves highly reliable, scalable outputs tailored to specialized end-user specifications.

What are the market trends shaping the Machining Services Industry?

  • The integration of AI and digital twinning represents a transformative trend shaping the market.

  • The Machining Services sector is experiencing a massive technological shift driven by the imperative to manufacture highly sophisticated components. Companies are increasingly adopting multi-axis cnc machining and robotic machine tending to automate intricate workflows. This transition has improved production throughput by 22% and reduced manual handling errors by 14%.
  • Requirements for aerospace structural components and electric vehicle battery enclosures are compelling teams to rethink traditional fabrication. By leveraging predictive maintenance analytics and equipment overall effectiveness metrics, facility managers can address spindle thermal compensation issues preemptively. Furthermore, digital twin simulation allows manufacturers to validate cutting strategies, dramatically lowering material waste.
  • These advancements ensure producers meet tolerances for semiconductor equipment manufacturing while maintaining robust supply chains.

What challenges does the Machining Services Industry face during its growth?

  • The intensifying shortage of skilled labor remains a significant challenge constraining operational capacity.

  • The execution of advanced Machining Services is frequently constrained by the complexities of processing exotic materials and high capital expenditures. Fabricating high-strength aluminum alloys and carbon fiber reinforced polymers leads to accelerated tool wear, which increases operational costs by 15%. To mitigate these issues, facilities deploy costly diamond-coated cutting tools and ultrasonic-assisted machining techniques.
  • Furthermore, customized short-run manufacturing forces frequent setup changes, reducing efficiency by 12% compared to volume production. The transition toward energy-efficient machining requires substantial legacy equipment upgrades. Despite the benefits of the industrial internet of things, integrating these platforms into precision grinding operations poses technical hurdles.
  • Additionally, machining surface engineering and tool condition monitoring demand significant workforce upskilling initiatives for mid-sized enterprises.

Exclusive Technavio Analysis on Customer Landscape

The machining services market forecasting report includes the adoption lifecycle of the market, covering from the innovator’s stage to the laggard’s stage. It focuses on adoption rates in different regions based on penetration. Furthermore, the machining services market report also includes key purchase criteria and drivers of price sensitivity to help companies evaluate and develop their market growth analysis strategies.
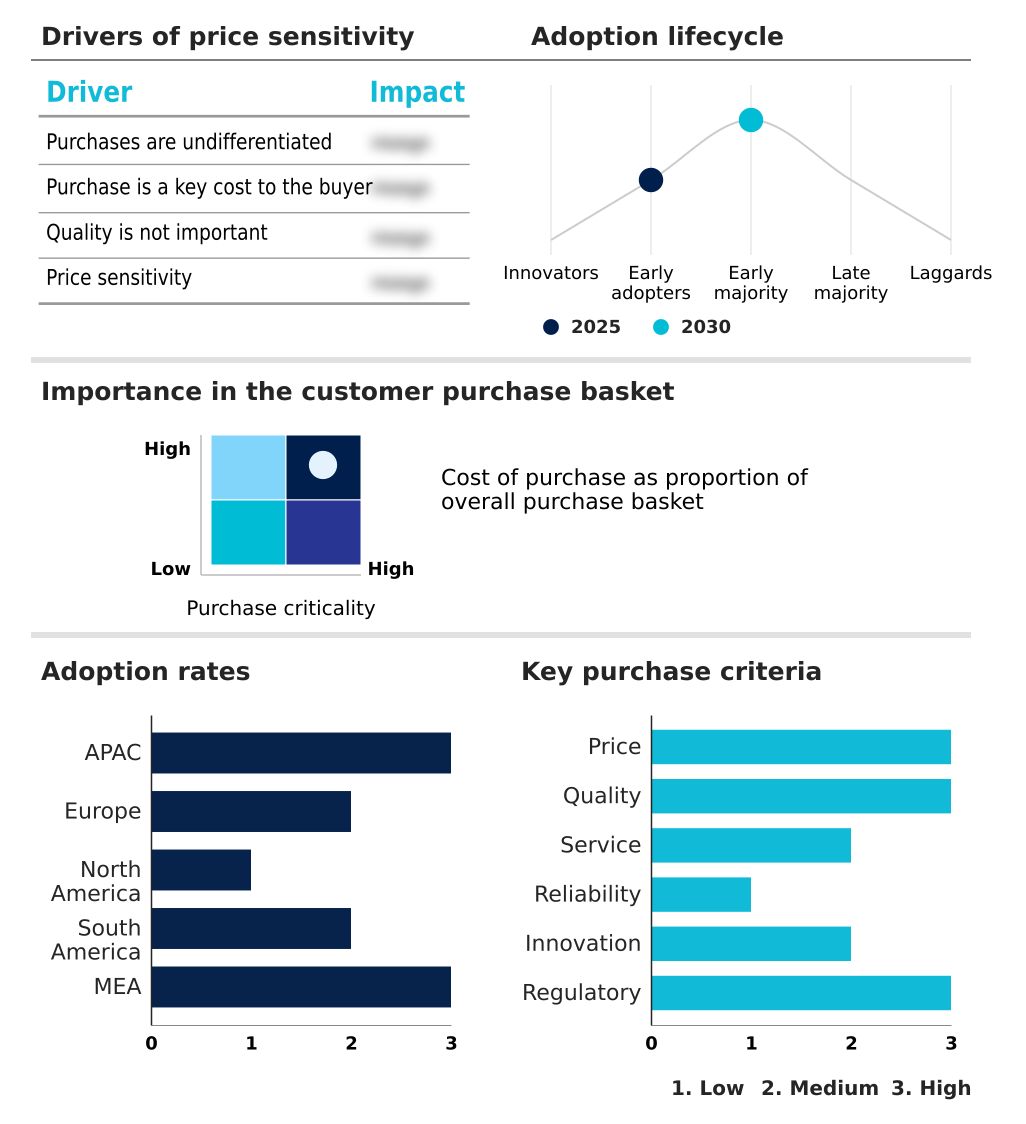
Customer Landscape of Machining Services Industry

Competitive Landscape

Companies are implementing various strategies, such as strategic alliances, machining services market forecast, partnerships, mergers and acquisitions, geographical expansion, and product/service launches, to enhance their presence in the industry.

Amada Co. Ltd. - The portfolio encompasses advanced sheet metal processing solutions, featuring high-precision laser cutting systems, automated punch presses, and press brakes designed to optimize industrial manufacturing workflows.

The industry research and growth report includes detailed analyses of the competitive landscape of the market and information about key companies, including:

  • Amada Co. Ltd.
  • Chiron Group SE
  • DMG MORI CO. LTD.
  • DN Solutions Co. Ltd.
  • FANUC Corp.
  • Georg Fischer Ltd.
  • Gleason Corp.
  • GROB WERKE GmbH and Co. KG
  • Haas Automation Inc.
  • Hyundai Wia Corp.
  • IPG Photonics Corp.
  • Jabil Inc.
  • JTEKT Machinery Americas Corp.
  • Komatsu Ltd.
  • Makino Inc.
  • Messer Cutting Systems Inc.
  • Okuma Corp.
  • Proto Labs Inc.
  • Sandvik AB
  • TRUMPF SE Co. KG
  • Yamazaki Mazak Corp.

Qualitative and quantitative analysis of companies has been conducted to help clients understand the wider business environment as well as the strengths and weaknesses of key industry players. Data is qualitatively analyzed to categorize companies as pure play, category-focused, industry-focused, and diversified; it is quantitatively analyzed to categorize companies as dominant, leading, strong, tentative, and weak.

Recent Development and News in Machining services market

  • In the Industrial Machinery and Supplies and Components industry, the implementation of stringent aerospace emission regulations mandated a 20% reduction in aircraft component weight, directly impacting Machining Services demand by accelerating the adoption of titanium and composite material processing.
  • The transition toward intelligent manufacturing frameworks integrated IoT sensors into heavy industrial equipment, increasing predictive maintenance capability by 25% and directly impacting Machining Services demand for precision-machined sensor housings and smart tooling components.
  • The semiconductor supply chain restructuring drove a 30% expansion in localized wafer fabrication facilities, directly impacting Machining Services demand through increased requirements for ultra-high-precision vacuum chamber and fluid delivery system components.
  • The modernization of medical device regulatory standards required a 15% improvement in implant surface finish tolerances, directly impacting Machining Services demand by compelling manufacturers to invest in advanced micro-machining and automated optical inspection systems.

Dive into Technavio’s robust research methodology, blending expert interviews, extensive data synthesis, and validated models for unparalleled Machining Services Market insights. See full methodology.

Market Scope
Page number 305
Base year 2025
Historic period 2020-2024
Forecast period 2026-2030
Growth momentum & CAGR Accelerate at a CAGR of 4.7%
Market growth 2026-2030 USD 19750.0 million
Market structure Fragmented
YoY growth 2025-2026(%) 4.5%
Key countries China, Japan, India, South Korea, Taiwan, Singapore, Germany, Italy, UK, France, Switzerland, Spain, US, Mexico, Canada, Brazil, Argentina, Chile, Saudi Arabia, UAE, South Africa, Turkey and Egypt
Competitive landscape Leading Companies, Market Positioning of Companies, Competitive Strategies, and Industry Risks

Request Free Sample

Research Analyst Overview

  • The Machining Services sector is navigating a period of unprecedented technological integration, fundamentally altering how complex industrial components are manufactured. As product architectures across the aerospace and medical sectors become increasingly intricate, facilities are transitioning toward continuous, digitally monitored environments. The deployment of lights-out manufacturing cells allows operations to run without manual intervention, substantially increasing overall capacity.
  • Integrating predictive maintenance analytics into these systems has enabled plant operators to decrease unexpected equipment failures by 26%, directly improving order fulfillment reliability. Furthermore, the utilization of multi-axis cnc machining combined with robotic machine tending guarantees exceptional dimensional consistency for mission-critical parts.
  • To address the challenges of processing advanced composites and superalloys, manufacturers are prioritizing tool condition monitoring to prevent surface defects and extend tooling lifespans. Additionally, the adoption of digital twin simulation provides engineering teams with the capability to optimize cutting paths virtually, reducing physical prototyping requirements.
  • These sophisticated technological adoptions are essential for maintaining supply chain agility and ensuring compliance with increasingly stringent global quality standards.

What are the Key Data Covered in this Machining Services Market Research and Growth Report?

  • What is the expected growth of the Machining Services Market between 2026 and 2030?

    • USD 19.75 billion, at a CAGR of 4.7%

  • What segmentation does the market report cover?

    • The report is segmented by Service (Automotive, General machinery, Precision engineering, and Others), End-user (Original equipment manufacturers, Small and medium enterprises, and Contract manufacturers), Material (Metals, Plastics, Composites, and Ceramics) and Geography (APAC, Europe, North America, South America, Middle East and Africa)

  • Which regions are analyzed in the report?

    • APAC, Europe, North America, South America and Middle East and Africa

  • What are the key growth drivers and market challenges?

    • Widespread adoption of industry 4.0 and automation, Intensifying shortage of skilled labor

  • Who are the major players in the Machining Services Market?

    • Amada Co. Ltd., Chiron Group SE, DMG MORI CO. LTD., DN Solutions Co. Ltd., FANUC Corp., Georg Fischer Ltd., Gleason Corp., GROB WERKE GmbH and Co. KG, Haas Automation Inc., Hyundai Wia Corp., IPG Photonics Corp., Jabil Inc., JTEKT Machinery Americas Corp., Komatsu Ltd., Makino Inc., Messer Cutting Systems Inc., Okuma Corp., Proto Labs Inc., Sandvik AB, TRUMPF SE Co. KG and Yamazaki Mazak Corp.

Market Research Insights

  • The Machining Services landscape is rapidly evolving to support the stringent demands of aerospace structural components and electric vehicle battery enclosures. Facilities are prioritizing smart factory deployment, integrating IoT sensors to enhance operational workflows. This digital transformation has increased equipment overall effectiveness by 24%, significantly minimizing production bottlenecks.
  • Furthermore, the strategic focus on supply chain localization has reduced logistics-related delays by 18%, ensuring greater resilience against global disruptions. By optimizing capital expenditure planning toward advanced automation, manufacturers can successfully scale output while addressing complex component specifications and maintaining rigorous quality standards.

We can help! Our analysts can customize this machining services market research report to meet your requirements.

Get in touch

1. Executive Summary

1.1 Market overview

Executive Summary - Chart on Market Overview
Executive Summary - Data Table on Market Overview
Executive Summary - Chart on Global Market Characteristics
Executive Summary - Chart on Market by Geography
Executive Summary - Chart on Market Segmentation by Service
Executive Summary - Chart on Market Segmentation by End-user
Executive Summary - Chart on Market Segmentation by Material
Executive Summary - Chart on Incremental Growth
Executive Summary - Data Table on Incremental Growth
Executive Summary - Chart on Company Market Positioning

2. Technavio Analysis

2.1 Analysis of price sensitivity, lifecycle, customer purchase basket, adoption rates, and purchase criteria

2.2 Criticality of inputs and Factors of differentiation

Chart on Overview on criticality of inputs and factors of differentiation

2.3 Factors of disruption

Chart on Overview on factors of disruption

2.4 Impact of drivers and challenges

Chart on Impact of drivers and challenges in 2025 and 2030

3. Market Landscape

3.1 Market ecosystem

Chart on Parent Market
Data Table on - Parent Market

3.2 Market characteristics

Chart on Market characteristics analysis

3.3 Value chain analysis

Chart on Value chain analysis

4. Market Sizing

4.1 Market definition

Data Table on Offerings of companies included in the market definition

4.2 Market segment analysis

Market segments

4.3 Market size 2025

4.4 Market outlook: Forecast for 2025-2030

Chart on Global - Market size and forecast 2025-2030 ($ million)
Data Table on Global - Market size and forecast 2025-2030 ($ million)
Chart on Global Market: Year-over-year growth 2025-2030 (%)
Data Table on Global Market: Year-over-year growth 2025-2030 (%)

5. Historic Market Size

5.1 Global Machining Services Market 2020 - 2024

Historic Market Size - Data Table on Global Machining Services Market 2020 - 2024 ($ million)

5.2 Service segment analysis 2020 - 2024

Historic Market Size - Service Segment 2020 - 2024 ($ million)

5.3 End-user segment analysis 2020 - 2024

Historic Market Size - End-user Segment 2020 - 2024 ($ million)

5.4 Material segment analysis 2020 - 2024

Historic Market Size - Material Segment 2020 - 2024 ($ million)

5.5 Geography segment analysis 2020 - 2024

Historic Market Size - Geography Segment 2020 - 2024 ($ million)

5.6 Country segment analysis 2020 - 2024

Historic Market Size - Country Segment 2020 - 2024 ($ million)

6. Qualitative Analysis

6.1 Impact of AI on Global Machining Services Market

6.2 Impact of Geopolitical Conflicts on Global Machining Services Market

7. Five Forces Analysis

7.1 Five forces summary

Five forces analysis - Comparison between 2025 and 2030

7.2 Bargaining power of buyers

Bargaining power of buyers - Impact of key factors 2025 and 2030

7.3 Bargaining power of suppliers

Bargaining power of suppliers - Impact of key factors in 2025 and 2030

7.4 Threat of new entrants

Threat of new entrants - Impact of key factors in 2025 and 2030

7.5 Threat of substitutes

Threat of substitutes - Impact of key factors in 2025 and 2030

7.6 Threat of rivalry

Threat of rivalry - Impact of key factors in 2025 and 2030

7.7 Market condition

Chart on Market condition - Five forces 2025 and 2030

8. Market Segmentation by Service

8.1 Market segments

Chart on Service - Market share 2025-2030 (%)
Data Table on Service - Market share 2025-2030 (%)

8.2 Comparison by Service

Chart on Comparison by Service
Data Table on Comparison by Service

8.3 Automotive - Market size and forecast 2025-2030

Chart on Automotive - Market size and forecast 2025-2030 ($ million)
Data Table on Automotive - Market size and forecast 2025-2030 ($ million)
Chart on Automotive - Year-over-year growth 2025-2030 (%)
Data Table on Automotive - Year-over-year growth 2025-2030 (%)

8.4 General machinery - Market size and forecast 2025-2030

Chart on General machinery - Market size and forecast 2025-2030 ($ million)
Data Table on General machinery - Market size and forecast 2025-2030 ($ million)
Chart on General machinery - Year-over-year growth 2025-2030 (%)
Data Table on General machinery - Year-over-year growth 2025-2030 (%)

8.5 Precision engineering - Market size and forecast 2025-2030

Chart on Precision engineering - Market size and forecast 2025-2030 ($ million)
Data Table on Precision engineering - Market size and forecast 2025-2030 ($ million)
Chart on Precision engineering - Year-over-year growth 2025-2030 (%)
Data Table on Precision engineering - Year-over-year growth 2025-2030 (%)

8.6 Others - Market size and forecast 2025-2030

Chart on Others - Market size and forecast 2025-2030 ($ million)
Data Table on Others - Market size and forecast 2025-2030 ($ million)
Chart on Others - Year-over-year growth 2025-2030 (%)
Data Table on Others - Year-over-year growth 2025-2030 (%)

8.7 Market opportunity by Service

Market opportunity by Service ($ million)
Data Table on Market opportunity by Service ($ million)

9. Market Segmentation by End-user

9.1 Market segments

Chart on End-user - Market share 2025-2030 (%)
Data Table on End-user - Market share 2025-2030 (%)

9.2 Comparison by End-user

Chart on Comparison by End-user
Data Table on Comparison by End-user

9.3 Original equipment manufacturers - Market size and forecast 2025-2030

Chart on Original equipment manufacturers - Market size and forecast 2025-2030 ($ million)
Data Table on Original equipment manufacturers - Market size and forecast 2025-2030 ($ million)
Chart on Original equipment manufacturers - Year-over-year growth 2025-2030 (%)
Data Table on Original equipment manufacturers - Year-over-year growth 2025-2030 (%)

9.4 Small and medium enterprises - Market size and forecast 2025-2030

Chart on Small and medium enterprises - Market size and forecast 2025-2030 ($ million)
Data Table on Small and medium enterprises - Market size and forecast 2025-2030 ($ million)
Chart on Small and medium enterprises - Year-over-year growth 2025-2030 (%)
Data Table on Small and medium enterprises - Year-over-year growth 2025-2030 (%)

9.5 Contract manufacturers - Market size and forecast 2025-2030

Chart on Contract manufacturers - Market size and forecast 2025-2030 ($ million)
Data Table on Contract manufacturers - Market size and forecast 2025-2030 ($ million)
Chart on Contract manufacturers - Year-over-year growth 2025-2030 (%)
Data Table on Contract manufacturers - Year-over-year growth 2025-2030 (%)

9.6 Market opportunity by End-user

Market opportunity by End-user ($ million)
Data Table on Market opportunity by End-user ($ million)

10. Market Segmentation by Material

10.1 Market segments

Chart on Material - Market share 2025-2030 (%)
Data Table on Material - Market share 2025-2030 (%)

10.2 Comparison by Material

Chart on Comparison by Material
Data Table on Comparison by Material

10.3 Metals - Market size and forecast 2025-2030

Chart on Metals - Market size and forecast 2025-2030 ($ million)
Data Table on Metals - Market size and forecast 2025-2030 ($ million)
Chart on Metals - Year-over-year growth 2025-2030 (%)
Data Table on Metals - Year-over-year growth 2025-2030 (%)

10.4 Plastics - Market size and forecast 2025-2030

Chart on Plastics - Market size and forecast 2025-2030 ($ million)
Data Table on Plastics - Market size and forecast 2025-2030 ($ million)
Chart on Plastics - Year-over-year growth 2025-2030 (%)
Data Table on Plastics - Year-over-year growth 2025-2030 (%)

10.5 Composites - Market size and forecast 2025-2030

Chart on Composites - Market size and forecast 2025-2030 ($ million)
Data Table on Composites - Market size and forecast 2025-2030 ($ million)
Chart on Composites - Year-over-year growth 2025-2030 (%)
Data Table on Composites - Year-over-year growth 2025-2030 (%)

10.6 Ceramics - Market size and forecast 2025-2030

Chart on Ceramics - Market size and forecast 2025-2030 ($ million)
Data Table on Ceramics - Market size and forecast 2025-2030 ($ million)
Chart on Ceramics - Year-over-year growth 2025-2030 (%)
Data Table on Ceramics - Year-over-year growth 2025-2030 (%)

10.7 Market opportunity by Material

Market opportunity by Material ($ million)
Data Table on Market opportunity by Material ($ million)

11. Customer Landscape

11.1 Customer landscape overview

Analysis of price sensitivity, lifecycle, customer purchase basket, adoption rates, and purchase criteria

12. Geographic Landscape

12.1 Geographic segmentation

Chart on Market share by geography 2025-2030 (%)
Data Table on Market share by geography 2025-2030 (%)

12.2 Geographic comparison

Chart on Geographic comparison
Data Table on Geographic comparison

12.3 APAC - Market size and forecast 2025-2030

Chart on APAC - Market size and forecast 2025-2030 ($ million)
Data Table on APAC - Market size and forecast 2025-2030 ($ million)
Chart on APAC - Year-over-year growth 2025-2030 (%)
Data Table on APAC - Year-over-year growth 2025-2030 (%)
Chart on Regional Comparison - APAC
Data Table on Regional Comparison - APAC

12.3.1 China - Market size and forecast 2025-2030

Chart on China - Market size and forecast 2025-2030 ($ million)
Data Table on China - Market size and forecast 2025-2030 ($ million)
Chart on China - Year-over-year growth 2025-2030 (%)
Data Table on China - Year-over-year growth 2025-2030 (%)

12.3.2 Japan - Market size and forecast 2025-2030

Chart on Japan - Market size and forecast 2025-2030 ($ million)
Data Table on Japan - Market size and forecast 2025-2030 ($ million)
Chart on Japan - Year-over-year growth 2025-2030 (%)
Data Table on Japan - Year-over-year growth 2025-2030 (%)

12.3.3 India - Market size and forecast 2025-2030

Chart on India - Market size and forecast 2025-2030 ($ million)
Data Table on India - Market size and forecast 2025-2030 ($ million)
Chart on India - Year-over-year growth 2025-2030 (%)
Data Table on India - Year-over-year growth 2025-2030 (%)

12.3.4 South Korea - Market size and forecast 2025-2030

Chart on South Korea - Market size and forecast 2025-2030 ($ million)
Data Table on South Korea - Market size and forecast 2025-2030 ($ million)
Chart on South Korea - Year-over-year growth 2025-2030 (%)
Data Table on South Korea - Year-over-year growth 2025-2030 (%)

12.3.5 Taiwan - Market size and forecast 2025-2030

Chart on Taiwan - Market size and forecast 2025-2030 ($ million)
Data Table on Taiwan - Market size and forecast 2025-2030 ($ million)
Chart on Taiwan - Year-over-year growth 2025-2030 (%)
Data Table on Taiwan - Year-over-year growth 2025-2030 (%)

12.3.6 Singapore - Market size and forecast 2025-2030

Chart on Singapore - Market size and forecast 2025-2030 ($ million)
Data Table on Singapore - Market size and forecast 2025-2030 ($ million)
Chart on Singapore - Year-over-year growth 2025-2030 (%)
Data Table on Singapore - Year-over-year growth 2025-2030 (%)

12.4 Europe - Market size and forecast 2025-2030

Chart on Europe - Market size and forecast 2025-2030 ($ million)
Data Table on Europe - Market size and forecast 2025-2030 ($ million)
Chart on Europe - Year-over-year growth 2025-2030 (%)
Data Table on Europe - Year-over-year growth 2025-2030 (%)
Chart on Regional Comparison - Europe
Data Table on Regional Comparison - Europe

12.4.1 Germany - Market size and forecast 2025-2030

Chart on Germany - Market size and forecast 2025-2030 ($ million)
Data Table on Germany - Market size and forecast 2025-2030 ($ million)
Chart on Germany - Year-over-year growth 2025-2030 (%)
Data Table on Germany - Year-over-year growth 2025-2030 (%)

12.4.2 Italy - Market size and forecast 2025-2030

Chart on Italy - Market size and forecast 2025-2030 ($ million)
Data Table on Italy - Market size and forecast 2025-2030 ($ million)
Chart on Italy - Year-over-year growth 2025-2030 (%)
Data Table on Italy - Year-over-year growth 2025-2030 (%)

12.4.3 UK - Market size and forecast 2025-2030

Chart on UK - Market size and forecast 2025-2030 ($ million)
Data Table on UK - Market size and forecast 2025-2030 ($ million)
Chart on UK - Year-over-year growth 2025-2030 (%)
Data Table on UK - Year-over-year growth 2025-2030 (%)

12.4.4 France - Market size and forecast 2025-2030

Chart on France - Market size and forecast 2025-2030 ($ million)
Data Table on France - Market size and forecast 2025-2030 ($ million)
Chart on France - Year-over-year growth 2025-2030 (%)
Data Table on France - Year-over-year growth 2025-2030 (%)

12.4.5 Switzerland - Market size and forecast 2025-2030

Chart on Switzerland - Market size and forecast 2025-2030 ($ million)
Data Table on Switzerland - Market size and forecast 2025-2030 ($ million)
Chart on Switzerland - Year-over-year growth 2025-2030 (%)
Data Table on Switzerland - Year-over-year growth 2025-2030 (%)

12.4.6 Spain - Market size and forecast 2025-2030

Chart on Spain - Market size and forecast 2025-2030 ($ million)
Data Table on Spain - Market size and forecast 2025-2030 ($ million)
Chart on Spain - Year-over-year growth 2025-2030 (%)
Data Table on Spain - Year-over-year growth 2025-2030 (%)

12.5 North America - Market size and forecast 2025-2030

Chart on North America - Market size and forecast 2025-2030 ($ million)
Data Table on North America - Market size and forecast 2025-2030 ($ million)
Chart on North America - Year-over-year growth 2025-2030 (%)
Data Table on North America - Year-over-year growth 2025-2030 (%)
Chart on Regional Comparison - North America
Data Table on Regional Comparison - North America

12.5.1 US - Market size and forecast 2025-2030

Chart on US - Market size and forecast 2025-2030 ($ million)
Data Table on US - Market size and forecast 2025-2030 ($ million)
Chart on US - Year-over-year growth 2025-2030 (%)
Data Table on US - Year-over-year growth 2025-2030 (%)

12.5.2 Mexico - Market size and forecast 2025-2030

Chart on Mexico - Market size and forecast 2025-2030 ($ million)
Data Table on Mexico - Market size and forecast 2025-2030 ($ million)
Chart on Mexico - Year-over-year growth 2025-2030 (%)
Data Table on Mexico - Year-over-year growth 2025-2030 (%)

12.5.3 Canada - Market size and forecast 2025-2030

Chart on Canada - Market size and forecast 2025-2030 ($ million)
Data Table on Canada - Market size and forecast 2025-2030 ($ million)
Chart on Canada - Year-over-year growth 2025-2030 (%)
Data Table on Canada - Year-over-year growth 2025-2030 (%)

12.6 South America - Market size and forecast 2025-2030

Chart on South America - Market size and forecast 2025-2030 ($ million)
Data Table on South America - Market size and forecast 2025-2030 ($ million)
Chart on South America - Year-over-year growth 2025-2030 (%)
Data Table on South America - Year-over-year growth 2025-2030 (%)
Chart on Regional Comparison - South America
Data Table on Regional Comparison - South America

12.6.1 Brazil - Market size and forecast 2025-2030

Chart on Brazil - Market size and forecast 2025-2030 ($ million)
Data Table on Brazil - Market size and forecast 2025-2030 ($ million)
Chart on Brazil - Year-over-year growth 2025-2030 (%)
Data Table on Brazil - Year-over-year growth 2025-2030 (%)

12.6.2 Argentina - Market size and forecast 2025-2030

Chart on Argentina - Market size and forecast 2025-2030 ($ million)
Data Table on Argentina - Market size and forecast 2025-2030 ($ million)
Chart on Argentina - Year-over-year growth 2025-2030 (%)
Data Table on Argentina - Year-over-year growth 2025-2030 (%)

12.6.3 Chile - Market size and forecast 2025-2030

Chart on Chile - Market size and forecast 2025-2030 ($ million)
Data Table on Chile - Market size and forecast 2025-2030 ($ million)
Chart on Chile - Year-over-year growth 2025-2030 (%)
Data Table on Chile - Year-over-year growth 2025-2030 (%)

12.7 Middle East and Africa - Market size and forecast 2025-2030

Chart on Middle East and Africa - Market size and forecast 2025-2030 ($ million)
Data Table on Middle East and Africa - Market size and forecast 2025-2030 ($ million)
Chart on Middle East and Africa - Year-over-year growth 2025-2030 (%)
Data Table on Middle East and Africa - Year-over-year growth 2025-2030 (%)
Chart on Regional Comparison - Middle East and Africa
Data Table on Regional Comparison - Middle East and Africa

12.7.1 Saudi Arabia - Market size and forecast 2025-2030

Chart on Saudi Arabia - Market size and forecast 2025-2030 ($ million)
Data Table on Saudi Arabia - Market size and forecast 2025-2030 ($ million)
Chart on Saudi Arabia - Year-over-year growth 2025-2030 (%)
Data Table on Saudi Arabia - Year-over-year growth 2025-2030 (%)

12.7.2 UAE - Market size and forecast 2025-2030

Chart on UAE - Market size and forecast 2025-2030 ($ million)
Data Table on UAE - Market size and forecast 2025-2030 ($ million)
Chart on UAE - Year-over-year growth 2025-2030 (%)
Data Table on UAE - Year-over-year growth 2025-2030 (%)

12.7.3 South Africa - Market size and forecast 2025-2030

Chart on South Africa - Market size and forecast 2025-2030 ($ million)
Data Table on South Africa - Market size and forecast 2025-2030 ($ million)
Chart on South Africa - Year-over-year growth 2025-2030 (%)
Data Table on South Africa - Year-over-year growth 2025-2030 (%)

12.7.4 Turkey - Market size and forecast 2025-2030

Chart on Turkey - Market size and forecast 2025-2030 ($ million)
Data Table on Turkey - Market size and forecast 2025-2030 ($ million)
Chart on Turkey - Year-over-year growth 2025-2030 (%)
Data Table on Turkey - Year-over-year growth 2025-2030 (%)

12.7.5 Egypt - Market size and forecast 2025-2030

Chart on Egypt - Market size and forecast 2025-2030 ($ million)
Data Table on Egypt - Market size and forecast 2025-2030 ($ million)
Chart on Egypt - Year-over-year growth 2025-2030 (%)
Data Table on Egypt - Year-over-year growth 2025-2030 (%)

12.8 Market opportunity by geography

Market opportunity by geography ($ million)
Data Tables on Market opportunity by geography ($ million)

13. Drivers, Challenges, and Opportunity

13.1 Market drivers

Widespread adoption of industry 4.0 and automation
Surging demand from key high-growth industries
Drive toward increasing component complexity and lightweighting

13.2 Market challenges

Intensifying shortage of skilled labor
Persistent supply chain disruptions and material cost volatility
High cost and complexity of technological integration

13.3 Impact of drivers and challenges

Impact of drivers and challenges in 2025 and 2030

13.4 Market opportunities

Integration of AI and digital twinning
Ascendancy of multi-axis and high-precision machining
Strategic consolidation for enhanced automation capabilities

14. Competitive Landscape

14.1 Overview

14.2

Overview on criticality of inputs and factors of differentiation

14.3 Landscape disruption

Overview on factors of disruption

14.4 Industry risks

Impact of key risks on business

15. Competitive Analysis

15.1 Companies profiled

Companies covered

15.2 Company ranking index

15.3 Market positioning of companies

Matrix on companies position and classification

15.4 Amada Co. Ltd.

Amada Co. Ltd. - Overview
Amada Co. Ltd. - Business segments
Amada Co. Ltd. - Key offerings
Amada Co. Ltd. - Segment focus
SWOT

15.5 Chiron Group SE

Chiron Group SE - Overview
Chiron Group SE - Product / Service
Chiron Group SE - Key offerings
SWOT

15.6 DMG MORI CO. LTD.

DMG MORI CO. LTD. - Overview
DMG MORI CO. LTD. - Product / Service
DMG MORI CO. LTD. - Key offerings
SWOT

15.7 DN Solutions Co. Ltd.

DN Solutions Co. Ltd. - Overview
DN Solutions Co. Ltd. - Product / Service
DN Solutions Co. Ltd. - Key offerings
SWOT

15.8 Georg Fischer Ltd.

Georg Fischer Ltd. - Overview
Georg Fischer Ltd. - Business segments
Georg Fischer Ltd. - Key offerings
Georg Fischer Ltd. - Segment focus
SWOT

15.9 Gleason Corp.

Gleason Corp. - Overview
Gleason Corp. - Product / Service
Gleason Corp. - Key offerings
SWOT

15.10 GROB WERKE GmbH and Co. KG

GROB WERKE GmbH and Co. KG - Overview
GROB WERKE GmbH and Co. KG - Product / Service
GROB WERKE GmbH and Co. KG - Key offerings
SWOT

15.11 Haas Automation Inc.

Haas Automation Inc. - Overview
Haas Automation Inc. - Product / Service
Haas Automation Inc. - Key offerings
SWOT

15.12 Hyundai Wia Corp.

Hyundai Wia Corp. - Overview
Hyundai Wia Corp. - Business segments
Hyundai Wia Corp. - Key offerings
Hyundai Wia Corp. - Segment focus
SWOT

15.13 Jabil Inc.

Jabil Inc. - Overview
Jabil Inc. - Business segments
Jabil Inc. - Key offerings
Jabil Inc. - Segment focus
SWOT

15.14 JTEKT Machinery Americas Corp.

JTEKT Machinery Americas Corp. - Overview
JTEKT Machinery Americas Corp. - Product / Service
JTEKT Machinery Americas Corp. - Key offerings
SWOT

15.15 Komatsu Ltd.

Komatsu Ltd. - Overview
Komatsu Ltd. - Business segments
Komatsu Ltd. - Key offerings
Komatsu Ltd. - Segment focus
SWOT

15.16 Makino Inc.

Makino Inc. - Overview
Makino Inc. - Business segments
Makino Inc. - Key offerings
Makino Inc. - Segment focus
SWOT

15.17 Okuma Corp.

Okuma Corp. - Overview
Okuma Corp. - Product / Service
Okuma Corp. - Key offerings
SWOT

15.18 Yamazaki Mazak Corp.

Yamazaki Mazak Corp. - Overview
Yamazaki Mazak Corp. - Product / Service
Yamazaki Mazak Corp. - Key offerings
SWOT

16. Appendix

16.1 Scope of the report

Market definition
Objectives
Notes and caveats

16.2 Inclusions and exclusions checklist

Inclusions checklist
Exclusions checklist

16.3 Currency conversion rates for US$

16.4 Research methodology

16.5 Data procurement

Information sources

16.6 Data validation

16.7 Validation techniques employed for market sizing

16.8 Data synthesis

16.9 360 degree market analysis

16.10 List of abbreviations

Research Methodology

Technavio presents a detailed picture of the market by way of study, synthesis, and summation of data from multiple sources. The analysts have presented the various facets of the market with a particular focus on identifying the key industry influencers. The data thus presented is comprehensive, reliable, and the result of extensive research, both primary and secondary.

INFORMATION SOURCES

Primary sources

  • Manufacturers and suppliers
  • Channel partners
  • Industry experts
  • Strategic decision makers

Secondary sources

  • Industry journals and periodicals
  • Government data
  • Financial reports of key industry players
  • Historical data
  • Press releases

DATA ANALYSIS

Data Synthesis

  • Collation of data
  • Estimation of key figures
  • Analysis of derived insights

Data Validation

  • Triangulation with data models
  • Reference against proprietary databases
  • Corroboration with industry experts

REPORT WRITING

Qualitative

  • Market drivers
  • Market challenges
  • Market trends
  • Five forces analysis

Quantitative

  • Market size and forecast
  • Market segmentation
  • Geographical insights
  • Competitive landscape

Interested in this report?

Get your sample now to see our research methodology and insights!

Download Now

Frequently Asked Questions

Machining Services market growth will increase by USD 19750.0 million during 2026-2030.

The Machining Services market is expected to grow at a CAGR of 4.7% during 2026-2030.

Machining Services market is segmented by Service (Automotive, General machinery, Precision engineering, Others) End-user (Original equipment manufacturers, Small and medium enterprises, Contract manufacturers) Material (Metals, Plastics, Composites, Ceramics)

Amada Co. Ltd., Chiron Group SE, DMG MORI CO. LTD., DN Solutions Co. Ltd., FANUC Corp., Georg Fischer Ltd., Gleason Corp., GROB WERKE GmbH and Co. KG, Haas Automation Inc., Hyundai Wia Corp., IPG Photonics Corp., Jabil Inc., JTEKT Machinery Americas Corp., Komatsu Ltd., Makino Inc., Messer Cutting Systems Inc., Okuma Corp., Proto Labs Inc., Sandvik AB, TRUMPF SE Co. KG, Yamazaki Mazak Corp. are a few of the key vendors in the Machining Services market.

APAC will register the highest growth rate of 51.4% among the other regions. Therefore, the Machining Services market in APAC is expected to garner significant business opportunities for the vendors during the forecast period.

China, Japan, India, South Korea, Taiwan, Singapore, Germany, Italy, UK, France, Switzerland, Spain, US, Mexico, Canada, Brazil, Argentina, Chile, Saudi Arabia, UAE, South Africa, Turkey, Egypt

  • Widespread adoption of industry 4.0 and automation is the driving factor this market.

The Machining Services market vendors should focus on grabbing business opportunities from the Service segment as it accounted for the largest market share in the base year.
RIA - Research AI Assistant
Ask RIA
