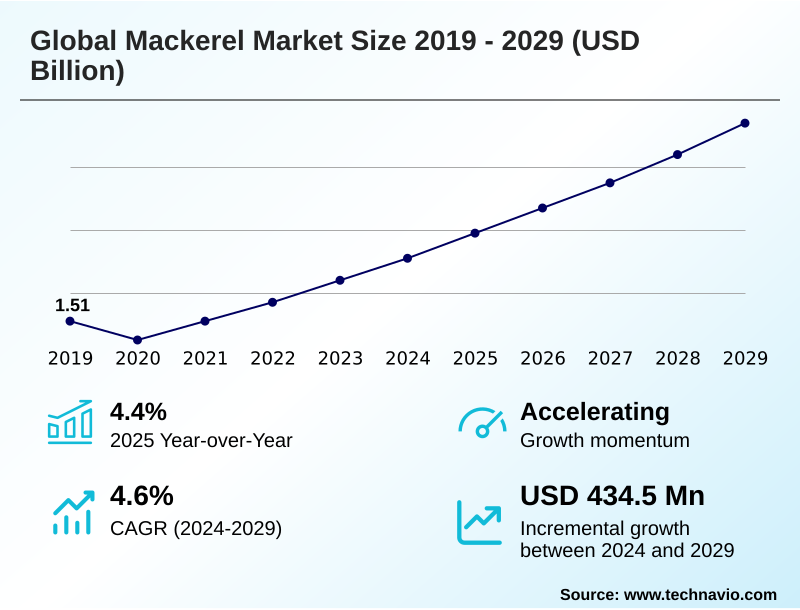
Mackerel Market Size 2025-2029
The mackerel market size is valued to increase by USD 434.5 million, at a CAGR of 4.6% from 2024 to 2029. Heightened consumer awareness of health benefits will drive the mackerel market.
Major Market Trends & Insights
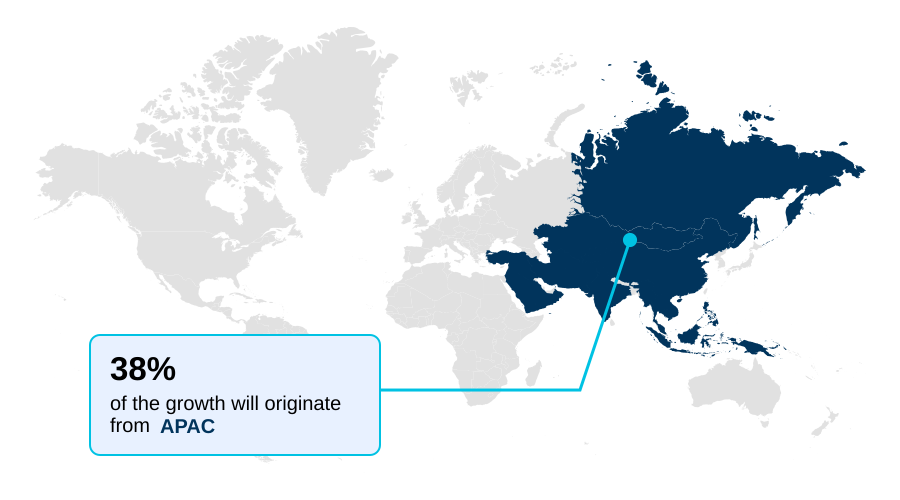
- APAC dominated the market and accounted for a 37.8% growth during the forecast period.
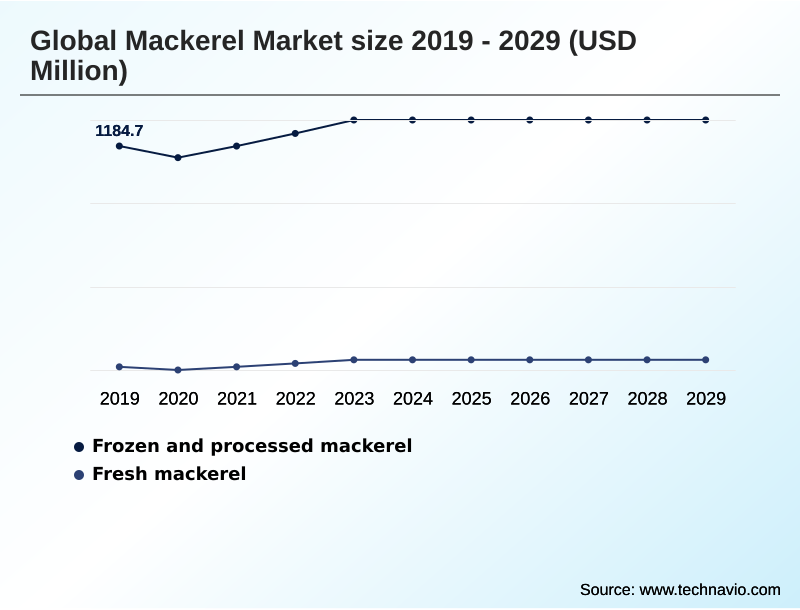
- By Product - Frozen and processed mackerel segment was valued at USD 1.29 billion in 2023
- By Distribution Channel - Offline segment accounted for the largest market revenue share in 2023
Market Size & Forecast
- Market Opportunities: USD 633.6 million
- Market Future Opportunities: USD 434.5 million
- CAGR from 2024 to 2029 : 4.6%
Market Summary
- The mackerel market is navigating a complex environment where ecological sustainability and technological innovation intersect. A core dynamic is the industry's response to fluctuating fish stock biomass, which requires sophisticated fisheries resource management and adherence to science-based guidance.
- Demand is increasingly shaped by consumer health awareness, particularly regarding the benefits of omega-3 fatty acids, driving sales of both fresh and processed products. For instance, a seafood processing company must now integrate advanced fish traceability systems not only for regulatory compliance but also as a marketing tool to assure seafood product traceability.
- By analyzing data from stock assessment models and real-time catch reports, the company can adjust its procurement strategies, mitigating supply chain disruptions from shifting pelagic species migration and ensuring a stable supply for producing value-added mackerel products. This proactive approach to supply chain management is crucial for maintaining profitability amid evolving international fisheries governance and tightening environmental standards.
What will be the Size of the Mackerel Market during the forecast period?
Get Key Insights on Market Forecast (PDF) Get Free Sample
How is the Mackerel Market Segmented?
The mackerel industry research report provides comprehensive data (region-wise segment analysis), with forecasts and estimates in "USD million" for the period 2025-2029, as well as historical data from 2019-2023 for the following segments.
- Product
- Frozen and processed mackerel
- Fresh mackerel
- Distribution channel
- Offline
- Online
- End-user
- Retail
- Foodservice
- Animal feed and pet food
- Others
- Geography
- APAC
- India
- China
- Japan
- Europe
- Germany
- UK
- France
- North America
- US
- Canada
- Mexico
- South America
- Brazil
- Argentina
- Middle East and Africa
- South Africa
- UAE
- Saudi Arabia
- Rest of World (ROW)
- APAC
By Product Insights
The frozen and processed mackerel segment is estimated to witness significant growth during the forecast period.
The frozen and processed mackerel segment is defined by significant food processing innovation, where advanced seafood processing technology preserves nutritional value and extends shelf life.
Techniques like high-pressure processing, modified atmosphere packaging, and vacuum skin packaging are integral to creating ready-to-eat seafood solutions, with some methods extending product stability by over 25%.
This segment includes a range of products from frozen mackerel fillets to items from smoked mackerel processing and large-scale canned mackerel production. The logistics of this market rely on robust frozen seafood logistics and stringent seafood safety standards.
The development of canned food preservation techniques and premium seafood product development are key focus areas for manufacturers aiming to meet consumer demand for convenience and quality.
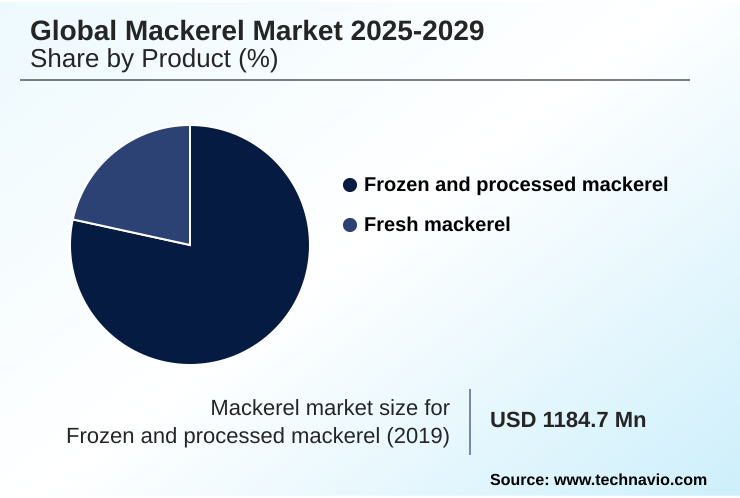
The Frozen and processed mackerel segment was valued at USD 1.29 billion in 2023 and showed a gradual increase during the forecast period.
Regional Analysis
APAC is estimated to contribute 37.8% to the growth of the global market during the forecast period.Technavio’s analysts have elaborately explained the regional trends and drivers that shape the market during the forecast period.
See How Mackerel Market Demand is Rising in APAC Get Free Sample
The geographic landscape of the mackerel market is defined by key production and consumption hubs, with regional performance heavily influenced by local fishery management plans and commercial fishing operations.
The APAC region is a dominant force, projected to expand at a rate of 5.4% and is responsible for approximately 37.8% of the market's incremental growth, driven by its large distant-water fishing fleet and processing capabilities.
In Europe, the industry relies on a technologically advanced pelagic freezer trawler fleet, but faces uncertainty due to the lack of a comprehensive sharing agreement, impacting Marine Stewardship Council (MSC) certification.
Effective cold chain logistics are critical for connecting these production zones with consumer markets.
Pelagic stock monitoring and detailed fisheries data analysis are becoming essential tools for ensuring fisheries regulatory compliance and mitigating the impacts of seafood market price volatility across all regions.
Market Dynamics
Our researchers analyzed the data with 2024 as the base year, along with the key drivers, trends, and challenges. A holistic analysis of drivers will help companies refine their marketing strategies to gain a competitive advantage.
- The global mackerel market is shaped by a complex interplay of ecological, economic, and consumer-driven forces. The impact of quota disputes on mackerel supply remains a primary concern, as sustainability challenges in northeast atlantic mackerel fisheries highlight the difficulties in managing straddling stocks. These issues directly affect the msc certification impact on market access for many operators.
- Concurrently, consumer trends driving processed mackerel demand are pushing innovations in value-added mackerel products and advances in high-pressure processing for seafood. The role of cold chain in fresh mackerel quality is critical, as is the growth of online retail for seafood products, which provides new avenues to market.
- Regional variations in mackerel consumption influence trade flows, while supply chain logistics for frozen mackerel exports must navigate the economic effects of climate change on fisheries. For businesses, managing volatile operating costs in fishing fleets is a constant operational hurdle.
- The comparison of fresh vs frozen mackerel markets shows distinct supply chain requirements, while the demand for omega-3 in the nutraceutical sector offers a high-value alternative market. As a result, companies must increasingly focus on the importance of eco-labeling for mackerel sales.
- Strategic planning is essential; a recent 22% reduction in the total allowable catch for a key fishery underscores the need for agile operational planning to navigate supply constraints.
What are the key market drivers leading to the rise in the adoption of Mackerel Industry?
- Increasing consumer awareness of the substantial health benefits associated with mackerel consumption is a primary driver for market growth.
- Market growth is fundamentally driven by heightened consumer demand for healthy, sustainable, and convenient protein sources.
- The nutritional profile of mackerel, particularly as a source of eicosapentaenoic acid (epa) and docosahexaenoic acid (dha), is a powerful driver, fueling nutraceutical applications of fish oil and direct consumption.
- The demand for sustainable sourcing policies is another major factor, with consumers paying premiums up to 26% for certified products, compelling operators to adopt practices like bycatch reduction technology and purse seine fishing under a sustainable fishery management framework.
- Furthermore, the versatility of small pelagic fish extends to industrial uses, where fishmeal and fish oil are critical for aquaculture feed formulation and as pet food protein sources.
- This diversified demand, spanning from retail to foodservice seafood demand, underpins the market's resilience.
What are the market trends shaping the Mackerel Industry?
- The recognition of mackerel's nutritional value is positioning it as a preferred superfood choice among health-conscious consumers, driving market trends.
- Key market trends are centered on sustainability, convenience, and health, creating a bifurcated demand landscape. On one hand, there is a significant push for wild-capture fishery sustainability, evidenced by a 26% consumer willingness to pay more for eco-labeled seafood. This drives investment in seafood product traceability and ethical sourcing verification, supported by robust fish traceability systems.
- On the other hand, retail channel diversification toward online platforms fuels demand for value-added mackerel products that cater to consumer health awareness. This includes products rich in omega-3 fatty acids, with a transparent fresh mackerel supply chain.
- To meet future demand, the industry is exploring innovations in recirculating aquaculture systems (RAS) and onshore aquaculture, aiming to supplement traditional capture methods and improve overall seafood supply chain transparency.
What challenges does the Mackerel Industry face during its growth?
- Overfishing, compounded by persistent international disputes over quota allocations, presents a significant challenge to the industry's sustainable growth.
- The primary challenges facing the market stem from environmental pressures and regulatory failures, creating significant operational risks. The persistent inability of nations to agree on quota sharing agreements has led to catches exceeding the scientifically advised total allowable catch (tac) by 35% in recent years, jeopardizing fish stock biomass.
- This is exacerbated by the climate change impact on fisheries, which causes pelagic species migration and complicates stock assessment models. Consequently, international bodies like the international council for the exploration of the sea (ices) have recommended drastic quota reductions, including a potential 70% cut for 2026 in one key fishery.
- This situation threatens fisheries regulatory compliance, creates extreme seafood market price volatility, and requires sophisticated supply chain disruption mitigation strategies, making effective international fisheries governance and fisheries resource management more critical than ever.
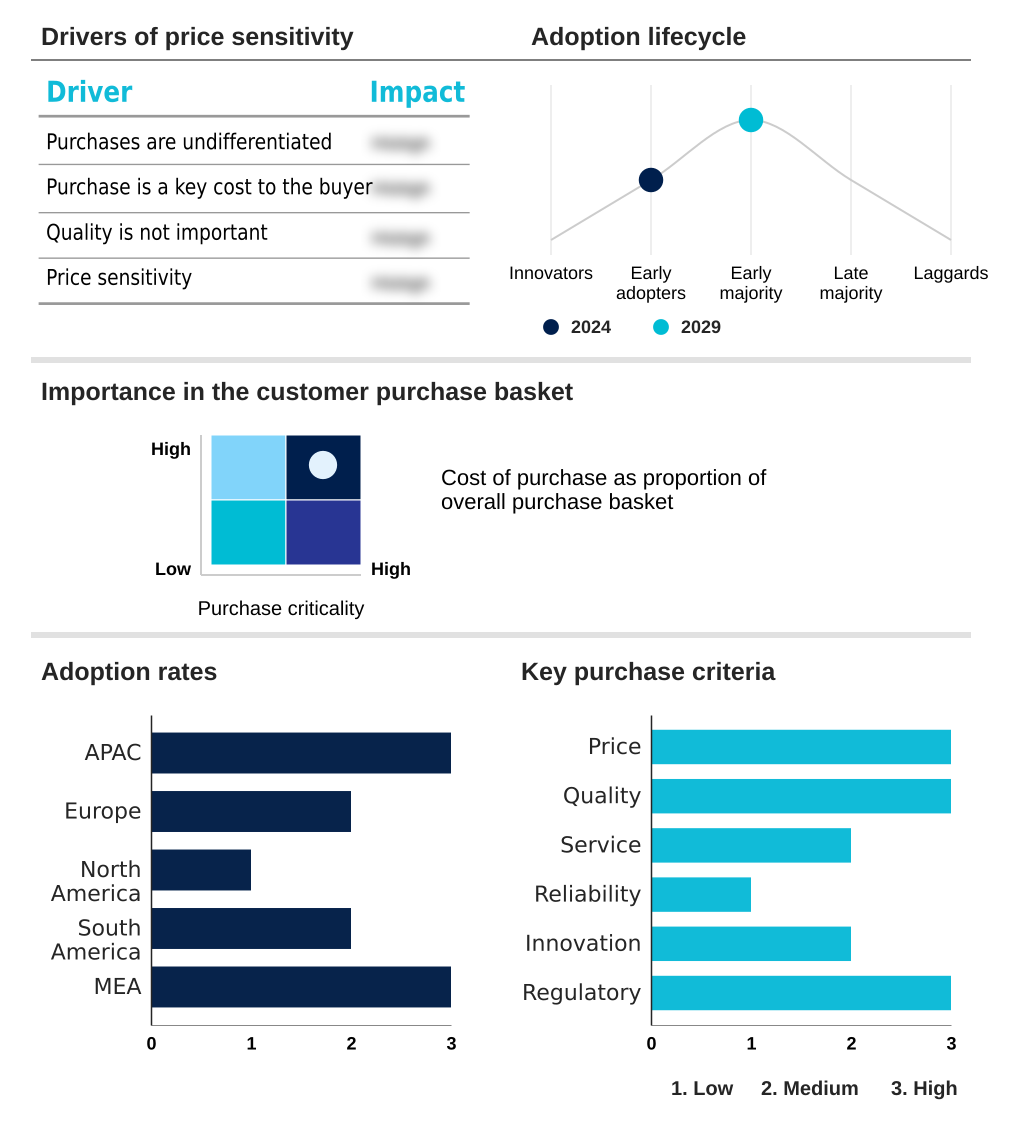
Exclusive Technavio Analysis on Customer Landscape
The mackerel market forecasting report includes the adoption lifecycle of the market, covering from the innovator’s stage to the laggard’s stage. It focuses on adoption rates in different regions based on penetration. Furthermore, the mackerel market report also includes key purchase criteria and drivers of price sensitivity to help companies evaluate and develop their market growth analysis strategies.
Customer Landscape of Mackerel Industry
Competitive Landscape
Companies are implementing various strategies, such as strategic alliances, mackerel market forecast, partnerships, mergers and acquisitions, geographical expansion, and product/service launches, to enhance their presence in the industry.
Bolton Group Srl - Offerings range from fresh and frozen whole fish to value-added processed products, including canned, smoked, and filleted formats, serving diverse consumer and industrial needs.
The industry research and growth report includes detailed analyses of the competitive landscape of the market and information about key companies, including:
- Bolton Group Srl
- Cornelis Vrolijk
- Etosha Fishing Corp.
- FCF Fishery Co. Ltd.
- Iceland Foods Ltd.
- Lotana LV
- Maruha Nichiro Corp.
- NOREBO Holding
- Ocean Treasure
- Oman Fisheries Co. S.A.O.G.
- Philam Trading Inc.
- Pinetree Vietnam Co. Ltd.
- Premier Fishing and Brands Ltd.
- Sea Harvest Corp. Pty Ltd.
- Thai Union Group PCL
Qualitative and quantitative analysis of companies has been conducted to help clients understand the wider business environment as well as the strengths and weaknesses of key industry players. Data is qualitatively analyzed to categorize companies as pure play, category-focused, industry-focused, and diversified; it is quantitatively analyzed to categorize companies as dominant, leading, strong, tentative, and weak.
Recent Development and News in Mackerel market
- In November 2024, the Marine Stewardship Council warned that climate change is complicating the management of migratory mackerel stocks, stressing that the fish do not adhere to political boundaries.
- In December 2024, an EU fish market report indicated that despite price-related declines in fresh seafood consumption at home, demand remains strong for convenient, value-added products like smoked and canned mackerel.
- In January 2025, Chilean fishery authorities reported a notable 26.9% year-over-year increase in mackerel landings for 2024, signaling a positive indicator for the nation's fishing industry.
- In March 2025, the European Union and Norway intensified sanctions that directly affected the fleet renewal plans of major operators, highlighting the impact of geopolitical factors on the industry.
Dive into Technavio’s robust research methodology, blending expert interviews, extensive data synthesis, and validated models for unparalleled Mackerel Market insights. See full methodology.
| Market Scope | |
|---|---|
| Page number | 286 |
| Base year | 2024 |
| Historic period | 2019-2023 |
| Forecast period | 2025-2029 |
| Growth momentum & CAGR | Accelerate at a CAGR of 4.6% |
| Market growth 2025-2029 | USD 434.5 million |
| Market structure | Fragmented |
| YoY growth 2024-2025(%) | 4.4% |
| Key countries | India, China, Japan, South Korea, Australia, Indonesia, Germany, UK, France, Italy, Spain, The Netherlands, US, Canada, Mexico, Brazil, Argentina, Chile, South Africa, UAE, Egypt, Saudi Arabia and Nigeria |
| Competitive landscape | Leading Companies, Market Positioning of Companies, Competitive Strategies, and Industry Risks |
Research Analyst Overview
- The mackerel market operates at the intersection of resource management and consumer demand, where the principles of sustainable fishery management are paramount. The industry's trajectory is heavily influenced by the effective implementation of stock assessment models and adherence to guidance from bodies like the international council for the exploration of the sea (ices).
- A key trend is the rising consumer preference for eco-labeled seafood, with research indicating a willingness to pay a premium of over 26% for products with verifiable sustainability credentials. This directly impacts boardroom strategy, compelling companies to invest in fish traceability systems and seek Marine Stewardship Council (MSC) certification to secure market access and brand reputation.
- Furthermore, the focus on health, specifically on omega-3 fatty acids like eicosapentaenoic acid (epa) and docosahexaenoic acid (dha), supports demand for both fresh and value-added mackerel products, including frozen mackerel fillets and items from canned mackerel production. Success hinges on balancing catch quota allocation with innovation in seafood processing technology.
What are the Key Data Covered in this Mackerel Market Research and Growth Report?
-
What is the expected growth of the Mackerel Market between 2025 and 2029?
-
USD 434.5 million, at a CAGR of 4.6%
-
-
What segmentation does the market report cover?
-
The report is segmented by Product (Frozen and processed mackerel, and Fresh mackerel), Distribution Channel (Offline, and Online), End-user (Retail, Food service, Animal feed and pet food, and Others) and Geography (APAC, Europe, North America, South America, Middle East and Africa)
-
-
Which regions are analyzed in the report?
-
APAC, Europe, North America, South America and Middle East and Africa
-
-
What are the key growth drivers and market challenges?
-
Heightened consumer awareness of health benefits, Overfishing and international quota disputes
-
-
Who are the major players in the Mackerel Market?
-
Bolton Group Srl, Cornelis Vrolijk, Etosha Fishing Corp., FCF Fishery Co. Ltd., Iceland Foods Ltd., Lotana LV, Maruha Nichiro Corp., NOREBO Holding, Ocean Treasure, Oman Fisheries Co. S.A.O.G., Philam Trading Inc., Pinetree Vietnam Co. Ltd., Premier Fishing and Brands Ltd., Sea Harvest Corp. Pty Ltd. and Thai Union Group PCL
-
Market Research Insights
- Market dynamics are increasingly governed by the tension between resource availability and consumer demand for ethical products. For example, studies show a positive consumer willingness to pay a premium of around 26% for eco-labeled seafood, directly influencing corporate sustainable sourcing policies.
- However, this is set against a backdrop of significant fisheries regulatory compliance challenges, where total catches have exceeded scientifically advised limits by as much as 35% in recent years due to unresolved international quota sharing agreements.
- This disparity forces companies to balance premium product development with the inherent risks of seafood market price volatility and potential supply chain disruption mitigation, making robust fisheries data analysis essential for strategic planning and maintaining marine ecosystem health.
We can help! Our analysts can customize this mackerel market research report to meet your requirements.
 RIA -
RIA - 
