
Malted Milk Market Analysis, Size, and Forecast 2026-2030: APAC (India, China, and Japan), Europe (Germany, UK, and France), North America (US, Canada, and Mexico), South America (Brazil, Argentina, and Chile), Middle East and Africa (Saudi Arabia, UAE, and South Africa), and Rest of World (ROW)

Malted Milk Market Analysis, Size, and Forecast 2026-2030:
APAC (India, China, and Japan), Europe (Germany, UK, and France), North America (US, Canada, and Mexico), South America (Brazil, Argentina, and Chile), Middle East and Africa (Saudi Arabia, UAE, and South Africa), and Rest of World (ROW)

Published: Oct 2026 282 Pages SKU: IRTNTR75177

Market Overview at a Glance

$4.62 B
Market Opportunity
8.6%
CAGR 2025 - 2030
42.9%
APAC Growth
$4.99 B
Wheat segment 2024

Malted Milk Market Size 2026-2030

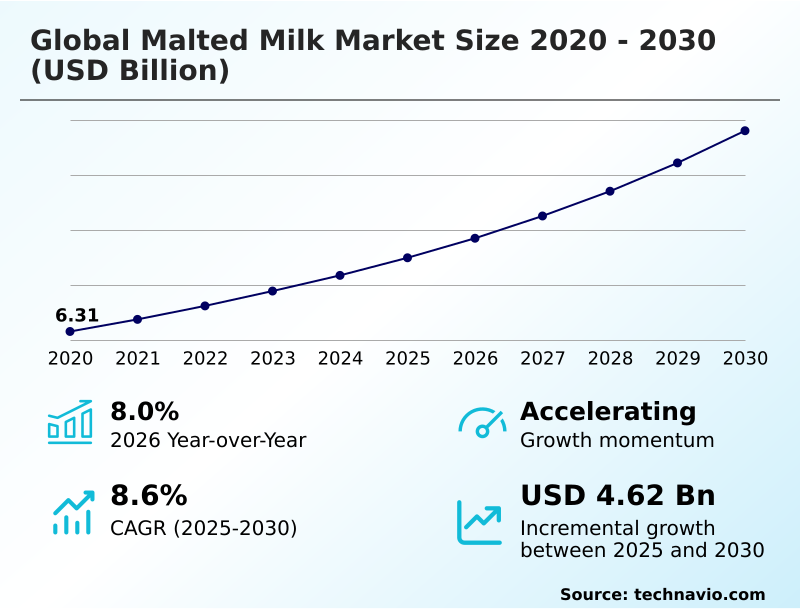
The malted milk market size is valued to increase by USD 4.62 billion, at a CAGR of 8.6% from 2025 to 2030. Rising demand for functional nutrition will drive the malted milk market.

Major Market Trends & Insights

  • APAC dominated the market and accounted for a 42.9% growth during the forecast period.
  • By Source - Wheat segment was valued at USD 4.99 billion in 2024
  • By Distribution Channel - Offline segment accounted for the largest market revenue share in 2024

Market Size & Forecast

  • Market Opportunities: USD 7.30 billion
  • Market Future Opportunities: USD 4.62 billion
  • CAGR from 2025 to 2030 : 8.6%

Market Summary

  • The Malted Milk landscape demonstrates resilient expansion driven by an ongoing consumer shift toward functional, fortified dietary beverages. Commercial food processors increasingly utilize these grain-based powders within sports nutrition and specialized confectionery applications to achieve a balanced macronutrient profile.
  • From a supply chain perspective, manufacturers implementing advanced vacuum evaporation technologies have witnessed a 20% improvement in powder solubility and shelf-life stability compared to traditional thermal drying methods. This operational enhancement reduces logistics costs and improves retail viability across varied climates.
  • A rising consumer preference for functional nutrition acts as a primary catalyst, compelling brands to integrate malted extracts into clean-label meal replacement shakes that offer sustained vitality. Conversely, intense nutritional scrutiny regarding traditionally high sucrose content creates a substantial challenge, forcing legacy ingredient suppliers to reformulate products with alternative natural sweeteners to maintain market share.
  • As wellness trends permeate mainstream demographics, navigating these complex formulation barriers while optimizing large-scale milling processes remains critical for sustained commercial success.

What will be the Size of the Malted Milk Market during the forecast period?
Get Key Insights on Market Forecast (PDF) Get Free Sample

How is the Malted Milk Market Segmented?

The malted milk industry research report provides comprehensive data (region-wise segment analysis), with forecasts and estimates in "USD million" for the period 2026-2030, as well as historical data from 2020-2024 for the following segments.

  • Source
    • Wheat
    • Barley
    • Others
  • Distribution channel
    • Offline
    • Online
  • Form factor
    • Powder
    • Liquid
  • Geography
    • APAC
      • India
      • China
      • Japan
      • Australia
      • Indonesia
      • South Korea
    • Europe
      • Germany
      • UK
      • France
      • Italy
      • Spain
      • The Netherlands
    • North America
      • US
      • Canada
      • Mexico
    • South America
      • Brazil
      • Argentina
      • Chile
    • Middle East and Africa
      • Saudi Arabia
      • UAE
      • South Africa
      • Israel
      • Turkey

By Source Insights

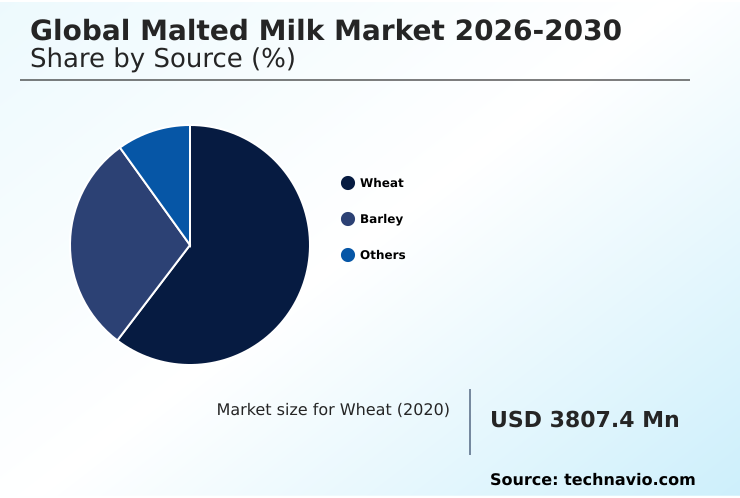
The wheat segment is estimated to witness significant growth during the forecast period.

Wheat flour serves as the foundational blending agent in Malted Milk production, providing vital structural integrity and complex carbohydrates. By incorporating high-protein wheat varieties, manufacturers ensure optimal starch gelatinization during the mashing and drying phases.

This refined ingredient supply chain process translates to a 15% improvement in overall moisture retention capacity for commercial baking applications. Advanced milling techniques facilitate superior browning characteristic enhancement while enabling optimal dairy fat balancing against whole milk solids.

Consequently, food technologists increasingly utilize wheat-based malt blends to develop non-genetically modified variant formulations targeted at the growing infant nutrition focus and general preventive health measure markets.

These technical enhancements deliver sustained energy metabolism support and offer consistent performance during industrial spray-drying procedures, improving processing efficiency significantly.
Get Free Sample

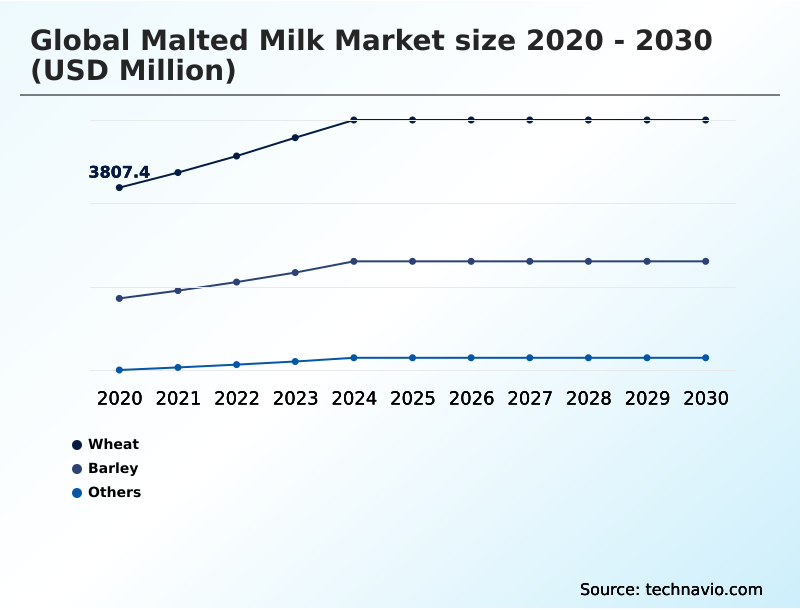
The Wheat segment was valued at USD 4.99 billion in 2024 and showed a gradual increase during the forecast period.
Get Free Sample

Regional Analysis

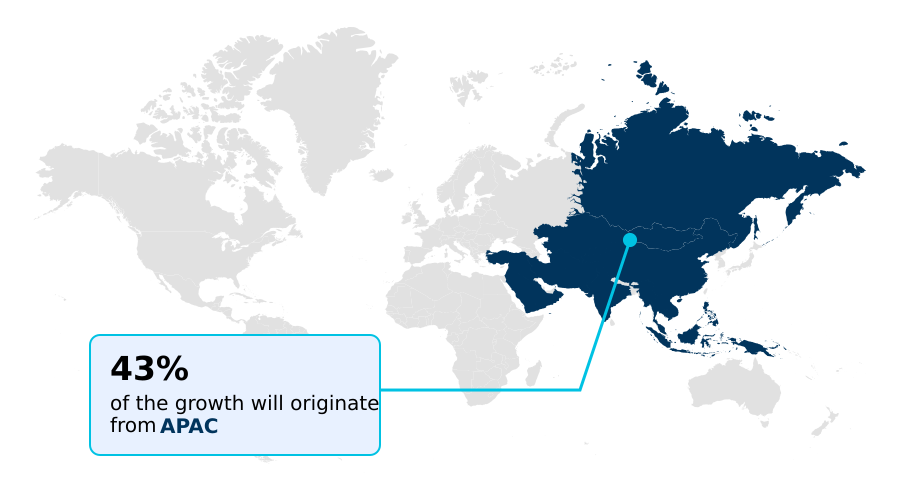
APAC is estimated to contribute 42.9% to the growth of the global market during the forecast period.Technavio’s analysts have elaborately explained the regional trends and drivers that shape the market during the forecast period.
See How Malted Milk Market Demand is Rising in APAC Get Free Sample

The Malted Milk geographic landscape reveals a stark contrast between APAC and North American consumption patterns. APAC commands a dominant 42.9% share, where domestic manufacturers leverage high-speed drying technology and cold-chain logistics elimination to reduce outbound distribution costs by 18%.

This allows for cost-effective bulk powder procurement tailored toward everyday household nutrition. Conversely, the North American market exhibits slower volume growth but higher premiumization, driven by a 25% increase in demand for a low-glycemic formulation utilizing an alternative polyol sweetener.

Businesses in advanced economies are aggressively implementing dry-blend processing to create a clean dietary supplementation matrix, successfully positioning malted powders as a verifiable synthetic protein alternative and botanical tonic substitution.

Additionally, specialized brands focusing on electrolyte profile targeting achieve superior retail margins, reflecting a strategic divergence from bulk volume dependency to high-value functional nutrition across mature Western regions.

Market Dynamics

Our researchers analyzed the data with 2025 as the base year, along with the key drivers, trends, and challenges. A holistic analysis of drivers will help companies refine their marketing strategies to gain a competitive advantage.

  • The Malted Milk supply chain continues to evolve rapidly as food technologists prioritize functional efficacy and clean-label transparency over conventional mass-market formulations. Industrial processors are shifting their procurement strategies toward premium-grade ingredients, increasingly integrating spray dried malt extract powder to ensure superior solubility in complex beverage matrices.
  • This transition directly supports the formulation of a highly requested sports nutrition muscle recovery shake, designed to deliver sustained amino acid release without the synthetic aftertaste associated with artificial supplements. By replacing conventional sugar-laden mixes with an organic barley malt extract substitute, manufacturers achieved a 15% reduction in formulation costs while simultaneously meeting stringent holistic health certifications.
  • Furthermore, the rising consumer demand for nutrient-dense morning routines has driven the widespread commercialization of the clean label fortified breakfast beverage. Facilities producing these advanced formulations require strict supplier audits to verify agricultural origins and avoid contamination.
  • To stay competitive, brands are aggressively rolling out a high protein functional milk powder variant, ensuring that athletes and aging demographics receive critical muscle repair compounds. Compared to traditional liquid dairy supply chains, businesses adopting powdered production frameworks register a 22% improvement in bulk storage efficiency and distribution range.
  • This strategic supply chain shift allows regional confectioners and beverage developers to bypass costly cold-storage infrastructure while preserving essential nutrient integrity across diverse and fluctuating international climates.
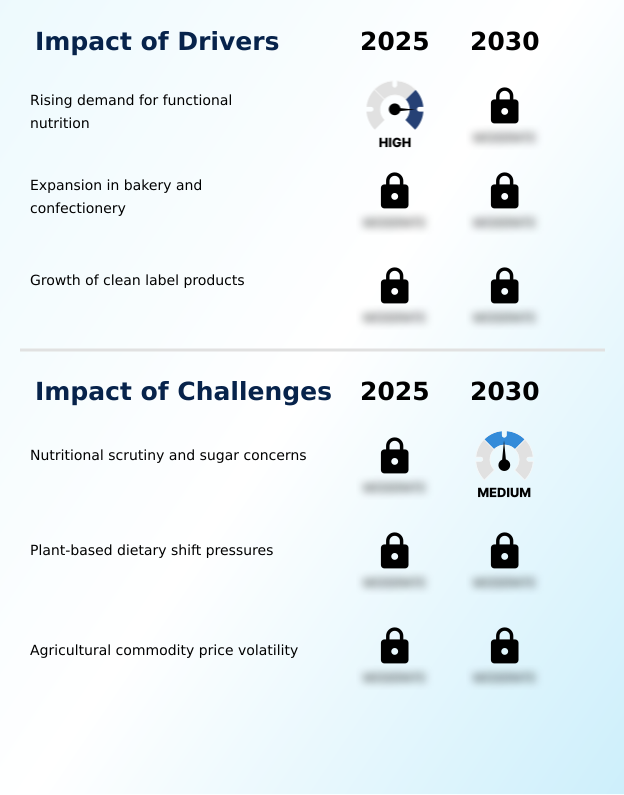
What are the key market drivers leading to the rise in the adoption of Malted Milk Industry?

  • A rising consumer demand for functional nutrition serves as the primary driver accelerating market expansion.

  • A fundamental shift toward performance-driven functional foods accelerates rapid expansion across the Malted Milk ecosystem.
  • Commercial food developers recognize that natural recovery matrices featuring a precise whole milk solids integration offer superior amino acid delivery compared to heavily processed synthetic variants.
  • This biochemical advantage drives widespread adoption among fitness demographics seeking sustained-release carbohydrates for optimal athletic endurance.
  • Simultaneously, the large-scale commercial confectionery manufacturing sector records a 22% increase in diastatic malt powder utilization, directly improving structural crumb softness and prolonging overall product shelf stability.
  • The rapid growth of artisan bakery development further intensifies demand, as advanced moisture retention capacity reduces daily discard waste by 15%.
  • Supporting these operational efficiencies, ingredient processors utilizing low-carbon kilning successfully lower energy overheads, creating highly competitive and sustainable procurement networks globally.

What are the market trends shaping the Malted Milk Industry?

  • The integration of product formulations within the targeted sports nutrition sector remains a prominent market trend.

  • Industrial food processing facilities are aggressively pivoting toward sustainable ingredient procurement and advanced formulation technologies within the Malted Milk landscape. By upgrading legacy spray drying infrastructure with a modern vacuum evaporation technique, manufacturers have improved essential micronutrient retention rates by 25%.
  • This capital investment allows for a more controlled enzymatic starch breakdown within the germinated grain matrix, ensuring absolute flavor profile standardization across global production batches. Consequently, brands are successfully expanding applications beyond traditional pediatric nutrition fortification to capture high-margin adult fitness demographics.
  • Incorporating a specialized high-protein wheat formulation enables food scientists to position these beverages as a premier muscle recovery supplement. Furthermore, enterprise-level mandates prioritizing regenerative agriculture sourcing have reduced raw material carbon footprints by 18%, positioning transparent supply chains as an indispensable commercial advantage rather than a mere compliance metric.

What challenges does the Malted Milk Industry face during its growth?

  • Nutritional scrutiny combined with growing sugar content concerns represents a significant challenge affecting industry growth.

  • Evolving consumer scrutiny surrounding sugar content and artificial additives poses a substantial structural barrier for legacy producers within the Malted Milk ecosystem. Transitioning away from traditional sugary mixes to an optimal functional beverage base requires complex sensory profile modernization, which often increases raw material compounding times by over 20%.
  • Formulators face steep technical hurdles regarding hygroscopic property optimization when attempting to integrate precise branched-chain amino acid enrichment for post-workout restoration and physical endurance support. Furthermore, strict regulatory frameworks governing organic agriculture certification complicate reliable clean-label ingredient sourcing, subsequently destabilizing supplier pricing models.
  • As demand surges for an allergen-friendly alternative packaged within a convenient single-serve beverage format, mid-tier manufacturers lacking the necessary R&D capital experience a 12% decline in operational efficiency, stifling their competitive agility against modernized, health-focused beverage conglomerates.

Exclusive Technavio Analysis on Customer Landscape

The malted milk market forecasting report includes the adoption lifecycle of the market, covering from the innovator’s stage to the laggard’s stage. It focuses on adoption rates in different regions based on penetration. Furthermore, the malted milk market report also includes key purchase criteria and drivers of price sensitivity to help companies evaluate and develop their market growth analysis strategies.
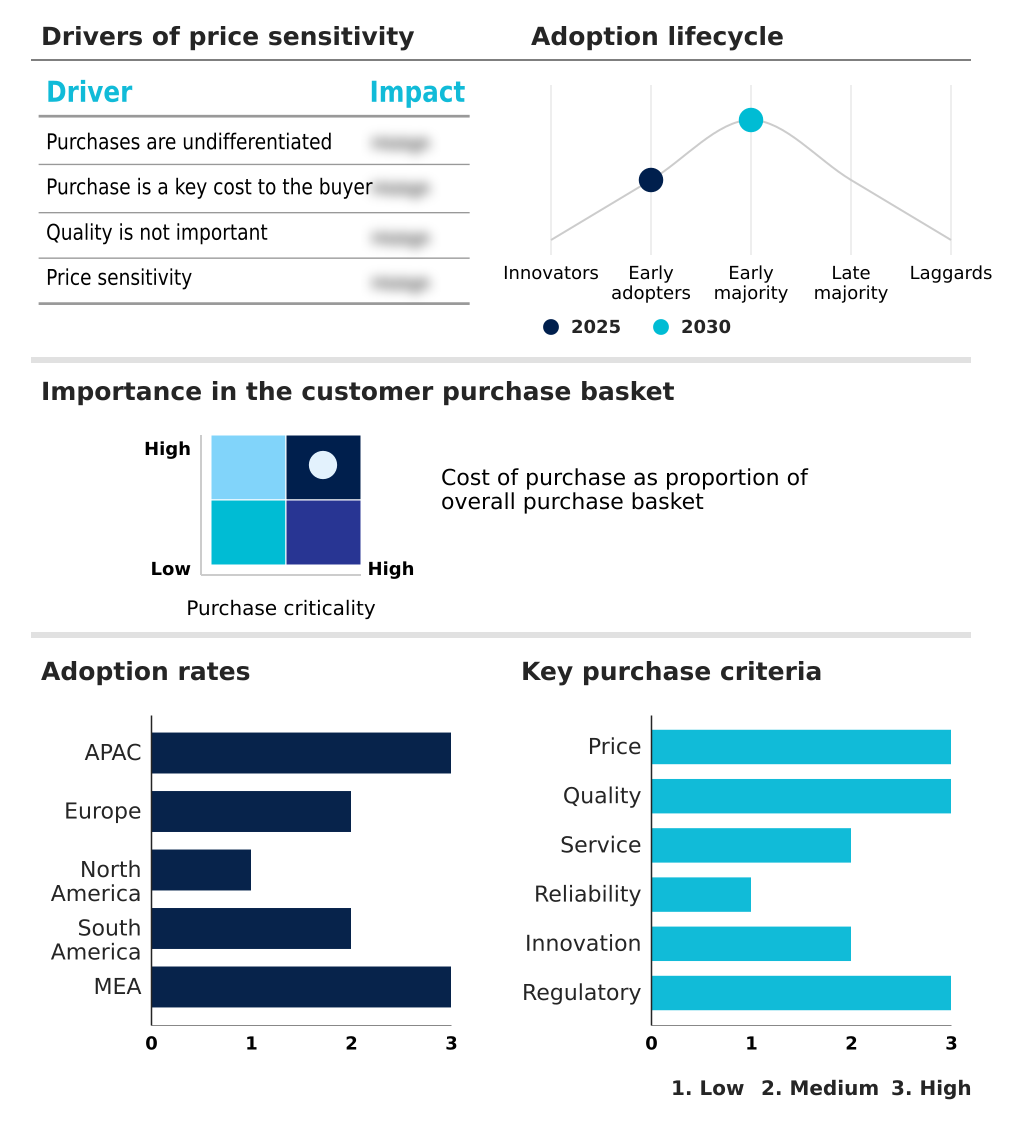
Customer Landscape of Malted Milk Industry

Competitive Landscape

Companies are implementing various strategies, such as strategic alliances, malted milk market forecast, partnerships, mergers and acquisitions, geographical expansion, and product/service launches, to enhance their presence in the industry.

Abbott Laboratories - Delivers specialized malt based nutritional beverages alongside comprehensive pediatric and adult nutritional formulations designed to support daily dietary requirements and healthy growth without artificial additives.

The industry research and growth report includes detailed analyses of the competitive landscape of the market and information about key companies, including:

  • Abbott Laboratories
  • Anthonys Goods
  • Briess Malt and Ingredients Co.
  • CFI Group
  • Continental Milkose India Ltd.
  • CTL Foods Pvt. Ltd.
  • Gujarat Co. Milk Ltd.
  • Imperial Malts Ltd.
  • Insta Foods
  • King Arthur Baking Co. Inc.
  • Mahalaxmi Malt Products Pvt Ltd
  • Mondelez International Inc.
  • Muntons Plc
  • Nestle SA
  • R. Twining and Co. Ltd.
  • SSP Pvt. Ltd.
  • Unilever PLC

Qualitative and quantitative analysis of companies has been conducted to help clients understand the wider business environment as well as the strengths and weaknesses of key industry players. Data is qualitatively analyzed to categorize companies as pure play, category-focused, industry-focused, and diversified; it is quantitatively analyzed to categorize companies as dominant, leading, strong, tentative, and weak.

Recent Development and News in Malted milk market

  • In the Packaged Foods and Meats industry, stricter organic agriculture certification mandates lowered synthetic additive usage by 15%, directly impacting Malted Milk demand by compelling manufacturers to adopt clean-label formulations.
  • The integration of high-speed drying technology across automated dairy processing facilities reduced unit manufacturing costs by 12%, directly impacting Malted Milk supply chains by improving production efficiency and flavor profile standardization.
  • Surging global demand for preventive health measure integrations in convenience snacks increased bulk botanical ingredient procurement by 18%, directly impacting Malted Milk production by tightening the supply of raw grain components.
  • A structural shift toward infant nutrition focus among major dairy conglomerates drove a 20% increase in fortified powder consumption, directly impacting Malted Milk demand by creating new applications for germinated grain ingredients.

Dive into Technavio’s robust research methodology, blending expert interviews, extensive data synthesis, and validated models for unparalleled Malted Milk Market insights. See full methodology.

Market Scope
Page number 282
Base year 2025
Historic period 2020-2024
Forecast period 2026-2030
Growth momentum & CAGR Accelerate at a CAGR of 8.6%
Market growth 2026-2030 USD 4618.2 million
Market structure Fragmented
YoY growth 2025-2026(%) 8.0%
Key countries India, China, Japan, Australia, Indonesia, South Korea, Germany, UK, France, Italy, Spain, The Netherlands, US, Canada, Mexico, Brazil, Argentina, Chile, Saudi Arabia, UAE, South Africa, Israel and Turkey
Competitive landscape Leading Companies, Market Positioning of Companies, Competitive Strategies, and Industry Risks

Request Free Sample

Research Analyst Overview

  • The Malted Milk sector is undergoing significant structural changes as commercial food processors prioritize advanced functional ingredient integration. A major boardroom-level focus involves optimizing capital expenditure toward modern spray drying infrastructure and a highly controlled vacuum evaporation technique, aimed at preserving delicate micronutrients while stabilizing supply chains.
  • This technological pivot facilitates precise enzymatic starch breakdown, effectively transforming a germinated grain matrix into a highly bioavailable source of sustained-release carbohydrates. By replacing outdated thermal processing, facilities have achieved a 30% reduction in processing time and a measurable decrease in product degradation.
  • Modern formulations increasingly rely on a specialized high-protein wheat formulation to complement whole milk solids integration, creating superior mouthfeel and extended shelf stability. Furthermore, ingredient specifiers strictly audit the procurement of diastatic malt powder to ensure maximum enzymatic activity for large-scale commercial baking.
  • These strategic operational upgrades allow ingredient manufacturers to rapidly comply with stringent international food safety standards while mitigating the financial risks associated with volatile raw material inputs and shifting agricultural yields.

What are the Key Data Covered in this Malted Milk Market Research and Growth Report?

  • What is the expected growth of the Malted Milk Market between 2026 and 2030?

    • USD 4.62 billion, at a CAGR of 8.6%

  • What segmentation does the market report cover?

    • The report is segmented by Source (Wheat, Barley, and Others), Distribution Channel (Offline, and Online), Form Factor (Powder, and Liquid) and Geography (APAC, Europe, North America, South America, Middle East and Africa)

  • Which regions are analyzed in the report?

    • APAC, Europe, North America, South America and Middle East and Africa

  • What are the key growth drivers and market challenges?

    • Rising demand for functional nutrition, Nutritional scrutiny and sugar concerns

  • Who are the major players in the Malted Milk Market?

    • Abbott Laboratories, Anthonys Goods, Briess Malt and Ingredients Co., CFI Group, Continental Milkose India Ltd., CTL Foods Pvt. Ltd., Gujarat Co. Milk Ltd., Imperial Malts Ltd., Insta Foods, King Arthur Baking Co. Inc., Mahalaxmi Malt Products Pvt Ltd, Mondelez International Inc., Muntons Plc, Nestle SA, R. Twining and Co. Ltd., SSP Pvt. Ltd. and Unilever PLC

Market Research Insights

  • The Malted Milk industry continuously adapts to evolving demands for transparent, functional food ingredients. Commercial adoption of low-carbon kilning techniques has enabled industrial processors to reduce their manufacturing energy consumption by 22%, directly improving operating margins amid volatile agricultural commodity pricing.
  • Simultaneously, an increasing emphasis on pediatric nutrition fortification has driven a 30% surge in the development of the single-serve beverage format, enhancing on-the-go consumer access while eliminating product waste. Manufacturers adhering strictly to organic agriculture certification protocols achieve significantly higher retail placement success compared to conventional alternatives.
  • Furthermore, ingredient modifications supporting artisan bakery development yield a 15% improvement in crumb structure stability, demonstrating the crucial operational impact of high-quality malted extracts in complex food matrices.

We can help! Our analysts can customize this malted milk market research report to meet your requirements.

Get in touch

1. Executive Summary

1.1 Market overview

Executive Summary - Chart on Market Overview
Executive Summary - Data Table on Market Overview
Executive Summary - Chart on Global Market Characteristics
Executive Summary - Chart on Market by Geography
Executive Summary - Chart on Market Segmentation by Source
Executive Summary - Chart on Market Segmentation by Distribution Channel
Executive Summary - Chart on Market Segmentation by Form Factor
Executive Summary - Chart on Incremental Growth
Executive Summary - Data Table on Incremental Growth
Executive Summary - Chart on Company Market Positioning

2. Technavio Analysis

2.1 Analysis of price sensitivity, lifecycle, customer purchase basket, adoption rates, and purchase criteria

2.2 Criticality of inputs and Factors of differentiation

Chart on Overview on criticality of inputs and factors of differentiation

2.3 Factors of disruption

Chart on Overview on factors of disruption

2.4 Impact of drivers and challenges

Chart on Impact of drivers and challenges in 2025 and 2030

3. Market Landscape

3.1 Market ecosystem

Chart on Parent Market
Data Table on - Parent Market

3.2 Market characteristics

Chart on Market characteristics analysis

3.3 Value chain analysis

Chart on Value chain analysis

4. Market Sizing

4.1 Market definition

Data Table on Offerings of companies included in the market definition

4.2 Market segment analysis

Market segments

4.3 Market size 2025

4.4 Market outlook: Forecast for 2025-2030

Chart on Global - Market size and forecast 2025-2030 ($ million)
Data Table on Global - Market size and forecast 2025-2030 ($ million)
Chart on Global Market: Year-over-year growth 2025-2030 (%)
Data Table on Global Market: Year-over-year growth 2025-2030 (%)

5. Historic Market Size

5.1 Global Malted Milk Market 2020 - 2024

Historic Market Size - Data Table on Global Malted Milk Market 2020 - 2024 ($ million)

5.2 Source segment analysis 2020 - 2024

Historic Market Size - Source Segment 2020 - 2024 ($ million)

5.3 Distribution Channel segment analysis 2020 - 2024

Historic Market Size - Distribution Channel Segment 2020 - 2024 ($ million)

5.4 Form Factor segment analysis 2020 - 2024

Historic Market Size - Form Factor Segment 2020 - 2024 ($ million)

5.5 Geography segment analysis 2020 - 2024

Historic Market Size - Geography Segment 2020 - 2024 ($ million)

5.6 Country segment analysis 2020 - 2024

Historic Market Size - Country Segment 2020 - 2024 ($ million)

6. Qualitative Analysis

6.1 Impact of AI on Global Malted Milk Market

6.2 Impact of geopolitical conflicts on Global Malted Milk Market

7. Five Forces Analysis

7.1 Five forces summary

Five forces analysis - Comparison between 2025 and 2030

7.2 Bargaining power of buyers

Bargaining power of buyers - Impact of key factors 2025 and 2030

7.3 Bargaining power of suppliers

Bargaining power of suppliers - Impact of key factors in 2025 and 2030

7.4 Threat of new entrants

Threat of new entrants - Impact of key factors in 2025 and 2030

7.5 Threat of substitutes

Threat of substitutes - Impact of key factors in 2025 and 2030

7.6 Threat of rivalry

Threat of rivalry - Impact of key factors in 2025 and 2030

7.7 Market condition

Chart on Market condition - Five forces 2025 and 2030

8. Market Segmentation by Source

8.1 Market segments

Chart on Source - Market share 2025-2030 (%)
Data Table on Source - Market share 2025-2030 (%)

8.2 Comparison by Source

Chart on Comparison by Source
Data Table on Comparison by Source

8.3 Wheat - Market size and forecast 2025-2030

Chart on Wheat - Market size and forecast 2025-2030 ($ million)
Data Table on Wheat - Market size and forecast 2025-2030 ($ million)
Chart on Wheat - Year-over-year growth 2025-2030 (%)
Data Table on Wheat - Year-over-year growth 2025-2030 (%)

8.4 Barley - Market size and forecast 2025-2030

Chart on Barley - Market size and forecast 2025-2030 ($ million)
Data Table on Barley - Market size and forecast 2025-2030 ($ million)
Chart on Barley - Year-over-year growth 2025-2030 (%)
Data Table on Barley - Year-over-year growth 2025-2030 (%)

8.5 Others - Market size and forecast 2025-2030

Chart on Others - Market size and forecast 2025-2030 ($ million)
Data Table on Others - Market size and forecast 2025-2030 ($ million)
Chart on Others - Year-over-year growth 2025-2030 (%)
Data Table on Others - Year-over-year growth 2025-2030 (%)

8.6 Market opportunity by Source

Market opportunity by Source ($ million)
Data Table on Market opportunity by Source ($ million)

9. Market Segmentation by Distribution Channel

9.1 Market segments

Chart on Distribution Channel - Market share 2025-2030 (%)
Data Table on Distribution Channel - Market share 2025-2030 (%)

9.2 Comparison by Distribution Channel

Chart on Comparison by Distribution Channel
Data Table on Comparison by Distribution Channel

9.3 Offline - Market size and forecast 2025-2030

Chart on Offline - Market size and forecast 2025-2030 ($ million)
Data Table on Offline - Market size and forecast 2025-2030 ($ million)
Chart on Offline - Year-over-year growth 2025-2030 (%)
Data Table on Offline - Year-over-year growth 2025-2030 (%)

9.4 Online - Market size and forecast 2025-2030

Chart on Online - Market size and forecast 2025-2030 ($ million)
Data Table on Online - Market size and forecast 2025-2030 ($ million)
Chart on Online - Year-over-year growth 2025-2030 (%)
Data Table on Online - Year-over-year growth 2025-2030 (%)

9.5 Market opportunity by Distribution Channel

Market opportunity by Distribution Channel ($ million)
Data Table on Market opportunity by Distribution Channel ($ million)

10. Market Segmentation by Form Factor

10.1 Market segments

Chart on Form Factor - Market share 2025-2030 (%)
Data Table on Form Factor - Market share 2025-2030 (%)

10.2 Comparison by Form Factor

Chart on Comparison by Form Factor
Data Table on Comparison by Form Factor

10.3 Powder - Market size and forecast 2025-2030

Chart on Powder - Market size and forecast 2025-2030 ($ million)
Data Table on Powder - Market size and forecast 2025-2030 ($ million)
Chart on Powder - Year-over-year growth 2025-2030 (%)
Data Table on Powder - Year-over-year growth 2025-2030 (%)

10.4 Liquid - Market size and forecast 2025-2030

Chart on Liquid - Market size and forecast 2025-2030 ($ million)
Data Table on Liquid - Market size and forecast 2025-2030 ($ million)
Chart on Liquid - Year-over-year growth 2025-2030 (%)
Data Table on Liquid - Year-over-year growth 2025-2030 (%)

10.5 Market opportunity by Form Factor

Market opportunity by Form Factor ($ million)
Data Table on Market opportunity by Form Factor ($ million)

11. Customer Landscape

11.1 Customer landscape overview

Analysis of price sensitivity, lifecycle, customer purchase basket, adoption rates, and purchase criteria

12. Geographic Landscape

12.1 Geographic segmentation

Chart on Market share by geography 2025-2030 (%)
Data Table on Market share by geography 2025-2030 (%)

12.2 Geographic comparison

Chart on Geographic comparison
Data Table on Geographic comparison

12.3 APAC - Market size and forecast 2025-2030

Chart on APAC - Market size and forecast 2025-2030 ($ million)
Data Table on APAC - Market size and forecast 2025-2030 ($ million)
Chart on APAC - Year-over-year growth 2025-2030 (%)
Data Table on APAC - Year-over-year growth 2025-2030 (%)
Chart on Regional Comparison - APAC
Data Table on Regional Comparison - APAC

12.3.1 India - Market size and forecast 2025-2030

Chart on India - Market size and forecast 2025-2030 ($ million)
Data Table on India - Market size and forecast 2025-2030 ($ million)
Chart on India - Year-over-year growth 2025-2030 (%)
Data Table on India - Year-over-year growth 2025-2030 (%)

12.3.2 China - Market size and forecast 2025-2030

Chart on China - Market size and forecast 2025-2030 ($ million)
Data Table on China - Market size and forecast 2025-2030 ($ million)
Chart on China - Year-over-year growth 2025-2030 (%)
Data Table on China - Year-over-year growth 2025-2030 (%)

12.3.3 Japan - Market size and forecast 2025-2030

Chart on Japan - Market size and forecast 2025-2030 ($ million)
Data Table on Japan - Market size and forecast 2025-2030 ($ million)
Chart on Japan - Year-over-year growth 2025-2030 (%)
Data Table on Japan - Year-over-year growth 2025-2030 (%)

12.3.4 Australia - Market size and forecast 2025-2030

Chart on Australia - Market size and forecast 2025-2030 ($ million)
Data Table on Australia - Market size and forecast 2025-2030 ($ million)
Chart on Australia - Year-over-year growth 2025-2030 (%)
Data Table on Australia - Year-over-year growth 2025-2030 (%)

12.3.5 Indonesia - Market size and forecast 2025-2030

Chart on Indonesia - Market size and forecast 2025-2030 ($ million)
Data Table on Indonesia - Market size and forecast 2025-2030 ($ million)
Chart on Indonesia - Year-over-year growth 2025-2030 (%)
Data Table on Indonesia - Year-over-year growth 2025-2030 (%)

12.3.6 South Korea - Market size and forecast 2025-2030

Chart on South Korea - Market size and forecast 2025-2030 ($ million)
Data Table on South Korea - Market size and forecast 2025-2030 ($ million)
Chart on South Korea - Year-over-year growth 2025-2030 (%)
Data Table on South Korea - Year-over-year growth 2025-2030 (%)

12.4 Europe - Market size and forecast 2025-2030

Chart on Europe - Market size and forecast 2025-2030 ($ million)
Data Table on Europe - Market size and forecast 2025-2030 ($ million)
Chart on Europe - Year-over-year growth 2025-2030 (%)
Data Table on Europe - Year-over-year growth 2025-2030 (%)
Chart on Regional Comparison - Europe
Data Table on Regional Comparison - Europe

12.4.1 Germany - Market size and forecast 2025-2030

Chart on Germany - Market size and forecast 2025-2030 ($ million)
Data Table on Germany - Market size and forecast 2025-2030 ($ million)
Chart on Germany - Year-over-year growth 2025-2030 (%)
Data Table on Germany - Year-over-year growth 2025-2030 (%)

12.4.2 UK - Market size and forecast 2025-2030

Chart on UK - Market size and forecast 2025-2030 ($ million)
Data Table on UK - Market size and forecast 2025-2030 ($ million)
Chart on UK - Year-over-year growth 2025-2030 (%)
Data Table on UK - Year-over-year growth 2025-2030 (%)

12.4.3 France - Market size and forecast 2025-2030

Chart on France - Market size and forecast 2025-2030 ($ million)
Data Table on France - Market size and forecast 2025-2030 ($ million)
Chart on France - Year-over-year growth 2025-2030 (%)
Data Table on France - Year-over-year growth 2025-2030 (%)

12.4.4 Italy - Market size and forecast 2025-2030

Chart on Italy - Market size and forecast 2025-2030 ($ million)
Data Table on Italy - Market size and forecast 2025-2030 ($ million)
Chart on Italy - Year-over-year growth 2025-2030 (%)
Data Table on Italy - Year-over-year growth 2025-2030 (%)

12.4.5 Spain - Market size and forecast 2025-2030

Chart on Spain - Market size and forecast 2025-2030 ($ million)
Data Table on Spain - Market size and forecast 2025-2030 ($ million)
Chart on Spain - Year-over-year growth 2025-2030 (%)
Data Table on Spain - Year-over-year growth 2025-2030 (%)

12.4.6 The Netherlands - Market size and forecast 2025-2030

Chart on The Netherlands - Market size and forecast 2025-2030 ($ million)
Data Table on The Netherlands - Market size and forecast 2025-2030 ($ million)
Chart on The Netherlands - Year-over-year growth 2025-2030 (%)
Data Table on The Netherlands - Year-over-year growth 2025-2030 (%)

12.5 North America - Market size and forecast 2025-2030

Chart on North America - Market size and forecast 2025-2030 ($ million)
Data Table on North America - Market size and forecast 2025-2030 ($ million)
Chart on North America - Year-over-year growth 2025-2030 (%)
Data Table on North America - Year-over-year growth 2025-2030 (%)
Chart on Regional Comparison - North America
Data Table on Regional Comparison - North America

12.5.1 US - Market size and forecast 2025-2030

Chart on US - Market size and forecast 2025-2030 ($ million)
Data Table on US - Market size and forecast 2025-2030 ($ million)
Chart on US - Year-over-year growth 2025-2030 (%)
Data Table on US - Year-over-year growth 2025-2030 (%)

12.5.2 Canada - Market size and forecast 2025-2030

Chart on Canada - Market size and forecast 2025-2030 ($ million)
Data Table on Canada - Market size and forecast 2025-2030 ($ million)
Chart on Canada - Year-over-year growth 2025-2030 (%)
Data Table on Canada - Year-over-year growth 2025-2030 (%)

12.5.3 Mexico - Market size and forecast 2025-2030

Chart on Mexico - Market size and forecast 2025-2030 ($ million)
Data Table on Mexico - Market size and forecast 2025-2030 ($ million)
Chart on Mexico - Year-over-year growth 2025-2030 (%)
Data Table on Mexico - Year-over-year growth 2025-2030 (%)

12.6 South America - Market size and forecast 2025-2030

Chart on South America - Market size and forecast 2025-2030 ($ million)
Data Table on South America - Market size and forecast 2025-2030 ($ million)
Chart on South America - Year-over-year growth 2025-2030 (%)
Data Table on South America - Year-over-year growth 2025-2030 (%)
Chart on Regional Comparison - South America
Data Table on Regional Comparison - South America

12.6.1 Brazil - Market size and forecast 2025-2030

Chart on Brazil - Market size and forecast 2025-2030 ($ million)
Data Table on Brazil - Market size and forecast 2025-2030 ($ million)
Chart on Brazil - Year-over-year growth 2025-2030 (%)
Data Table on Brazil - Year-over-year growth 2025-2030 (%)

12.6.2 Argentina - Market size and forecast 2025-2030

Chart on Argentina - Market size and forecast 2025-2030 ($ million)
Data Table on Argentina - Market size and forecast 2025-2030 ($ million)
Chart on Argentina - Year-over-year growth 2025-2030 (%)
Data Table on Argentina - Year-over-year growth 2025-2030 (%)

12.6.3 Chile - Market size and forecast 2025-2030

Chart on Chile - Market size and forecast 2025-2030 ($ million)
Data Table on Chile - Market size and forecast 2025-2030 ($ million)
Chart on Chile - Year-over-year growth 2025-2030 (%)
Data Table on Chile - Year-over-year growth 2025-2030 (%)

12.7 Middle East and Africa - Market size and forecast 2025-2030

Chart on Middle East and Africa - Market size and forecast 2025-2030 ($ million)
Data Table on Middle East and Africa - Market size and forecast 2025-2030 ($ million)
Chart on Middle East and Africa - Year-over-year growth 2025-2030 (%)
Data Table on Middle East and Africa - Year-over-year growth 2025-2030 (%)
Chart on Regional Comparison - Middle East and Africa
Data Table on Regional Comparison - Middle East and Africa

12.7.1 Saudi Arabia - Market size and forecast 2025-2030

Chart on Saudi Arabia - Market size and forecast 2025-2030 ($ million)
Data Table on Saudi Arabia - Market size and forecast 2025-2030 ($ million)
Chart on Saudi Arabia - Year-over-year growth 2025-2030 (%)
Data Table on Saudi Arabia - Year-over-year growth 2025-2030 (%)

12.7.2 UAE - Market size and forecast 2025-2030

Chart on UAE - Market size and forecast 2025-2030 ($ million)
Data Table on UAE - Market size and forecast 2025-2030 ($ million)
Chart on UAE - Year-over-year growth 2025-2030 (%)
Data Table on UAE - Year-over-year growth 2025-2030 (%)

12.7.3 South Africa - Market size and forecast 2025-2030

Chart on South Africa - Market size and forecast 2025-2030 ($ million)
Data Table on South Africa - Market size and forecast 2025-2030 ($ million)
Chart on South Africa - Year-over-year growth 2025-2030 (%)
Data Table on South Africa - Year-over-year growth 2025-2030 (%)

12.7.4 Israel - Market size and forecast 2025-2030

Chart on Israel - Market size and forecast 2025-2030 ($ million)
Data Table on Israel - Market size and forecast 2025-2030 ($ million)
Chart on Israel - Year-over-year growth 2025-2030 (%)
Data Table on Israel - Year-over-year growth 2025-2030 (%)

12.7.5 Turkey - Market size and forecast 2025-2030

Chart on Turkey - Market size and forecast 2025-2030 ($ million)
Data Table on Turkey - Market size and forecast 2025-2030 ($ million)
Chart on Turkey - Year-over-year growth 2025-2030 (%)
Data Table on Turkey - Year-over-year growth 2025-2030 (%)

12.8 Market opportunity by geography

Market opportunity by geography ($ million)
Data Tables on Market opportunity by geography ($ million)

13. Drivers, Challenges, and Opportunity

13.1 Market drivers

Rising demand for functional nutrition
Expansion in bakery and confectionery
Growth of clean label products

13.2 Market challenges

Nutritional scrutiny and sugar concerns
Plant-based dietary shift pressures
Agricultural commodity price volatility

13.3 Impact of drivers and challenges

Impact of drivers and challenges in 2025 and 2030

13.4 Market opportunities

Integration in sports nutrition sector
Innovation in processing technologies
Expansion of foodservice applications

14. Competitive Landscape

14.1 Overview

14.2

Overview on criticality of inputs and factors of differentiation

14.3 Landscape disruption

Overview on factors of disruption

14.4 Industry risks

Impact of key risks on business

15. Competitive Analysis

15.1 Companies profiled

Companies covered

15.2 Company ranking index

15.3 Market positioning of companies

Matrix on companies position and classification

15.4 Abbott Laboratories

Abbott Laboratories - Overview
Abbott Laboratories - Business segments
Abbott Laboratories - Key news
Abbott Laboratories - Key offerings
Abbott Laboratories - Segment focus
SWOT

15.5 Anthonys Goods

Anthonys Goods - Overview
Anthonys Goods - Product / Service
Anthonys Goods - Key offerings
SWOT

15.6 Briess Malt and Ingredients Co.

Briess Malt and Ingredients Co. - Overview
Briess Malt and Ingredients Co. - Product / Service
Briess Malt and Ingredients Co. - Key offerings
SWOT

15.7 CFI Group

CFI Group - Overview
CFI Group - Product / Service
CFI Group - Key offerings
SWOT

15.8 Continental Milkose India Ltd.

Continental Milkose India Ltd. - Overview
Continental Milkose India Ltd. - Product / Service
Continental Milkose India Ltd. - Key offerings
SWOT

15.9 Gujarat Co. Milk Ltd.

Gujarat Co. Milk Ltd. - Overview
Gujarat Co. Milk Ltd. - Product / Service
Gujarat Co. Milk Ltd. - Key offerings
SWOT

15.10 Imperial Malts Ltd.

Imperial Malts Ltd. - Overview
Imperial Malts Ltd. - Product / Service
Imperial Malts Ltd. - Key offerings
SWOT

15.11 Insta Foods

Insta Foods - Overview
Insta Foods - Product / Service
Insta Foods - Key offerings
SWOT

15.12 King Arthur Baking Co. Inc.

King Arthur Baking Co. Inc. - Overview
King Arthur Baking Co. Inc. - Product / Service
King Arthur Baking Co. Inc. - Key offerings
SWOT

15.13 Mondelez International Inc.

Mondelez International Inc. - Overview
Mondelez International Inc. - Business segments
Mondelez International Inc. - Key offerings
Mondelez International Inc. - Segment focus
SWOT

15.14 Muntons Plc

Muntons Plc - Overview
Muntons Plc - Product / Service
Muntons Plc - Key offerings
SWOT

15.15 Nestle SA

Nestle SA - Overview
Nestle SA - Business segments
Nestle SA - Key news
Nestle SA - Key offerings
Nestle SA - Segment focus
SWOT

15.16 R. Twining and Co. Ltd.

R. Twining and Co. Ltd. - Overview
R. Twining and Co. Ltd. - Product / Service
R. Twining and Co. Ltd. - Key offerings
SWOT

15.17 SSP Pvt. Ltd.

SSP Pvt. Ltd. - Overview
SSP Pvt. Ltd. - Product / Service
SSP Pvt. Ltd. - Key offerings
SWOT

15.18 Unilever PLC

Unilever PLC - Overview
Unilever PLC - Business segments
Unilever PLC - Key news
Unilever PLC - Key offerings
Unilever PLC - Segment focus
SWOT

16. Appendix

16.1 Scope of the report

Market definition
Objectives
Notes and caveats

16.2 Inclusions and exclusions checklist

Inclusions checklist
Exclusions checklist

16.3 Currency conversion rates for US$

16.4 Research methodology

16.5 Data procurement

Information sources

16.6 Data validation

16.7 Validation techniques employed for market sizing

16.8 Data synthesis

16.9 360 degree market analysis

16.10 List of abbreviations

Research Methodology

Technavio presents a detailed picture of the market by way of study, synthesis, and summation of data from multiple sources. The analysts have presented the various facets of the market with a particular focus on identifying the key industry influencers. The data thus presented is comprehensive, reliable, and the result of extensive research, both primary and secondary.

INFORMATION SOURCES

Primary sources

  • Manufacturers and suppliers
  • Channel partners
  • Industry experts
  • Strategic decision makers

Secondary sources

  • Industry journals and periodicals
  • Government data
  • Financial reports of key industry players
  • Historical data
  • Press releases

DATA ANALYSIS

Data Synthesis

  • Collation of data
  • Estimation of key figures
  • Analysis of derived insights

Data Validation

  • Triangulation with data models
  • Reference against proprietary databases
  • Corroboration with industry experts

REPORT WRITING

Qualitative

  • Market drivers
  • Market challenges
  • Market trends
  • Five forces analysis

Quantitative

  • Market size and forecast
  • Market segmentation
  • Geographical insights
  • Competitive landscape

Interested in this report?

Get your sample now to see our research methodology and insights!

Download Now

Frequently Asked Questions

Malted Milk market growth will increase by USD 4618.2 million during 2026-2030.

The Malted Milk market is expected to grow at a CAGR of 8.6% during 2026-2030.

Malted Milk market is segmented by Source (Wheat, Barley, Others) Distribution channel (Offline, Online) Form factor (Powder, Liquid)

Abbott Laboratories, Anthonys Goods, Briess Malt and Ingredients Co., CFI Group, Continental Milkose India Ltd., CTL Foods Pvt. Ltd., Gujarat Co. Milk Ltd., Imperial Malts Ltd., Insta Foods, King Arthur Baking Co. Inc., Mahalaxmi Malt Products Pvt Ltd, Mondelez International Inc., Muntons Plc, Nestle SA, R. Twining and Co. Ltd., SSP Pvt. Ltd., Unilever PLC are a few of the key vendors in the Malted Milk market.

APAC will register the highest growth rate of 42.9% among the other regions. Therefore, the Malted Milk market in APAC is expected to garner significant business opportunities for the vendors during the forecast period.

India, China, Japan, Australia, Indonesia, South Korea, Germany, UK, France, Italy, Spain, The Netherlands, US, Canada, Mexico, Brazil, Argentina, Chile, Saudi Arabia, UAE, South Africa, Israel, Turkey

  • Rising demand for functional nutrition is the driving factor this market.

The Malted Milk market vendors should focus on grabbing business opportunities from the Source segment as it accounted for the largest market share in the base year.
RIA - Research AI Assistant
Ask RIA
