Marine And Offshore Cables Market Size 2025-2029
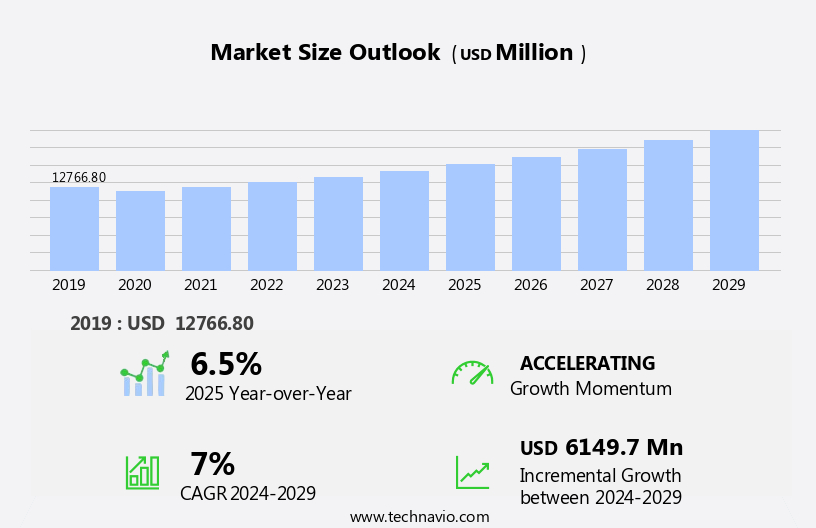
The marine and offshore cables market size is forecast to increase by USD 6.15 billion, at a CAGR of 7% between 2024 and 2029.
- The market is witnessing significant growth due to expanding opportunities In the offshore renewable energy sector. The increasing adoption of renewable energy sources, particularly wind and solar, is driving the demand for marine and offshore cables. Moreover, the market is experiencing a rise in mergers and acquisitions, as key players seek to expand their market presence and enhance their product offerings. However, cybersecurity concerns are posing a challenge to market growth, as the increasing use of advanced technologies in cable systems necessitates strong security measures to protect against potential threats. Overall, the market is poised for steady growth In the coming years, driven by these key trends and challenges.
What will be the Size of the Marine And Offshore Cables Market During the Forecast Period?
- The market encompasses the production and installation of specialized cables used for transmitting power and data in deep water environments. Key market dynamics include monitoring and maintenance to ensure the integrity of these systems, with trenching and laying vessels, cranes, and splicing techniques utilized during installation. Fault detection and underwater repair are crucial for maintaining performance and extending the lifespan of these cables. Renewable energy infrastructure, such as tidal energy systems and offshore wind farms, are major growth areas, driving demand for sustainable, high-performance cable designs and protection systems.
- Burial techniques and routing optimization are essential for minimizing environmental impact and ensuring efficient offshore grid infrastructure. The industry outlook is positive, with increasing energy demand and the shift towards green energy solutions, including dc electricity from ocean energy, driving growth in this market. Performance optimization and testing are ongoing priorities to ensure the reliability and longevity of these complex systems.
How is this Marine And Offshore Cables Industry segmented and which is the largest segment?
The marine and offshore cables industry research report provides comprehensive data (region-wise segment analysis), with forecasts and estimates in "USD million" for the period 2025-2029, as well as historical data from 2019-2023 for the following segments.
- Type
- Power cables
- Communication cables
- Control cables
- Instrument cables
- End-user
- Oil and gas
- Renewable energy
- Submarine
- Others
- Geography
- APAC
- China
- India
- Japan
- South Korea
- Europe
- Germany
- UK
- France
- North America
- Canada
- US
- Middle East and Africa
- South America
- Brazil
- APAC
By Type Insights
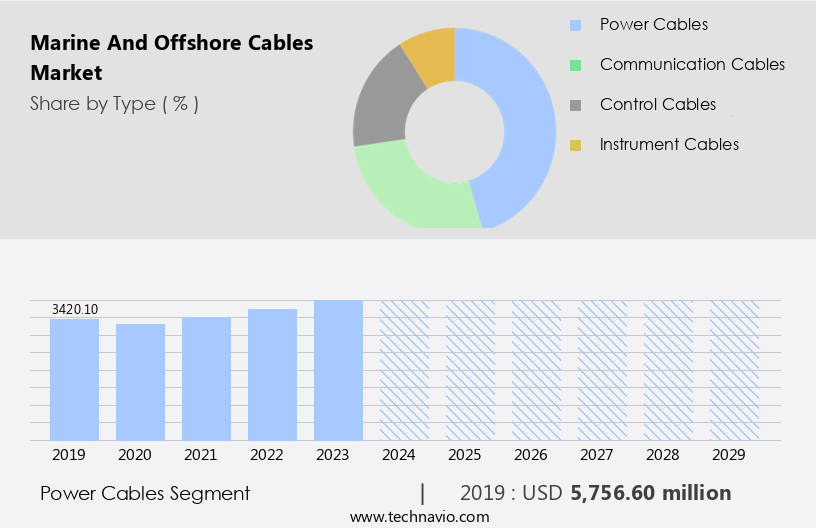
- The power cables segment is estimated to witness significant growth during the forecast period.
Power cables play a crucial role In the marine and offshore industry, providing electrical power to various applications such as marine vessels, offshore platforms, and underwater installations. These cables are specifically designed to withstand harsh environmental conditions, including high pressure, moisture, and salinity, ensuring a consistent and dependable power source. The shift towards electric propulsion systems in ships and the increasing demand for renewable energy projects, particularly offshore wind farms, are major growth drivers for the marine power cables market. High-voltage direct current (HVDC) cables, which offer efficient power transmission with minimal energy loss over long distances, are a significant segment within this market.
Additionally, the use of sustainable practices, lightweight and eco-friendly materials, and alternative technologies are becoming increasingly important In the marine and offshore cables industry to meet environmental regulations and climate goals. Telecommunications firms, energy companies, and offshore wind farm operators are key customers in this market. Power transmission for offshore wind farms, offshore platforms, and other marine installations requires specialized equipment, such as telescopic boom cranes, subs, and power transmission vessels, to install and maintain the cables. Real-time data monitoring systems are also essential for ensuring the optimal performance and reliability of these power transmission systems.
Get a glance at the Marine And Offshore Cables Industry report of share of various segments Request Free Sample
The power cables segment was valued at USD 5.76 billion in 2019 and showed a gradual increase during the forecast period.
Regional Analysis
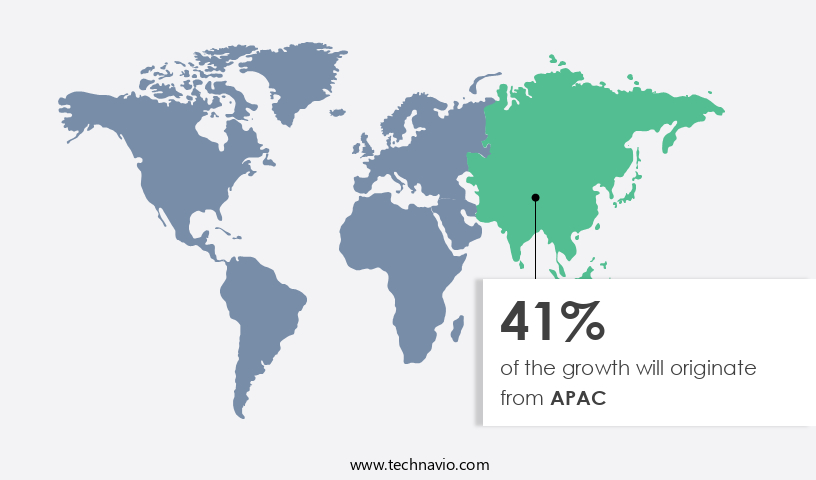
- APAC is estimated to contribute 41% to the growth of the global market during the forecast period.
Technavio's analysts have elaborately explained the regional trends and drivers that shape the market during the forecast period.
For more insights on the market share of various regions, Request Free Sample
The market In the Asia-Pacific (APAC) region is witnessing growth due to escalating investments in offshore infrastructure for oil and gas exploration, telecommunications networks, and renewable energy projects. Key countries, including China, South Korea, India, and Australia, are spearheading the demand for marine cables, driven by their economic expansion, urbanization, and commitment to sustainability. Installation methods for marine and offshore cables include direct laying, ploughing, and jetting. Sustainable practices and eco-friendly materials are increasingly utilized to minimize environmental impact. Alternative technologies, such as fiber optics and DC subpowers, are gaining popularity for their energy efficiency and low power transmission losses.
In addition, environmental regulations are stringent, and compliance is essential for energy companies and telecommunications firms. Offshore wind farms, offshore platforms, and harbor installations are major applications for marine and offshore cables. Tidal energy, offshore wind energy, and satellite communication systems are emerging sectors driving market growth. Telescopic boom cranes, subs, and power transmission vessels are used for installation. High voltage, climate goals, and offshore wind capacity expansion further fuel market demand.
Market Dynamics
Our market researchers analyzed the data with 2024 as the base year, along with the key drivers, trends, and challenges. A holistic analysis of drivers will help companies refine their marketing strategies to gain a competitive advantage.
What are the key market drivers leading to the rise In the adoption of Marine And Offshore Cables Industry?
Expansion in offshore renewable energy is the key driver of the market.
- The market is witnessing significant growth due to the increasing adoption of renewable energy sources, particularly offshore wind farms and subsea power transmission systems. The expansion of offshore wind energy projects necessitates specialized cables for power generation and distribution, leading to a rise in demand for marine cables. This trend is being driven by governments worldwide, as they support these initiatives to meet their climate goals and renewable energy targets. In 2023, the global offshore wind industry experienced a 24% increase, with approximately 10.5 GW of new capacity installed, bringing the total to 75 GW. Looking forward, around 400 GW of new offshore wind capacity is projected to be added by 2030.
- This growth is attributed to the use of eco-friendly materials and sustainable practices in the manufacturing of marine and offshore cables. Sustainable energy companies are increasingly focusing on the use of lightweight, sustainable materials and alternative technologies, such as fiber optics, to reduce power losses during energy transmission. Telecommunications firms are also investing in underwater cable systems for satellite communication systems and power transmission to offshore platforms. Environmental regulations are also playing a crucial role in the market's growth, as energy companies seek to minimize their carbon footprint and adhere to harsh environmental conditions. For instance, offshore wind farms and oil rigs require cables that can withstand extreme temperatures, saltwater corrosion, and high-voltage power transmission.
What are the market trends shaping the Marine And Offshore Cables Industry?
Growing mergers and acquisitions is the upcoming market trend.
- The market is experiencing a notable trend of consolidation, as companies seek to expand their offerings, bolster market presence, and support large-scale infrastructure projects. One illustrative example of this trend is the June 2024 acquisition of La Triveneta Cavi by Nexans, a French subsea power cable manufacturer, for over USD 869 million in revenue. This deal, which unites two leading players in the cable industry, underscores Nexans' strategic ambition to establish itself as a key player in electrification. Sustainable practices are increasingly shaping the market, with a focus on lightweight, eco-friendly materials and alternative technologies. For instance, energy companies and telecommunications firms are investing in fiber optics and DC subpowers to minimize power losses and enhance energy transmission efficiency.
- In the realm of renewable energy, offshore wind farms and tidal energy projects are driving demand for advanced, high-voltage cables that can withstand harsh environmental conditions. Environmental regulations are also playing a pivotal role In the market, as governments and industry players strive to meet climate goals and minimize the environmental impact of offshore projects. This is leading to increased adoption of sustainable energy solutions and the integration of real-time data monitoring systems to optimize energy usage and minimize emissions. The offshore ecosystem is diverse, encompassing offshore platforms, oil rigs, harbors, and vessels, among other structures. Telescopic boom cranes, subs, and other specialized equipment are essential for the installation of marine and offshore cables, ensuring the reliable and efficient transmission of power and data.
What challenges does the Marine And Offshore Cables Industry face during its growth?
Cybersecurity concerns is a key challenge affecting the industry growth.
- The market is experiencing significant growth due to the increasing demand for sustainable energy sources and telecommunications. Installation methods for these cables have evolved, with a focus on sustainable practices and the use of eco-friendly materials. Alternative technologies, such as fiber optics, are being adopted for power transmission in offshore wind farms and tidal energy projects. Environmental regulations are driving the use of lightweight materials and DC technology to reduce power losses and carbon emissions. Energy companies and telecommunications firms are investing in offshore platforms and wind farms to meet climate goals and expand their energy transmission capabilities. Harsh environmental conditions, such as those found in offshore wind energy and oil rigs, require specialized materials and installation methods.
- Real-time data monitoring is crucial for maintaining the efficiency and reliability of these systems. Cybersecurity concerns present a significant challenge In the market. Undersea cables carry 99% of global data, making them essential for international connectivity. The increasing reliance on these cables for communication and data transfer has raised concerns about their susceptibility to cyberattacks. Efforts are being made to enhance the security of these systems through advanced technologies and regulations. In the US, ports and harbors are investing in telescopic boom cranes and subs to install and maintain offshore cables. The use of DC subpowers is increasing for offshore wind energy projects, reducing power losses and improving efficiency.
Exclusive Customer Landscape
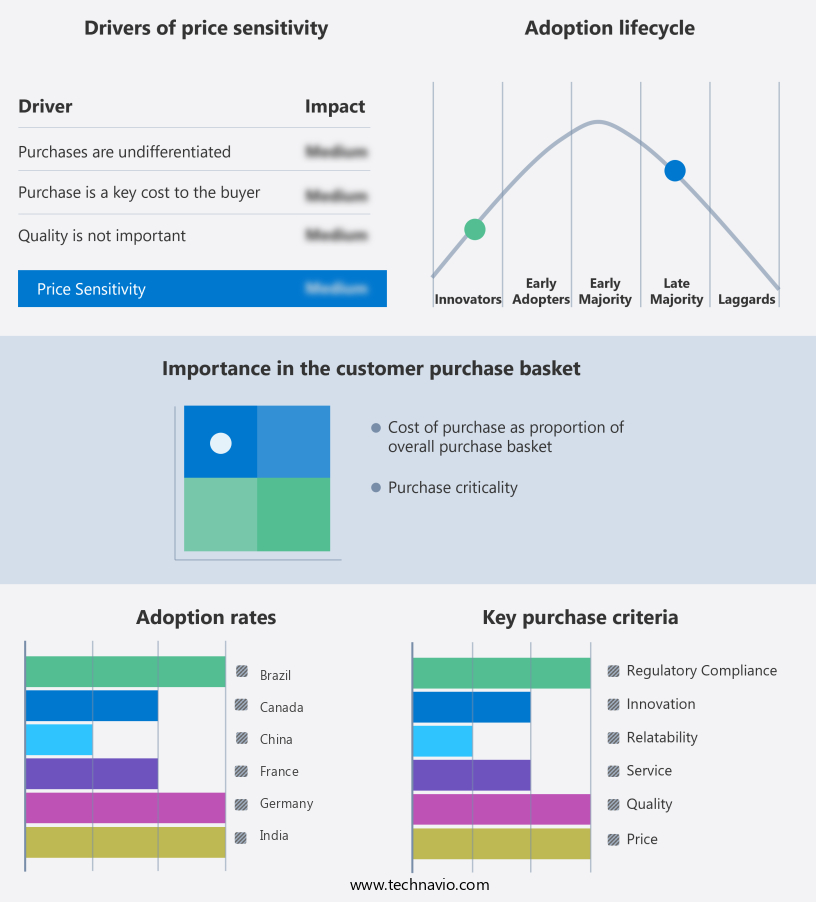
The market forecasting report includes the adoption lifecycle of the market, covering from the innovator's stage to the laggard's stage. It focuses on adoption rates in different regions based on penetration. Furthermore, the market report also includes key purchase criteria and drivers of price sensitivity to help companies evaluate and develop their market growth analysis strategies.
Customer Landscape
Key Companies & Market Insights
Companies are implementing various strategies, such as strategic alliances, market forecast, partnerships, mergers and acquisitions, geographical expansion, and product/service launches, to enhance their presence In the industry.
AFL - The company offers marine and offshore cables such as LMHD-Series OSP Heavy Duty MicroCore Cable, Flex-Span ADSS Fiber Optic Cable, and Standard ADSS Fiber Optic Cable.
The industry research and growth report includes detailed analyses of the competitive landscape of the market and information about key companies, including:
- Amphenol TPC
- Anixter
- Batt Cables Ltd.
- Cable Solutions Worldwide
- Caledonian Cables
- Cleveland Cable Co.
- Eland Cables
- Firstflex
- Hengtong Group Co. Ltd.
- JDR Cable Systems Ltd.
- LS Cable and System Ltd.
- Nexans SA
- NKT AS
- Prysmian S.p.A
- Roxtec
- SAB Brockskes GmbH and Co. KG
- Southwire Co. LLC
- Sumitomo Electric Industries Ltd.
- Teledyne Marine Technologies Inc.
Qualitative and quantitative analysis of companies has been conducted to help clients understand the wider business environment as well as the strengths and weaknesses of key industry players. Data is qualitatively analyzed to categorize companies as pure play, category-focused, industry-focused, and diversified; it is quantitatively analyzed to categorize companies as dominant, leading, strong, tentative, and weak.
Research Analyst Overview
The market encompasses a diverse range of applications, primarily focused on power transmission and telecommunications in offshore environments. These cables are essential for enabling various offshore activities, including the operation of offshore platforms, renewable energy installations, and telecommunications networks. One of the key trends driving the growth of the market is the increasing focus on sustainable practices and eco-friendly materials. Lightweight and sustainable materials are being utilized to reduce the carbon footprint of cable installation and maintenance. Additionally, alternative technologies, such as fiber optics, are gaining popularity due to their high bandwidth and low power consumption. Environmental regulations also play a significant role In the market. Further, strict regulations regarding power transmission and real-time data monitoring are being implemented to minimize the impact of offshore activities on ecosystems. Telecommunications firms and energy companies are investing in offshore wind farms to meet climate goals and reduce reliance on fossil fuels. Offshore wind farms are a major application area for marine and offshore cables.
In addition, these installations require high-voltage power transmission cables to transport electricity from the wind turbines to the onshore grid. Power losses are a significant concern in offshore wind energy, and advancements in DC subpowers and other technologies are being explored to mitigate these losses. Harsh environmental conditions, such as extreme temperatures, corrosive seawater, and high winds, pose challenges to the installation and maintenance of marine and offshore cables. Telescopic boom cranes, subs, and vessels are used for cable installation, while harbors and port terminals serve as key hubs for cable storage and maintenance. The offshore oil and gas industry also utilizes marine and offshore cables for various applications, including power transmission and communication systems. However, the shift towards renewable energy sources is expected to reduce the demand for cables In the oil and gas sector.
|
Marine And Offshore Cables Market Scope |
|
|
Report Coverage |
Details |
|
Page number |
212 |
|
Base year |
2024 |
|
Historic period |
2019-2023 |
|
Forecast period |
2025-2029 |
|
Growth momentum & CAGR |
Accelerate at a CAGR of 7% |
|
Market Growth 2025-2029 |
USD 6.15 billion |
|
Market structure |
Fragmented |
|
YoY growth 2024-2025(%) |
6.5 |
|
Key countries |
China, US, Japan, Germany, UK, India, France, South Korea, Brazil, and Canada |
|
Competitive landscape |
Leading Companies, Market Positioning of Companies, Competitive Strategies, and Industry Risks |
What are the Key Data Covered in this Market Research and Growth Report?
- CAGR of the Marine And Offshore Cables industry during the forecast period
- Detailed information on factors that will drive the market growth and forecasting between 2025 and 2029
- Precise estimation of the size of the market and its contribution of the industry in focus to the parent market
- Accurate predictions about upcoming growth and trends and changes in consumer behaviour
- Growth of the market across APAC, Europe, North America, Middle East and Africa, and South America
- Thorough analysis of the market's competitive landscape and detailed information about companies
- Comprehensive analysis of factors that will challenge the market growth of industry companies
We can help! Our analysts can customize this market research report to meet your requirements.
 RIA -
RIA - 
