Mechanical Seals Market Size 2026-2030
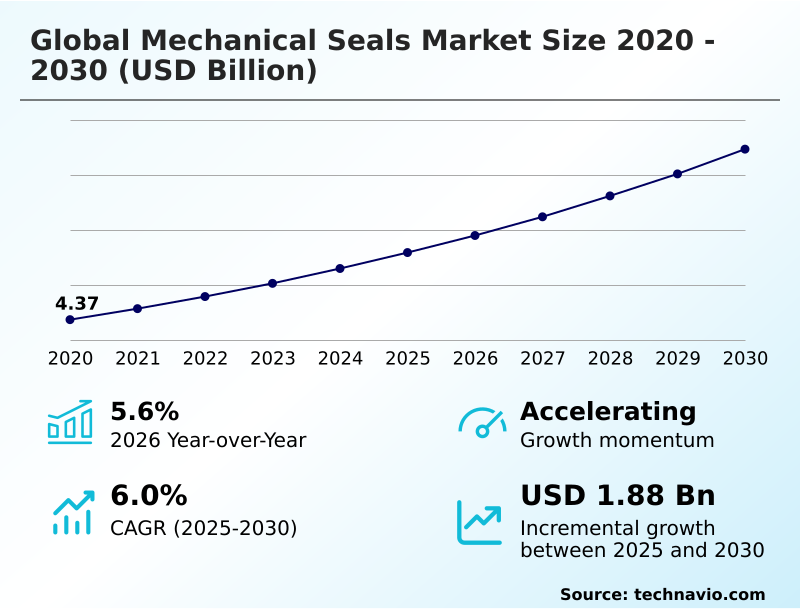
The mechanical seals market size is valued to increase by USD 1.88 billion, at a CAGR of 6% from 2025 to 2030. Growing industrialization boosts demand for reliable sealing solutions will drive the mechanical seals market.
Major Market Trends & Insights
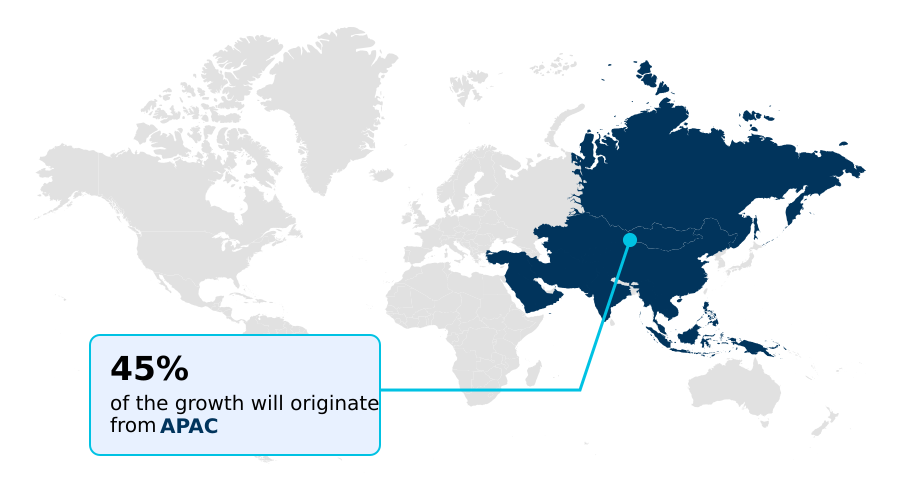
- APAC dominated the market and accounted for a 45% growth during the forecast period.
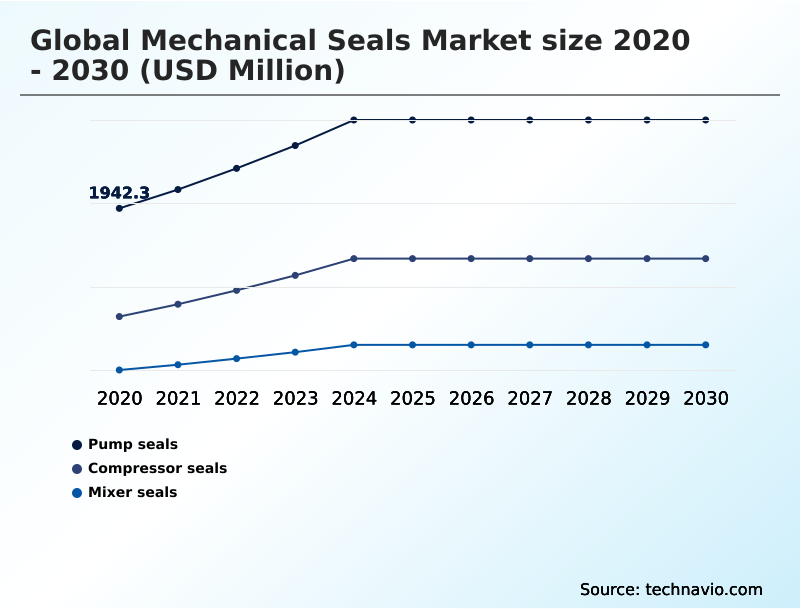
- By Type - Pump seals segment was valued at USD 2.42 billion in 2024
- By End-user - Oil and gas segment accounted for the largest market revenue share in 2024
Market Size & Forecast
- Market Opportunities: USD 3.10 billion
- Market Future Opportunities: USD 1.88 billion
- CAGR from 2025 to 2030 : 6%
Market Summary
- The mechanical seals market is integral to the reliability of global industries, providing essential components that ensure the safe and efficient operation of rotating equipment. Demand is driven by expanding industrial activities and the continuous need for energy efficiency and stringent environmental compliance.
- Key trends are shaping the landscape, including the adoption of advanced materials like silicon carbide and engineered polymers, which offer superior durability in high-temperature environments. Simultaneously, the integration of smart condition monitoring allows for predictive maintenance, a critical strategy for minimizing operational downtime.
- A primary challenge remains the risk of seal failure under conditions of high thermal stress and pressure fluctuations, which can lead to significant production losses. In a typical scenario, a large-scale chemical processing plant utilizes smart sealing systems with integrated vibration analysis to proactively manage equipment health.
- This shift from reactive repairs to data-driven maintenance highlights the industry's move toward intelligent, reliable fluid containment systems, improving operational safety and reducing long-term maintenance costs.
What will be the Size of the Mechanical Seals Market during the forecast period?
Get Key Insights on Market Forecast (PDF) Get Free Sample
How is the Mechanical Seals Market Segmented?
The mechanical seals industry research report provides comprehensive data (region-wise segment analysis), with forecasts and estimates in "USD million" for the period 2026-2030, as well as historical data from 2020-2024 for the following segments.
- Type
- Pump seals
- Compressor seals
- Mixer seals
- End-user
- Oil and gas
- General industries
- Chemicals and pharmaceuticals
- Water and wastewater treatment
- Others
- Product type
- Component
- Cartridge
- Split
- Geography
- APAC
- China
- Japan
- India
- North America
- US
- Canada
- Mexico
- Europe
- Germany
- UK
- France
- Middle East and Africa
- Saudi Arabia
- UAE
- South Africa
- South America
- Brazil
- Argentina
- Rest of World (ROW)
- APAC
By Type Insights
The pump seals segment is estimated to witness significant growth during the forecast period.
The global mechanical seals market is segmented by type, end-user, product type, and geography. In the type segment, pump seals are crucial for industrial fluid handling, essential in sectors from petrochemicals to water management.
These sealing systems prevent leakage in rotating equipment, with advanced ceramic materials enhancing durability. As industries upgrade, the focus on operational safety and reducing fluid loss drives demand.
Innovations in these fluid sealing solutions have led to a documented reduction in unscheduled equipment downtime by up to 25% in critical applications, underscoring their importance for system integrity and overall plant efficiency.
This ongoing enhancement ensures pump seals remain fundamental to modern industrial processes.
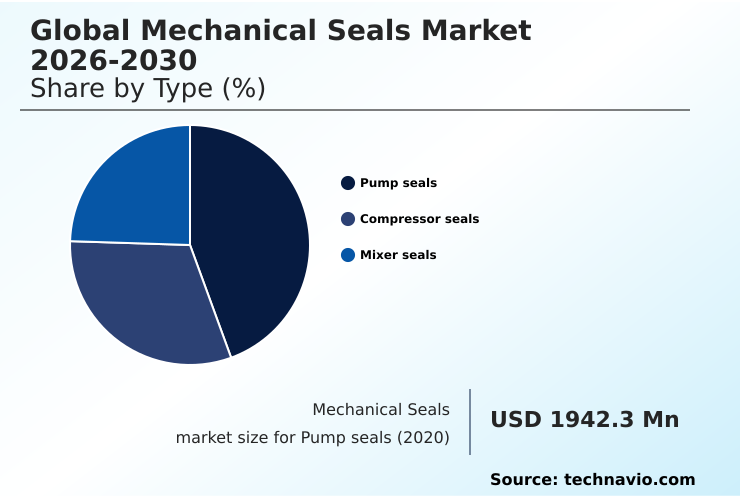
The Pump seals segment was valued at USD 2.42 billion in 2024 and showed a gradual increase during the forecast period.
Regional Analysis
APAC is estimated to contribute 45% to the growth of the global market during the forecast period.Technavio’s analysts have elaborately explained the regional trends and drivers that shape the market during the forecast period.
See How Mechanical Seals Market Demand is Rising in APAC Get Free Sample
The geographic landscape of the global mechanical seals market is defined by regional industrial strengths and investment priorities. APAC is set to contribute approximately 45% of the market's incremental growth, a testament to its expanding manufacturing and infrastructure sectors.
In this region, demand for components in new slurry pumps and processing equipment is exceptionally high. In contrast, mature markets like North America and Europe focus on technological upgrades and efficiency gains.
Here, retrofitting legacy systems with advanced sealing technologies is a priority; for example, upgrading to high-performance cartridge seals has improved energy efficiency in older pumping systems by as much as 15%.
This focus on optimizing existing assets, particularly in subsea operations and high-temperature environments, showcases a different, but equally vital, driver of market activity.
Market Dynamics
Our researchers analyzed the data with 2025 as the base year, along with the key drivers, trends, and challenges. A holistic analysis of drivers will help companies refine their marketing strategies to gain a competitive advantage.
- Addressing the complex demands of modern industry requires a diverse portfolio of specialized sealing technologies. For instance, mechanical seals for high-pressure pumps are fundamental in the energy sector, while robust sealing solutions for corrosive chemical processing are non-negotiable for safety and compliance in chemical plants.
- The evolution of advanced ceramic materials for industrial sealing provides the durability needed in these harsh conditions.
- For large-scale machinery, split mechanical seals for large equipment offer a significant advantage by allowing repairs without full disassembly, a feature that complements the rapid deployment of cartridge seals for quick maintenance turnaround, which can reduce replacement time by more than half compared to traditional methods.
- Technology is also pivotal in preventing seal failure in extreme temperatures through better designs and materials. For compressors, the adoption of dry gas seals for compressor applications is becoming standard for achieving higher efficiency and lower emissions. To support these advanced systems, effective workforce training for seal installation is essential for improving equipment reliability with better seals.
- The ability to troubleshoot common mechanical seal failures and understand lubrication film management in mechanical seals ensures that the full benefits of these technologies, including custom mechanical sealing for agitators, are realized.
What are the key market drivers leading to the rise in the adoption of Mechanical Seals Industry?
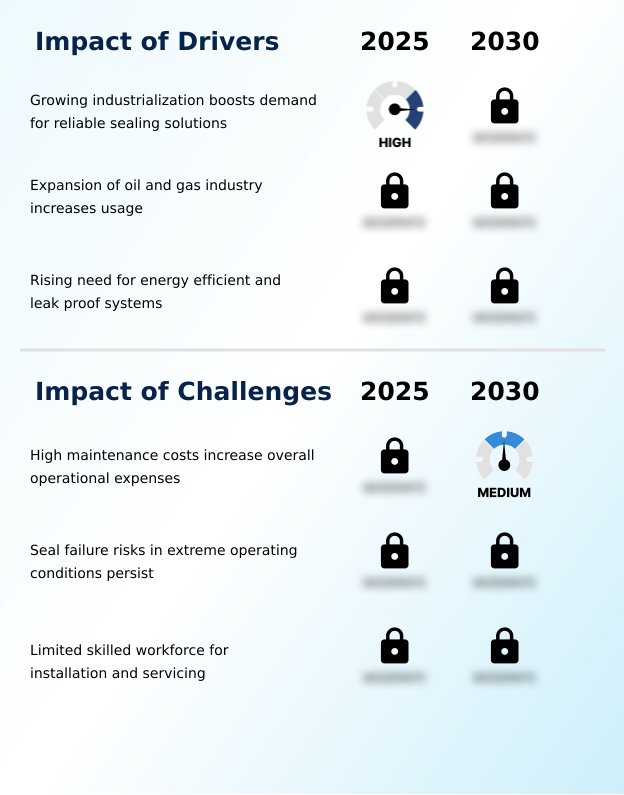
- Growing industrialization is a key driver for the market, boosting demand for reliable sealing solutions across expanding manufacturing activities.
- Market growth is fundamentally driven by the need for enhanced industrial efficiency and safety. Expanding industrial automation and the constant pressure to reduce operational downtime are increasing demand for reliable sealing systems.
- Stringent environmental compliance mandates are also a major factor, compelling industries to invest in superior leak prevention and fluid containment systems. For example, new regulations have spurred a 40% increase in the adoption of low-emission technologies in refinery upgrade projects.
- Furthermore, the rising need for energy efficiency is pushing the adoption of advanced sealing solutions.
- Optimized seals can significantly reduce friction and energy loss in rotating equipment, contributing to lower operational costs and a smaller carbon footprint, making them a strategic component in modern industrial operations.
What are the market trends shaping the Mechanical Seals Industry?
- The adoption of advanced ceramic and composite materials is an important upcoming trend in the market. These materials enhance durability and performance in extreme operating conditions.
- Key market trends are centered on enhancing performance and sustainability. The increasing use of advanced ceramic materials and composite seal materials is pivotal, offering superior resistance in abrasive environments. This shift helps mitigate thermal stress and pressure fluctuations, extending equipment lifespan. Another significant trend is the adoption of smart condition monitoring and predictive maintenance tools.
- These systems use real-time data and vibration analysis to forecast potential issues, with some achieving a 70% accuracy rate in predicting seal failures. Furthermore, there is a strong industry movement toward low-emission sealing and zero-emission seals, driven by environmental compliance.
- These eco-friendly materials and technologies, including dry gas sealing, not only reduce environmental impact but also improve operational safety, positioning them as a critical investment.
What challenges does the Mechanical Seals Industry face during its growth?
- High maintenance costs associated with sealing systems present a key challenge, increasing overall operational expenses and impacting industry growth.
- The primary challenges in the market revolve around cost, reliability, and expertise. High maintenance costs remain a significant concern, as unplanned operational downtime due to seal failure can account for up to 5% of total production losses in some processing industries.
- The risk of premature seal failure is particularly high in extreme high-pressure applications and high-temperature environments, where material degradation is accelerated. Another critical restraint is the limited skilled workforce available for the precise installation accuracy and alignment accuracy required for high-performance seals.
- This skills gap can lead to improper installations, reducing the effectiveness of even the most advanced fluid sealing solutions and undermining efforts to improve equipment reliability and operational safety.
Exclusive Technavio Analysis on Customer Landscape
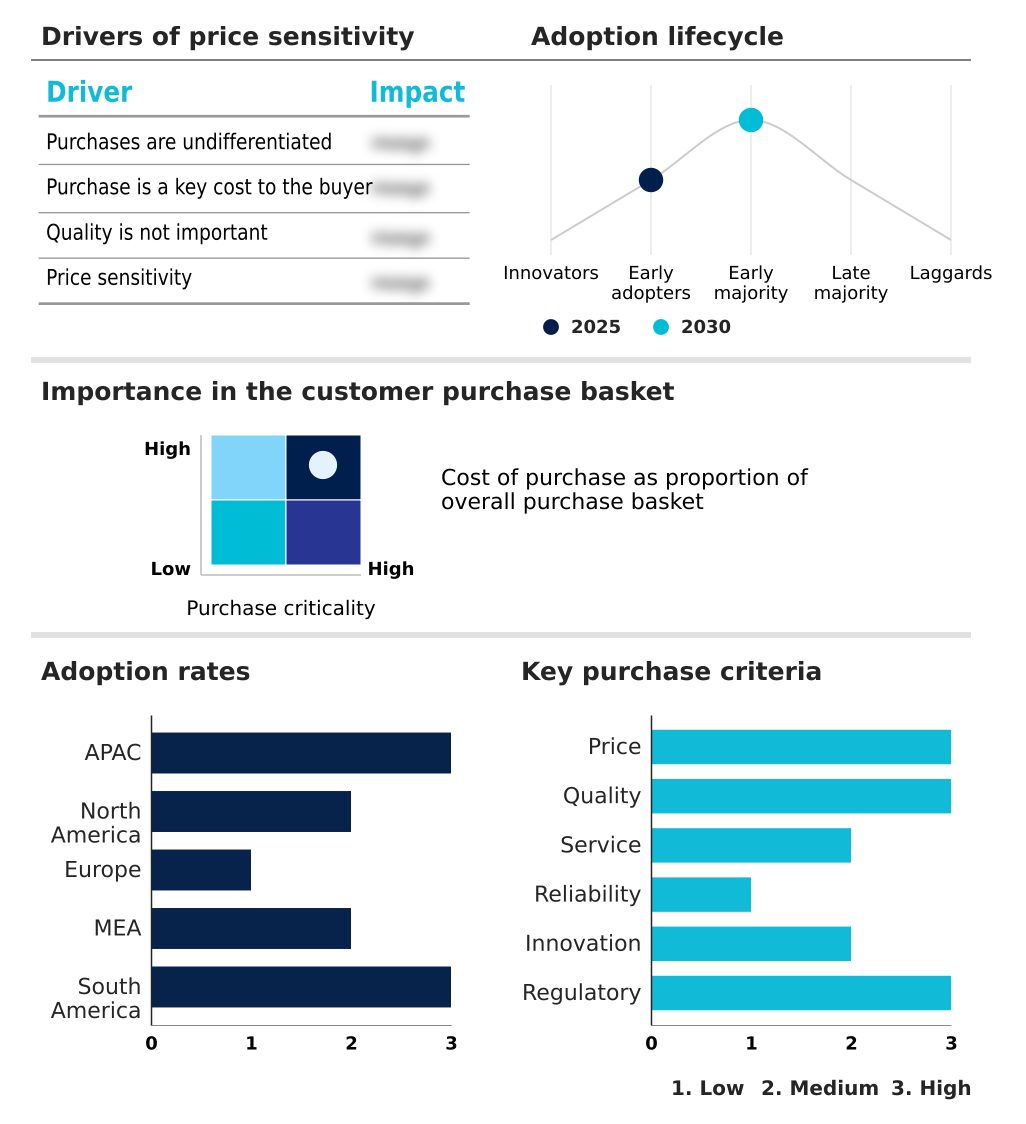
The mechanical seals market forecasting report includes the adoption lifecycle of the market, covering from the innovator’s stage to the laggard’s stage. It focuses on adoption rates in different regions based on penetration. Furthermore, the mechanical seals market report also includes key purchase criteria and drivers of price sensitivity to help companies evaluate and develop their market growth analysis strategies.
Customer Landscape of Mechanical Seals Industry
Competitive Landscape
Companies are implementing various strategies, such as strategic alliances, mechanical seals market forecast, partnerships, mergers and acquisitions, geographical expansion, and product/service launches, to enhance their presence in the industry.
A.W. Chesterton Co. - The company offers a diverse portfolio of mechanical seals, packing, and fluid sealing solutions, including specialized cartridge and split mechanical seals designed for various industrial applications.
The industry research and growth report includes detailed analyses of the competitive landscape of the market and information about key companies, including:
- A.W. Chesterton Co.
- Aesseal Plc
- Avon Seals Pvt. Ltd.
- BT Seals Ltd
- EagleBurgmann GmbH and Co. KG
- Flexaseal Inc.
- Flowserve Corp.
- Garlock Sealing Technologies
- Hennig Gasket and Seals Inc.
- John Crane Inc.
- Leak Pack Engineering Pvt. Ltd.
- Meccanotecnica Umbra S.p.A.
- MICROTEM Srl
- PPC Mechanical Seals
- Quba Seals India Pvt. Ltd.
- Saisi Mechanical Seal Co. Ltd.
- Sinoseal Holding Co. Ltd.
- Sulzer Ltd.
- Vulcan Seals Ltd
- Yalan Seals Co. Ltd
Qualitative and quantitative analysis of companies has been conducted to help clients understand the wider business environment as well as the strengths and weaknesses of key industry players. Data is qualitatively analyzed to categorize companies as pure play, category-focused, industry-focused, and diversified; it is quantitatively analyzed to categorize companies as dominant, leading, strong, tentative, and weak.
Recent Development and News in Mechanical seals market
- In September 2024, EagleBurgmann GmbH and Co. KG completed the acquisition of a specialized composite materials manufacturer, strengthening its in-house capabilities for producing high-performance seals for extreme temperature and pressure applications.
- In November 2024, A.W. Chesterton Co. announced a strategic partnership with a leading IIoT platform provider to integrate smart-sensor technology into its cartridge seal portfolio, enhancing predictive maintenance capabilities for customers in the chemical processing sector.
- In January 2025, Flowserve Corp. expanded its industrial sealing solutions portfolio to support growing demand from manufacturing and energy sectors, driven by global industrialization trends.
- In February 2025, Saint-Gobain expanded its advanced ceramic material solutions for industrial sealing applications, supporting improved performance and durability in high-temperature and corrosive environments.
Dive into Technavio’s robust research methodology, blending expert interviews, extensive data synthesis, and validated models for unparalleled Mechanical Seals Market insights. See full methodology.
| Market Scope | |
|---|---|
| Page number | 301 |
| Base year | 2025 |
| Historic period | 2020-2024 |
| Forecast period | 2026-2030 |
| Growth momentum & CAGR | Accelerate at a CAGR of 6% |
| Market growth 2026-2030 | USD 1882.1 million |
| Market structure | Fragmented |
| YoY growth 2025-2026(%) | 5.6% |
| Key countries | China, Japan, India, South Korea, Australia, Indonesia, US, Canada, Mexico, Germany, UK, France, Italy, Spain, The Netherlands, Saudi Arabia, UAE, South Africa, Israel, Turkey, Brazil, Argentina and Chile |
| Competitive landscape | Leading Companies, Market Positioning of Companies, Competitive Strategies, and Industry Risks |
Research Analyst Overview
- The mechanical seals market serves as a critical backbone for industrial reliability, where performance is measured in longevity and leak prevention. The industry is defined by the application of advanced components, from rotating shaft and stationary housing units to secondary sealing elements like O-rings and gaskets.
- Innovation is centered on material science, with advanced ceramic materials and engineered polymers such as silicon carbide becoming standard for handling thermal stress. The shift toward non-contacting designs and smart condition monitoring, which integrates predictive maintenance tools, is a key boardroom consideration driven by ESG goals.
- These sealing systems are crucial for managing everything from pressure fluctuations in mixer seals to ensuring the integrity of compressor seals. For instance, adopting advanced systems with non-contacting designs has been shown to reduce energy consumption in high-speed rotating equipment by up to 10%, directly impacting operational budgets.
- The development of specialized solutions like gas seals, metal bellows seals, and split mechanical seals demonstrates the market’s response to the need for efficiency and reduced downtime across all industrial applications.
What are the Key Data Covered in this Mechanical Seals Market Research and Growth Report?
-
What is the expected growth of the Mechanical Seals Market between 2026 and 2030?
-
USD 1.88 billion, at a CAGR of 6%
-
-
What segmentation does the market report cover?
-
The report is segmented by Type (Pump seals, Compressor seals, and Mixer seals), End-user (Oil and gas, General industries, Chemicals and pharmaceuticals, Water and wastewater treatment, and Others), Product Type (Component, Cartridge, and Split) and Geography (APAC, North America, Europe, Middle East and Africa, South America)
-
-
Which regions are analyzed in the report?
-
APAC, North America, Europe, Middle East and Africa and South America
-
-
What are the key growth drivers and market challenges?
-
Growing industrialization boosts demand for reliable sealing solutions, High maintenance costs increase overall operational expenses
-
-
Who are the major players in the Mechanical Seals Market?
-
A.W. Chesterton Co., Aesseal Plc, Avon Seals Pvt. Ltd., BT Seals Ltd, EagleBurgmann GmbH and Co. KG, Flexaseal Inc., Flowserve Corp., Garlock Sealing Technologies, Hennig Gasket and Seals Inc., John Crane Inc., Leak Pack Engineering Pvt. Ltd., Meccanotecnica Umbra S.p.A., MICROTEM Srl, PPC Mechanical Seals, Quba Seals India Pvt. Ltd., Saisi Mechanical Seal Co. Ltd., Sinoseal Holding Co. Ltd., Sulzer Ltd., Vulcan Seals Ltd and Yalan Seals Co. Ltd
-
Market Research Insights
- The market's dynamics are shaped by a strong focus on enhancing operational safety and achieving environmental compliance. Advanced fluid containment systems are critical, with implementations of modern sealing technologies demonstrating a reduction in fugitive emissions by over 60% in certain petrochemical applications. This push for leak prevention is coupled with a drive for efficiency.
- Facilities that adopt predictive maintenance strategies for their rotating equipment report up to a 40% decrease in unscheduled operational downtime. This directly impacts productivity and profitability by ensuring system integrity and extending equipment lifespan, making advanced sealing a cornerstone of modern industrial asset management.
We can help! Our analysts can customize this mechanical seals market research report to meet your requirements.
 RIA -
RIA - 
