
Medical Waste Management Market Analysis, Size, and Forecast 2026-2030: North America (US, Canada, and Mexico), Europe (Germany, UK, and France), APAC (China, Japan, and India), South America (Brazil, Argentina, and Chile), Middle East and Africa (Saudi Arabia, UAE, and South Africa), and Rest of World (ROW)

Medical Waste Management Market Analysis, Size, and Forecast 2026-2030:
North America (US, Canada, and Mexico), Europe (Germany, UK, and France), APAC (China, Japan, and India), South America (Brazil, Argentina, and Chile), Middle East and Africa (Saudi Arabia, UAE, and South Africa), and Rest of World (ROW)

Published: Oct 2026 292 Pages SKU: IRTNTR75215

Market Overview at a Glance

$4.26 B
Market Opportunity
6%
CAGR 2025 - 2030
36.5%
North America Growth
$10.28 B
Non-hazardous segment 2024

Medical Waste Management Market Size 2026-2030

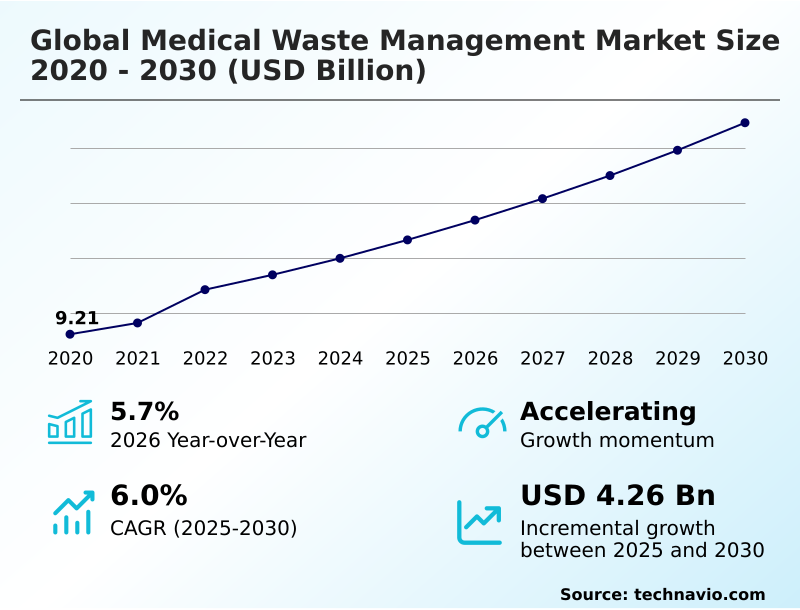
The medical waste management market size is valued to increase by USD 4.26 billion, at a CAGR of 6% from 2025 to 2030. Expanding medical infrastructure and inpatient admissions will drive the medical waste management market.

Major Market Trends & Insights

  • North America dominated the market and accounted for a 36.5% growth during the forecast period.
  • By Type - Non-hazardous segment was valued at USD 10.28 billion in 2024
  • By Technique - Offsite treatment segment accounted for the largest market revenue share in 2024

Market Size & Forecast

  • Market Opportunities: USD 7.69 billion
  • Market Future Opportunities: USD 4.26 billion
  • CAGR from 2025 to 2030 : 6%

Market Summary

  • The Medical Waste Management undergoes continuous operational shifts driven by stringent environmental protection laws and expanding healthcare access. The rapid expansion of clinical infrastructure and rising inpatient treatment rates directly increase the generation of infectious materials, forcing facilities to upgrade their disposal capabilities.
  • Large hospital networks deploying automated mechanical shredders and continuous emissions monitoring systems have achieved a 25% improvement in processing throughput, significantly enhancing supply chain optimization. However, the requirement for high-temperature incineration and specialized transport networks poses a substantial challenge, as high capital expenditures strain institutional budgets.
  • Overcoming these financial constraints requires strict adherence to statutory pathogen inactivation protocols to avoid severe regulatory penalties. Facilities implementing digital chain-of-custody manifests ensure unbroken traceability from clinical wards to final destruction, reducing compliance audit times by 30%. Ultimately, this systematic transition toward eco-friendly non-thermal processing minimizes environmental liabilities while maintaining robust public health standards across modern clinical environments.

What will be the Size of the Medical Waste Management Market during the forecast period?
Get Key Insights on Market Forecast (PDF) Get Free Sample

How is the Medical Waste Management Market Segmented?

The medical waste management industry research report provides comprehensive data (region-wise segment analysis), with forecasts and estimates in "USD million" for the period 2026-2030, as well as historical data from 2020-2024 for the following segments.

  • Type
    • Non-hazardous
    • Hazardous
  • Technique
    • Offsite treatment
    • Onsite treatment
  • Service
    • Collection and transportation
    • Treatment and disposal
    • Recycling
    • Others
  • Geography
    • North America
      • US
      • Canada
      • Mexico
    • Europe
      • Germany
      • UK
      • France
      • Italy
      • Spain
      • The Netherlands
    • APAC
      • China
      • Japan
      • India
      • South Korea
      • Australia
      • Indonesia
    • South America
      • Brazil
      • Argentina
      • Chile
    • Middle East and Africa
      • Saudi Arabia
      • UAE
      • South Africa
      • Egypt
      • Israel

By Type Insights

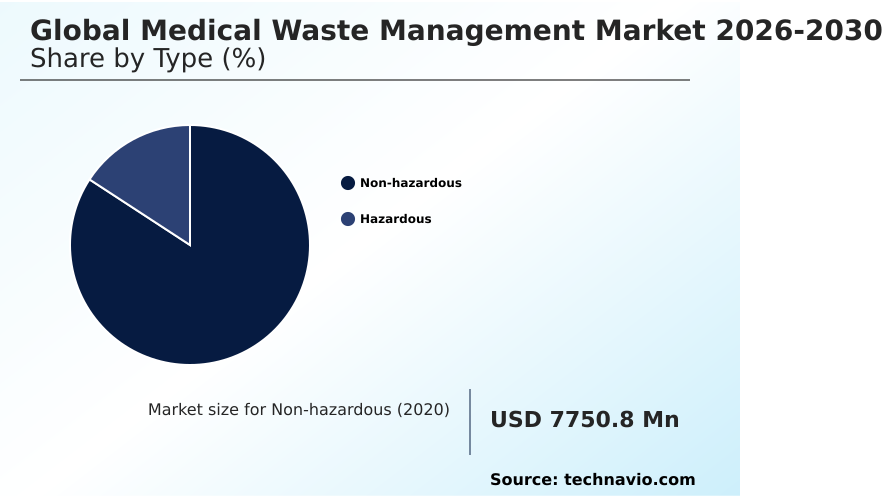
The non-hazardous segment is estimated to witness significant growth during the forecast period.

The non-hazardous segment accounts for a substantial majority of clinical refuse generation, necessitating distinct management strategies compared to the hazardous tier.

Effective biohazardous refuse segregation prevents cross-contamination prevention protocols from failing, ensuring general administrative and packaging materials do not inflate specialized disposal costs.

Facilities implementing advanced optical sorting sensors and rigorous color-coded containment vessels have observed sorting error rates reduced by 14%.

Conversely, the hazardous segment handles infectious materials and toxic agents, presenting a severe occupational safety hazard that requires decentralized onsite processing or specialized thermal destruction.

By separating these streams accurately, healthcare operators achieve a 22% improvement in waste diversion rates, directly lowering municipal disposal surcharges and optimizing overall facility operational efficiency.
Get Free Sample

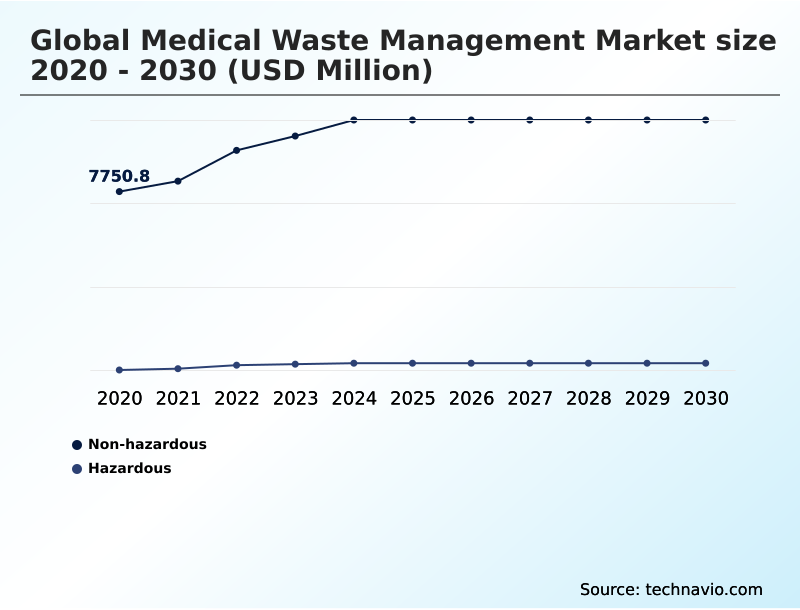
The Non-hazardous segment was valued at USD 10.28 billion in 2024 and showed a gradual increase during the forecast period.
Get Free Sample

Regional Analysis

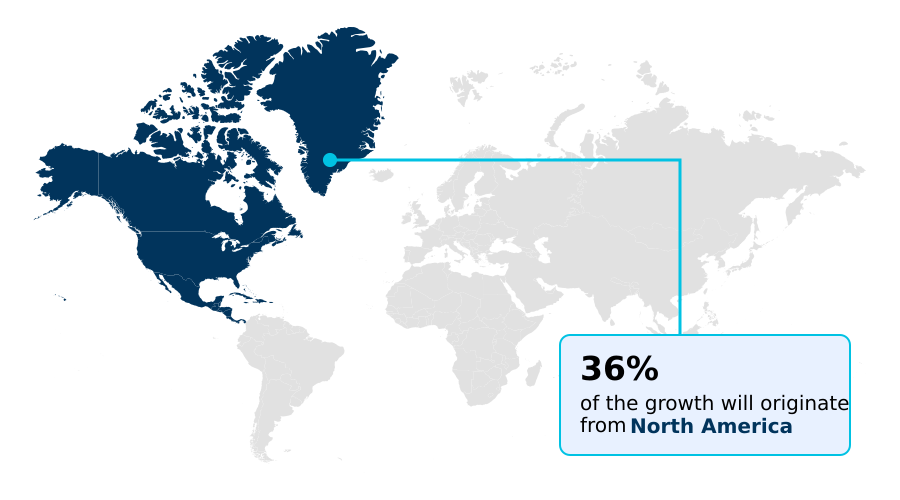
North America is estimated to contribute 36.5% to the growth of the global market during the forecast period.Technavio’s analysts have elaborately explained the regional trends and drivers that shape the market during the forecast period.
See How Medical Waste Management Market Demand is Rising in North America Get Free Sample

The regional adoption of advanced clinical refuse management infrastructure exhibits distinct operational variations driven by local regulatory frameworks.

North America demonstrates a rapid deployment of centralized offsite disposal systems, achieving a 20% higher compliance efficiency compared to regions lacking unified atmospheric emission standards.

This efficiency is largely attributed to strict controls on heavy metal discharge and aggressive reverse logistics optimization.

Conversely, European healthcare networks are prioritizing municipal zero-landfill targets by integrating fill-level sensor technology across large medical complexes, yielding a 35% reduction in unnecessary collection runs.

The implementation of radio-frequency identification tags in APAC has accelerated traceability, closing the regional technology gap by improving manifest accuracy by 18%.

By tailoring processing technologies to distinct municipal environmental mandates, service providers enhance regional treatment capacity while neutralizing severe biohazard transmission risks.

Market Dynamics

Our researchers analyzed the data with 2025 as the base year, along with the key drivers, trends, and challenges. A holistic analysis of drivers will help companies refine their marketing strategies to gain a competitive advantage.

  • The modernization of the Medical Waste Management requires continuous technological upgrades to satisfy evolving public health mandates. Healthcare institutions are aggressively transitioning away from manual sorting errors by prioritizing rigorous biohazardous refuse segregation and tracking across all clinical departments. This operational shift prevents low-risk general materials from entering expensive hazardous streams, drastically lowering overhead expenses.
  • Consequently, the adoption of automated robotic handling for clinics has proven critical in mitigating occupational exposure, demonstrating a 30% superiority in maintaining safe workflows compared to legacy manual handling practices. On the processing side, high-pressure steam autoclaving optimization ensures that infectious textiles and surgical instruments are completely decontaminated without releasing toxic atmospheric emissions.
  • This technical refinement strongly aligns with the growing institutional preference for eco-friendly non-thermal processing methods, which allow medical hubs to achieve stringent decarbonization benchmarks. To guarantee absolute regulatory compliance throughout the reverse logistics chain, administrators are focusing on comprehensive digital chain-of-custody manifests implementation.
  • By establishing unbroken, automated traceability from the exact point of generation to final destruction, environmental service operators deliver measurable enhancements in supply chain transparency, safeguarding public health and avoiding severe administrative penalties.
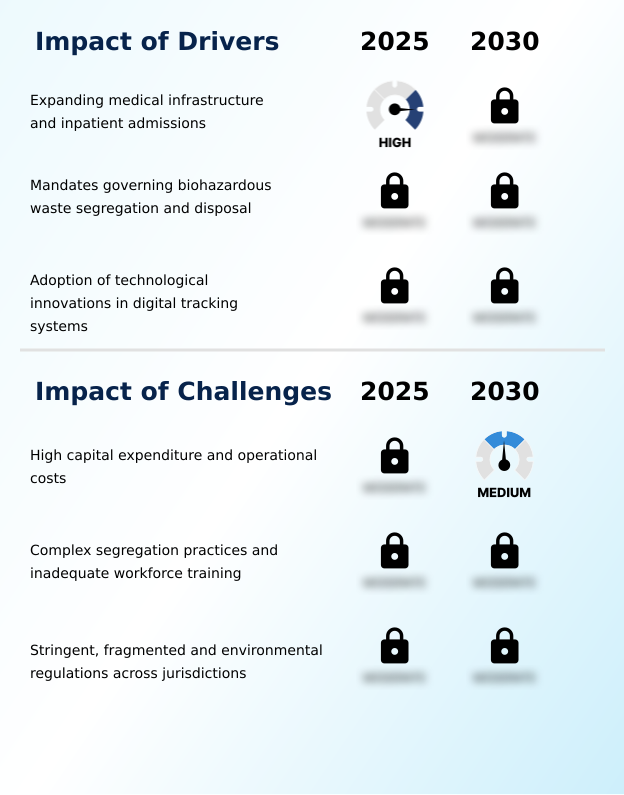
What are the key market drivers leading to the rise in the adoption of Medical Waste Management Industry?

  • The expanding medical infrastructure and rapidly rising inpatient admissions are serving as the primary drivers propelling overall industry expansion.

  • Escalating surgical volumes and inpatient admission rates are continuously amplifying the generation of infectious materials, driving mandatory upgrades to regional processing infrastructure.
  • This surge in clinical activity demands highly specialized handling for anatomical waste decontamination and the safe neutralization of hazardous chemical residues.
  • To combat rising overhead costs and capacity constraints, environmental service companies are rapidly deploying automated mechanical shredders alongside advanced thermal destruction units, which has boosted operational throughput efficiency by 28%.
  • Additionally, strict public health mandates require flawless traceability, prompting the widespread adoption of digital chain-of-custody manifests. This digital integration has reduced compliance reporting discrepancies by 40% while advancing toxic stack gas reduction efforts.
  • These continuous infrastructure enhancements ensure that healthcare networks maintain operational continuity and absolute regulatory compliance.

What are the market trends shaping the Medical Waste Management Industry?

  • The continuous integration of automated treatment technologies is emerging as a dominant trend reshaping operational efficiency in the industry.

  • The progressive transition away from emission-heavy thermal destruction toward sustainable non-thermal treatment alternatives represents a transformative structural trend across healthcare ecosystems. Stringent regulatory caps on atmospheric pollutants are compelling facility operators to adopt advanced high-pressure steam autoclaving, which eliminates the release of toxic stack gases.
  • This shift directly supports aggressive carbon footprint reduction goals, yielding a 35% decrease in facility-level greenhouse gas emissions. Simultaneously, the deployment of continuous emissions monitoring on legacy hardware ensures that remaining thermal operations maintain strict compliance with environmental thresholds.
  • Furthermore, the integration of internet-of-things fleet tracking across specialized reverse logistics networks has improved transport route efficiency by 22%, significantly reducing transit times for puncture-resistant sharp containers. These technological adoptions elevate operational efficiency while mitigating environmental contamination liabilities.

What challenges does the Medical Waste Management Industry face during its growth?

  • High capital expenditure and escalating operational costs present significant structural challenges affecting the deployment of advanced processing infrastructure.

  • The deployment of high-efficiency decontamination infrastructure is severely constrained by escalating capital requirements and highly fragmented environmental regulations. Establishing modern, compliant processing hubs capable of meeting strict statutory pathogen inactivation criteria demands immense upfront machinery procurement.
  • Furthermore, tightening thresholds on dioxin and furan emission from clinical waste incinerators force operators to continuously retrofit existing hardware, increasing routine maintenance expenditures by 25%. Frequent clinical staff turnover exacerbates these challenges by disrupting proper segregation protocols, heavily complicating illegal dumping mitigation strategies.
  • Consequently, healthcare networks struggle to achieve long-term utility expenditure reduction, as the installation of advanced localized processing infrastructure requires substantial financial commitment. Overcoming these fiscal barriers is critical for driving workplace safety improvement and preventing severe administrative penalties across the waste management continuum.

Exclusive Technavio Analysis on Customer Landscape

The medical waste management market forecasting report includes the adoption lifecycle of the market, covering from the innovator’s stage to the laggard’s stage. It focuses on adoption rates in different regions based on penetration. Furthermore, the medical waste management market report also includes key purchase criteria and drivers of price sensitivity to help companies evaluate and develop their market growth analysis strategies.
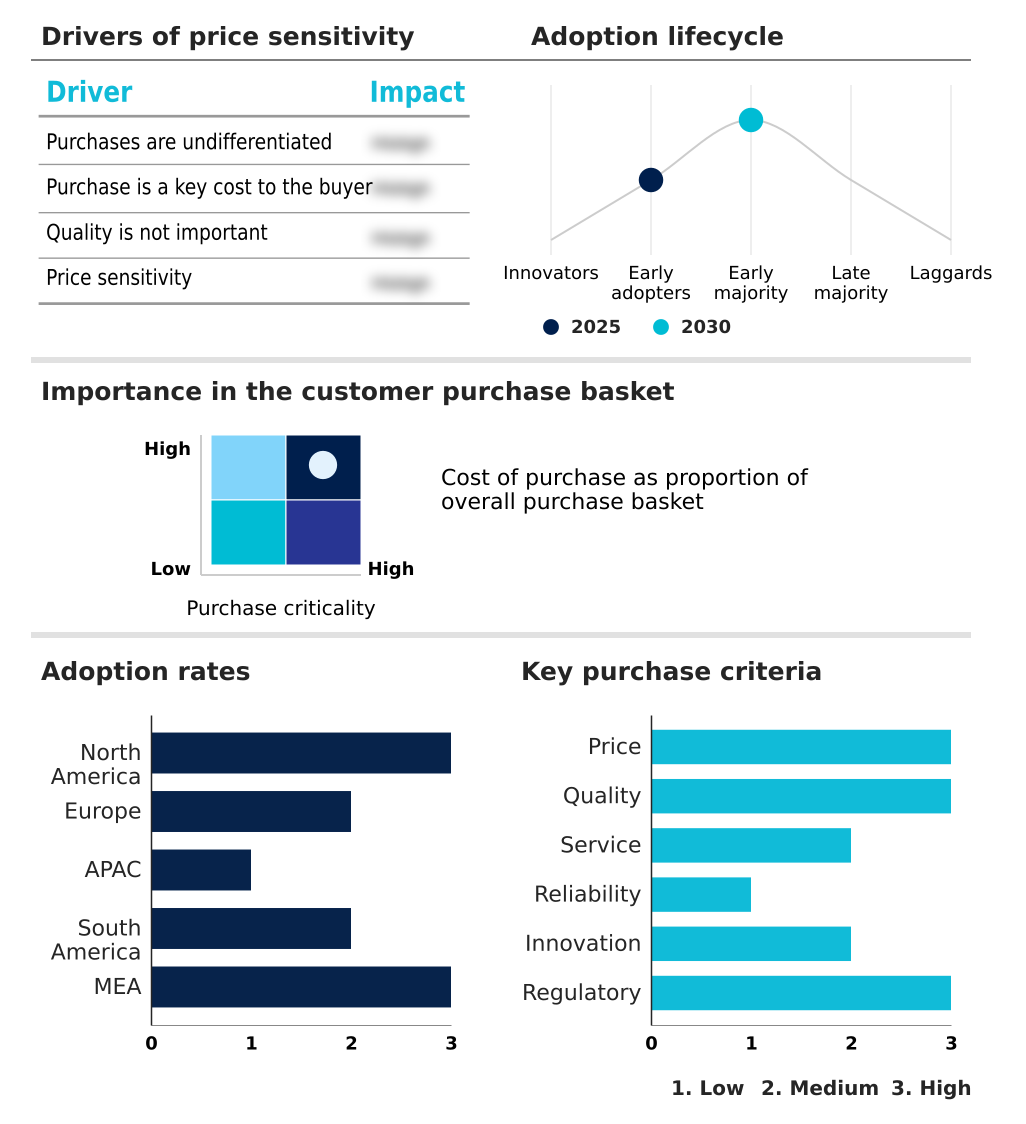
Customer Landscape of Medical Waste Management Industry

Competitive Landscape

Companies are implementing various strategies, such as strategic alliances, medical waste management market forecast, partnerships, mergers and acquisitions, geographical expansion, and product/service launches, to enhance their presence in the industry.

Averda - The service provider delivers specialized medical waste management, utilizing advanced sterilization and treatment systems for healthcare and laboratory operations to ensure absolute regulatory compliance and sanitation.

The industry research and growth report includes detailed analyses of the competitive landscape of the market and information about key companies, including:

  • Averda
  • BERTIN MEDICAL WASTE
  • BioMedical Waste Solutions LLC
  • Biotic Waste Ltd.
  • Casella Waste Systems Inc.
  • Clean Harbors Inc.
  • Cleanaway Waste Management Ltd.
  • Daniels Health
  • GIC Medical Disposal Inc.
  • Grupo Tradebe Medioambiente SL
  • MEDPRO Disposal LLC
  • Mumbai Waste Management Ltd.
  • Passco Environmental Solutions
  • Remondis SE and Co. KG
  • Rentokil Initial Plc
  • Republic Services Inc.
  • Stericycle Inc.
  • SUEZ SA
  • Triumvirate Environmental
  • Veolia Environment SA
  • Waste Management Inc.

Qualitative and quantitative analysis of companies has been conducted to help clients understand the wider business environment as well as the strengths and weaknesses of key industry players. Data is qualitatively analyzed to categorize companies as pure play, category-focused, industry-focused, and diversified; it is quantitatively analyzed to categorize companies as dominant, leading, strong, tentative, and weak.

Recent Development and News in Medical waste management market

  • In the Environmental and Facilities Services industry, the implementation of stringent atmospheric emission limits for municipal and industrial incinerators has accelerated the shift toward decarbonized disposal methodology, directly impacting Medical Waste Management demand by increasing the procurement of high-efficiency non-thermal treatment alternatives.
  • The widespread integration of internet-of-things fleet tracking across reverse logistics networks has optimized regional transit routing, directly impacting Medical Waste Management demand by improving collection schedule reliability by 18%.
  • Stringent corporate environmental sustainability mandates governing commercial waste diversion have driven investments in high-efficiency shredding and material recovery post-treatment, directly impacting Medical Waste Management demand for non-hazardous clinical plastic recycling.
  • The adoption of automated robotic handling and smart waste bin sensor networks in large-scale facility management operations has reduced manual labor dependency, directly impacting Medical Waste Management demand by lowering workplace safety improvement costs by 22%.

Dive into Technavio’s robust research methodology, blending expert interviews, extensive data synthesis, and validated models for unparalleled Medical Waste Management Market insights. See full methodology.

Market Scope
Page number 292
Base year 2025
Historic period 2020-2024
Forecast period 2026-2030
Growth momentum & CAGR Accelerate at a CAGR of 6%
Market growth 2026-2030 USD 4257.5 million
Market structure Fragmented
YoY growth 2025-2026(%) 5.7%
Key countries US, Canada, Mexico, Germany, UK, France, Italy, Spain, The Netherlands, China, Japan, India, South Korea, Australia, Indonesia, Brazil, Argentina, Chile, Saudi Arabia, UAE, South Africa, Egypt and Israel
Competitive landscape Leading Companies, Market Positioning of Companies, Competitive Strategies, and Industry Risks

Request Free Sample

Research Analyst Overview

  • The operational dynamics of the Medical Waste Management reflect a sustained shift toward automation and rigorous environmental compliance. Healthcare administrators are systematically abandoning outdated, unlined land disposal in favor of advanced high-temperature incineration equipped with multi-stage flue gas cleaning technology. This transition is critical for addressing complex cytotoxic pharmaceutical disposal, effectively neutralizing toxic chemical compounds that threaten public water systems.
  • Facilities replacing legacy thermal hardware with continuous microwave disinfection units have achieved a 40% reduction in on-site energy consumption, directly improving long-term budgetary planning. The strategic integration of automated robotic handling within centralized processing plants significantly reduces human interaction with hazardous materials, establishing robust pathogen inactivation protocols.
  • Furthermore, the deployment of specialized chemical neutralization methods offers a highly efficient decontamination pathway for highly reactive laboratory liquids. By adopting these high-efficiency decontamination platforms, medical institutions maintain uninterrupted clinical operations, mitigate severe occupational safety hazards, and ensure complete alignment with evolving regulatory directives governing the secure destruction of infectious refuse.

What are the Key Data Covered in this Medical Waste Management Market Research and Growth Report?

  • What is the expected growth of the Medical Waste Management Market between 2026 and 2030?

    • USD 4.26 billion, at a CAGR of 6%

  • What segmentation does the market report cover?

    • The report is segmented by Type (Non-hazardous, and Hazardous), Technique (Offsite treatment, and Onsite treatment), Service (Collection and transportation, Treatment and disposal, Recycling, and Others) and Geography (North America, Europe, APAC, South America, Middle East and Africa)

  • Which regions are analyzed in the report?

    • North America, Europe, APAC, South America and Middle East and Africa

  • What are the key growth drivers and market challenges?

    • Expanding medical infrastructure and inpatient admissions, High capital expenditure and operational costs

  • Who are the major players in the Medical Waste Management Market?

    • Averda, BERTIN MEDICAL WASTE, BioMedical Waste Solutions LLC, Biotic Waste Ltd., Casella Waste Systems Inc., Clean Harbors Inc., Cleanaway Waste Management Ltd., Daniels Health, GIC Medical Disposal Inc., Grupo Tradebe Medioambiente SL, MEDPRO Disposal LLC, Mumbai Waste Management Ltd., Passco Environmental Solutions, Remondis SE and Co. KG, Rentokil Initial Plc, Republic Services Inc., Stericycle Inc., SUEZ SA, Triumvirate Environmental, Veolia Environment SA and Waste Management Inc.

Market Research Insights

  • The continuous evolution of the Medical Waste Management is primarily shaped by escalating environmental sustainability mandates and the urgent need for cross-contamination prevention. Healthcare facilities are aggressively upgrading their supply chain tracking software to mitigate the severe biohazard transmission risk associated with manual handling errors.
  • By deploying a smart waste bin sensor framework across clinical wards, hospital networks have improved capacity monitoring accuracy by 28%. Additionally, the transition toward localized processing infrastructure has reduced long-distance transportation requirements, yielding a 15% decrease in utility expenditure reduction.
  • These structural enhancements ensure absolute regulatory compliance, driving measurable improvements in facility sanitation and overall operational resilience without inflating overhead costs.

We can help! Our analysts can customize this medical waste management market research report to meet your requirements.

Get in touch

1. Executive Summary

1.1 Market overview

Executive Summary - Chart on Market Overview
Executive Summary - Data Table on Market Overview
Executive Summary - Chart on Global Market Characteristics
Executive Summary - Chart on Market by Geography
Executive Summary - Chart on Market Segmentation by Type
Executive Summary - Chart on Market Segmentation by Technique
Executive Summary - Chart on Market Segmentation by Service
Executive Summary - Chart on Incremental Growth
Executive Summary - Data Table on Incremental Growth
Executive Summary - Chart on Company Market Positioning

2. Technavio Analysis

2.1 Analysis of price sensitivity, lifecycle, customer purchase basket, adoption rates, and purchase criteria

2.2 Criticality of inputs and Factors of differentiation

Chart on Overview on criticality of inputs and factors of differentiation

2.3 Factors of disruption

Chart on Overview on factors of disruption

2.4 Impact of drivers and challenges

Chart on Impact of drivers and challenges in 2025 and 2030

3. Market Landscape

3.1 Market ecosystem

Chart on Parent Market
Data Table on - Parent Market

3.2 Market characteristics

Chart on Market characteristics analysis

3.3 Value chain analysis

Chart on Value chain analysis

4. Market Sizing

4.1 Market definition

Data Table on Offerings of companies included in the market definition

4.2 Market segment analysis

Market segments

4.3 Market size 2025

4.4 Market outlook: Forecast for 2025-2030

Chart on Global - Market size and forecast 2025-2030 ($ million)
Data Table on Global - Market size and forecast 2025-2030 ($ million)
Chart on Global Market: Year-over-year growth 2025-2030 (%)
Data Table on Global Market: Year-over-year growth 2025-2030 (%)

5. Historic Market Size

5.1 Global Medical Waste Management Market 2020 - 2024

Historic Market Size - Data Table on Global Medical Waste Management Market 2020 - 2024 ($ million)

5.2 Type segment analysis 2020 - 2024

Historic Market Size - Type Segment 2020 - 2024 ($ million)

5.3 Technique segment analysis 2020 - 2024

Historic Market Size - Technique Segment 2020 - 2024 ($ million)

5.4 Service segment analysis 2020 - 2024

Historic Market Size - Service Segment 2020 - 2024 ($ million)

5.5 Geography segment analysis 2020 - 2024

Historic Market Size - Geography Segment 2020 - 2024 ($ million)

5.6 Country segment analysis 2020 - 2024

Historic Market Size - Country Segment 2020 - 2024 ($ million)

6. Qualitative Analysis

6.1 Impact of AI in Global Medical Waste Management Market

6.2 Impact of Geopolitical Conflicts on Global Medical Waste Management Market

7. Five Forces Analysis

7.1 Five forces summary

Five forces analysis - Comparison between 2025 and 2030

7.2 Bargaining power of buyers

Bargaining power of buyers - Impact of key factors 2025 and 2030

7.3 Bargaining power of suppliers

Bargaining power of suppliers - Impact of key factors in 2025 and 2030

7.4 Threat of new entrants

Threat of new entrants - Impact of key factors in 2025 and 2030

7.5 Threat of substitutes

Threat of substitutes - Impact of key factors in 2025 and 2030

7.6 Threat of rivalry

Threat of rivalry - Impact of key factors in 2025 and 2030

7.7 Market condition

Chart on Market condition - Five forces 2025 and 2030

8. Market Segmentation by Type

8.1 Market segments

Chart on Type - Market share 2025-2030 (%)
Data Table on Type - Market share 2025-2030 (%)

8.2 Comparison by Type

Chart on Comparison by Type
Data Table on Comparison by Type

8.3 Non-hazardous - Market size and forecast 2025-2030

Chart on Non-hazardous - Market size and forecast 2025-2030 ($ million)
Data Table on Non-hazardous - Market size and forecast 2025-2030 ($ million)
Chart on Non-hazardous - Year-over-year growth 2025-2030 (%)
Data Table on Non-hazardous - Year-over-year growth 2025-2030 (%)

8.4 Hazardous - Market size and forecast 2025-2030

Chart on Hazardous - Market size and forecast 2025-2030 ($ million)
Data Table on Hazardous - Market size and forecast 2025-2030 ($ million)
Chart on Hazardous - Year-over-year growth 2025-2030 (%)
Data Table on Hazardous - Year-over-year growth 2025-2030 (%)

8.5 Market opportunity by Type

Market opportunity by Type ($ million)
Data Table on Market opportunity by Type ($ million)

9. Market Segmentation by Technique

9.1 Market segments

Chart on Technique - Market share 2025-2030 (%)
Data Table on Technique - Market share 2025-2030 (%)

9.2 Comparison by Technique

Chart on Comparison by Technique
Data Table on Comparison by Technique

9.3 Offsite treatment - Market size and forecast 2025-2030

Chart on Offsite treatment - Market size and forecast 2025-2030 ($ million)
Data Table on Offsite treatment - Market size and forecast 2025-2030 ($ million)
Chart on Offsite treatment - Year-over-year growth 2025-2030 (%)
Data Table on Offsite treatment - Year-over-year growth 2025-2030 (%)

9.4 Onsite treatment - Market size and forecast 2025-2030

Chart on Onsite treatment - Market size and forecast 2025-2030 ($ million)
Data Table on Onsite treatment - Market size and forecast 2025-2030 ($ million)
Chart on Onsite treatment - Year-over-year growth 2025-2030 (%)
Data Table on Onsite treatment - Year-over-year growth 2025-2030 (%)

9.5 Market opportunity by Technique

Market opportunity by Technique ($ million)
Data Table on Market opportunity by Technique ($ million)

10. Market Segmentation by Service

10.1 Market segments

Chart on Service - Market share 2025-2030 (%)
Data Table on Service - Market share 2025-2030 (%)

10.2 Comparison by Service

Chart on Comparison by Service
Data Table on Comparison by Service

10.3 Collection and transportation - Market size and forecast 2025-2030

Chart on Collection and transportation - Market size and forecast 2025-2030 ($ million)
Data Table on Collection and transportation - Market size and forecast 2025-2030 ($ million)
Chart on Collection and transportation - Year-over-year growth 2025-2030 (%)
Data Table on Collection and transportation - Year-over-year growth 2025-2030 (%)

10.4 Treatment and disposal - Market size and forecast 2025-2030

Chart on Treatment and disposal - Market size and forecast 2025-2030 ($ million)
Data Table on Treatment and disposal - Market size and forecast 2025-2030 ($ million)
Chart on Treatment and disposal - Year-over-year growth 2025-2030 (%)
Data Table on Treatment and disposal - Year-over-year growth 2025-2030 (%)

10.5 Recycling - Market size and forecast 2025-2030

Chart on Recycling - Market size and forecast 2025-2030 ($ million)
Data Table on Recycling - Market size and forecast 2025-2030 ($ million)
Chart on Recycling - Year-over-year growth 2025-2030 (%)
Data Table on Recycling - Year-over-year growth 2025-2030 (%)

10.6 Others - Market size and forecast 2025-2030

Chart on Others - Market size and forecast 2025-2030 ($ million)
Data Table on Others - Market size and forecast 2025-2030 ($ million)
Chart on Others - Year-over-year growth 2025-2030 (%)
Data Table on Others - Year-over-year growth 2025-2030 (%)

10.7 Market opportunity by Service

Market opportunity by Service ($ million)
Data Table on Market opportunity by Service ($ million)

11. Customer Landscape

11.1 Customer landscape overview

Analysis of price sensitivity, lifecycle, customer purchase basket, adoption rates, and purchase criteria

12. Geographic Landscape

12.1 Geographic segmentation

Chart on Market share by geography 2025-2030 (%)
Data Table on Market share by geography 2025-2030 (%)

12.2 Geographic comparison

Chart on Geographic comparison
Data Table on Geographic comparison

12.3 North America - Market size and forecast 2025-2030

Chart on North America - Market size and forecast 2025-2030 ($ million)
Data Table on North America - Market size and forecast 2025-2030 ($ million)
Chart on North America - Year-over-year growth 2025-2030 (%)
Data Table on North America - Year-over-year growth 2025-2030 (%)
Chart on Regional Comparison - North America
Data Table on Regional Comparison - North America

12.3.1 US - Market size and forecast 2025-2030

Chart on US - Market size and forecast 2025-2030 ($ million)
Data Table on US - Market size and forecast 2025-2030 ($ million)
Chart on US - Year-over-year growth 2025-2030 (%)
Data Table on US - Year-over-year growth 2025-2030 (%)

12.3.2 Canada - Market size and forecast 2025-2030

Chart on Canada - Market size and forecast 2025-2030 ($ million)
Data Table on Canada - Market size and forecast 2025-2030 ($ million)
Chart on Canada - Year-over-year growth 2025-2030 (%)
Data Table on Canada - Year-over-year growth 2025-2030 (%)

12.3.3 Mexico - Market size and forecast 2025-2030

Chart on Mexico - Market size and forecast 2025-2030 ($ million)
Data Table on Mexico - Market size and forecast 2025-2030 ($ million)
Chart on Mexico - Year-over-year growth 2025-2030 (%)
Data Table on Mexico - Year-over-year growth 2025-2030 (%)

12.4 Europe - Market size and forecast 2025-2030

Chart on Europe - Market size and forecast 2025-2030 ($ million)
Data Table on Europe - Market size and forecast 2025-2030 ($ million)
Chart on Europe - Year-over-year growth 2025-2030 (%)
Data Table on Europe - Year-over-year growth 2025-2030 (%)
Chart on Regional Comparison - Europe
Data Table on Regional Comparison - Europe

12.4.1 Germany - Market size and forecast 2025-2030

Chart on Germany - Market size and forecast 2025-2030 ($ million)
Data Table on Germany - Market size and forecast 2025-2030 ($ million)
Chart on Germany - Year-over-year growth 2025-2030 (%)
Data Table on Germany - Year-over-year growth 2025-2030 (%)

12.4.2 UK - Market size and forecast 2025-2030

Chart on UK - Market size and forecast 2025-2030 ($ million)
Data Table on UK - Market size and forecast 2025-2030 ($ million)
Chart on UK - Year-over-year growth 2025-2030 (%)
Data Table on UK - Year-over-year growth 2025-2030 (%)

12.4.3 France - Market size and forecast 2025-2030

Chart on France - Market size and forecast 2025-2030 ($ million)
Data Table on France - Market size and forecast 2025-2030 ($ million)
Chart on France - Year-over-year growth 2025-2030 (%)
Data Table on France - Year-over-year growth 2025-2030 (%)

12.4.4 Italy - Market size and forecast 2025-2030

Chart on Italy - Market size and forecast 2025-2030 ($ million)
Data Table on Italy - Market size and forecast 2025-2030 ($ million)
Chart on Italy - Year-over-year growth 2025-2030 (%)
Data Table on Italy - Year-over-year growth 2025-2030 (%)

12.4.5 Spain - Market size and forecast 2025-2030

Chart on Spain - Market size and forecast 2025-2030 ($ million)
Data Table on Spain - Market size and forecast 2025-2030 ($ million)
Chart on Spain - Year-over-year growth 2025-2030 (%)
Data Table on Spain - Year-over-year growth 2025-2030 (%)

12.4.6 The Netherlands - Market size and forecast 2025-2030

Chart on The Netherlands - Market size and forecast 2025-2030 ($ million)
Data Table on The Netherlands - Market size and forecast 2025-2030 ($ million)
Chart on The Netherlands - Year-over-year growth 2025-2030 (%)
Data Table on The Netherlands - Year-over-year growth 2025-2030 (%)

12.5 APAC - Market size and forecast 2025-2030

Chart on APAC - Market size and forecast 2025-2030 ($ million)
Data Table on APAC - Market size and forecast 2025-2030 ($ million)
Chart on APAC - Year-over-year growth 2025-2030 (%)
Data Table on APAC - Year-over-year growth 2025-2030 (%)
Chart on Regional Comparison - APAC
Data Table on Regional Comparison - APAC

12.5.1 China - Market size and forecast 2025-2030

Chart on China - Market size and forecast 2025-2030 ($ million)
Data Table on China - Market size and forecast 2025-2030 ($ million)
Chart on China - Year-over-year growth 2025-2030 (%)
Data Table on China - Year-over-year growth 2025-2030 (%)

12.5.2 Japan - Market size and forecast 2025-2030

Chart on Japan - Market size and forecast 2025-2030 ($ million)
Data Table on Japan - Market size and forecast 2025-2030 ($ million)
Chart on Japan - Year-over-year growth 2025-2030 (%)
Data Table on Japan - Year-over-year growth 2025-2030 (%)

12.5.3 India - Market size and forecast 2025-2030

Chart on India - Market size and forecast 2025-2030 ($ million)
Data Table on India - Market size and forecast 2025-2030 ($ million)
Chart on India - Year-over-year growth 2025-2030 (%)
Data Table on India - Year-over-year growth 2025-2030 (%)

12.5.4 South Korea - Market size and forecast 2025-2030

Chart on South Korea - Market size and forecast 2025-2030 ($ million)
Data Table on South Korea - Market size and forecast 2025-2030 ($ million)
Chart on South Korea - Year-over-year growth 2025-2030 (%)
Data Table on South Korea - Year-over-year growth 2025-2030 (%)

12.5.5 Australia - Market size and forecast 2025-2030

Chart on Australia - Market size and forecast 2025-2030 ($ million)
Data Table on Australia - Market size and forecast 2025-2030 ($ million)
Chart on Australia - Year-over-year growth 2025-2030 (%)
Data Table on Australia - Year-over-year growth 2025-2030 (%)

12.5.6 Indonesia - Market size and forecast 2025-2030

Chart on Indonesia - Market size and forecast 2025-2030 ($ million)
Data Table on Indonesia - Market size and forecast 2025-2030 ($ million)
Chart on Indonesia - Year-over-year growth 2025-2030 (%)
Data Table on Indonesia - Year-over-year growth 2025-2030 (%)

12.6 South America - Market size and forecast 2025-2030

Chart on South America - Market size and forecast 2025-2030 ($ million)
Data Table on South America - Market size and forecast 2025-2030 ($ million)
Chart on South America - Year-over-year growth 2025-2030 (%)
Data Table on South America - Year-over-year growth 2025-2030 (%)
Chart on Regional Comparison - South America
Data Table on Regional Comparison - South America

12.6.1 Brazil - Market size and forecast 2025-2030

Chart on Brazil - Market size and forecast 2025-2030 ($ million)
Data Table on Brazil - Market size and forecast 2025-2030 ($ million)
Chart on Brazil - Year-over-year growth 2025-2030 (%)
Data Table on Brazil - Year-over-year growth 2025-2030 (%)

12.6.2 Argentina - Market size and forecast 2025-2030

Chart on Argentina - Market size and forecast 2025-2030 ($ million)
Data Table on Argentina - Market size and forecast 2025-2030 ($ million)
Chart on Argentina - Year-over-year growth 2025-2030 (%)
Data Table on Argentina - Year-over-year growth 2025-2030 (%)

12.6.3 Chile - Market size and forecast 2025-2030

Chart on Chile - Market size and forecast 2025-2030 ($ million)
Data Table on Chile - Market size and forecast 2025-2030 ($ million)
Chart on Chile - Year-over-year growth 2025-2030 (%)
Data Table on Chile - Year-over-year growth 2025-2030 (%)

12.7 Middle East and Africa - Market size and forecast 2025-2030

Chart on Middle East and Africa - Market size and forecast 2025-2030 ($ million)
Data Table on Middle East and Africa - Market size and forecast 2025-2030 ($ million)
Chart on Middle East and Africa - Year-over-year growth 2025-2030 (%)
Data Table on Middle East and Africa - Year-over-year growth 2025-2030 (%)
Chart on Regional Comparison - Middle East and Africa
Data Table on Regional Comparison - Middle East and Africa

12.7.1 Saudi Arabia - Market size and forecast 2025-2030

Chart on Saudi Arabia - Market size and forecast 2025-2030 ($ million)
Data Table on Saudi Arabia - Market size and forecast 2025-2030 ($ million)
Chart on Saudi Arabia - Year-over-year growth 2025-2030 (%)
Data Table on Saudi Arabia - Year-over-year growth 2025-2030 (%)

12.7.2 UAE - Market size and forecast 2025-2030

Chart on UAE - Market size and forecast 2025-2030 ($ million)
Data Table on UAE - Market size and forecast 2025-2030 ($ million)
Chart on UAE - Year-over-year growth 2025-2030 (%)
Data Table on UAE - Year-over-year growth 2025-2030 (%)

12.7.3 South Africa - Market size and forecast 2025-2030

Chart on South Africa - Market size and forecast 2025-2030 ($ million)
Data Table on South Africa - Market size and forecast 2025-2030 ($ million)
Chart on South Africa - Year-over-year growth 2025-2030 (%)
Data Table on South Africa - Year-over-year growth 2025-2030 (%)

12.7.4 Egypt - Market size and forecast 2025-2030

Chart on Egypt - Market size and forecast 2025-2030 ($ million)
Data Table on Egypt - Market size and forecast 2025-2030 ($ million)
Chart on Egypt - Year-over-year growth 2025-2030 (%)
Data Table on Egypt - Year-over-year growth 2025-2030 (%)

12.7.5 Israel - Market size and forecast 2025-2030

Chart on Israel - Market size and forecast 2025-2030 ($ million)
Data Table on Israel - Market size and forecast 2025-2030 ($ million)
Chart on Israel - Year-over-year growth 2025-2030 (%)
Data Table on Israel - Year-over-year growth 2025-2030 (%)

12.8 Market opportunity by geography

Market opportunity by geography ($ million)
Data Tables on Market opportunity by geography ($ million)

13. Drivers, Challenges, and Opportunity

13.1 Market drivers

Expanding medical infrastructure and inpatient admissions
Mandates governing biohazardous waste segregation and disposal
Adoption of technological innovations in digital tracking systems

13.2 Market challenges

High capital expenditure and operational costs
Complex segregation practices and inadequate workforce training
Stringent, fragmented and environmental regulations across jurisdictions

13.3 Impact of drivers and challenges

Impact of drivers and challenges in 2025 and 2030

13.4 Market opportunities

Integration of automated treatment technologies
Transition toward decarbonized non-thermal disposal methodologies
Implementation of digital traceability systems and logistics tracking

14. Competitive Landscape

14.1 Overview

14.2

Overview on criticality of inputs and factors of differentiation

14.3 Landscape disruption

Overview on factors of disruption

14.4 Industry risks

Impact of key risks on business

15. Competitive Analysis

15.1 Companies profiled

Companies covered

15.2 Company ranking index

15.3 Market positioning of companies

Matrix on companies position and classification

15.4 Averda

Averda - Overview
Averda - Product / Service
Averda - Key offerings
SWOT

15.5 BERTIN MEDICAL WASTE

BERTIN MEDICAL WASTE - Overview
BERTIN MEDICAL WASTE - Product / Service
BERTIN MEDICAL WASTE - Key offerings
SWOT

15.6 BioMedical Waste Solutions LLC

BioMedical Waste Solutions LLC - Overview
BioMedical Waste Solutions LLC - Product / Service
BioMedical Waste Solutions LLC - Key offerings
SWOT

15.7 Biotic Waste Ltd.

Biotic Waste Ltd. - Overview
Biotic Waste Ltd. - Product / Service
Biotic Waste Ltd. - Key offerings
SWOT

15.8 Casella Waste Systems Inc.

Casella Waste Systems Inc. - Overview
Casella Waste Systems Inc. - Business segments
Casella Waste Systems Inc. - Key offerings
Casella Waste Systems Inc. - Segment focus
SWOT

15.9 Clean Harbors Inc.

Clean Harbors Inc. - Overview
Clean Harbors Inc. - Business segments
Clean Harbors Inc. - Key news
Clean Harbors Inc. - Key offerings
Clean Harbors Inc. - Segment focus
SWOT

15.10 Cleanaway Waste Management Ltd.

Cleanaway Waste Management Ltd. - Overview
Cleanaway Waste Management Ltd. - Business segments
Cleanaway Waste Management Ltd. - Key offerings
Cleanaway Waste Management Ltd. - Segment focus
SWOT

15.11 Grupo Tradebe Medioambiente SL

Grupo Tradebe Medioambiente SL - Overview
Grupo Tradebe Medioambiente SL - Product / Service
Grupo Tradebe Medioambiente SL - Key offerings
SWOT

15.12 Remondis SE and Co. KG

Remondis SE and Co. KG - Overview
Remondis SE and Co. KG - Product / Service
Remondis SE and Co. KG - Key offerings
SWOT

15.13 Rentokil Initial Plc

Rentokil Initial Plc - Overview
Rentokil Initial Plc - Business segments
Rentokil Initial Plc - Key offerings
Rentokil Initial Plc - Segment focus
SWOT

15.14 Republic Services Inc.

Republic Services Inc. - Overview
Republic Services Inc. - Business segments
Republic Services Inc. - Key news
Republic Services Inc. - Key offerings
Republic Services Inc. - Segment focus
SWOT

15.15 SUEZ SA

SUEZ SA - Overview
SUEZ SA - Product / Service
SUEZ SA - Key offerings
SWOT

15.16 Triumvirate Environmental

Triumvirate Environmental - Overview
Triumvirate Environmental - Product / Service
Triumvirate Environmental - Key offerings
SWOT

15.17 Veolia Environment SA

Veolia Environment SA - Overview
Veolia Environment SA - Business segments
Veolia Environment SA - Key news
Veolia Environment SA - Key offerings
Veolia Environment SA - Segment focus
SWOT

15.18 Waste Management Inc.

Waste Management Inc. - Overview
Waste Management Inc. - Business segments
Waste Management Inc. - Key news
Waste Management Inc. - Key offerings
Waste Management Inc. - Segment focus
SWOT

16. Appendix

16.1 Scope of the report

Market definition
Objectives
Notes and caveats

16.2 Inclusions and exclusions checklist

Inclusions checklist
Exclusions checklist

16.3 Currency conversion rates for US$

16.4 Research methodology

16.5 Data procurement

Information sources

16.6 Data validation

16.7 Validation techniques employed for market sizing

16.8 Data synthesis

16.9 360 degree market analysis

16.10 List of abbreviations

Research Methodology

Technavio presents a detailed picture of the market by way of study, synthesis, and summation of data from multiple sources. The analysts have presented the various facets of the market with a particular focus on identifying the key industry influencers. The data thus presented is comprehensive, reliable, and the result of extensive research, both primary and secondary.

INFORMATION SOURCES

Primary sources

  • Manufacturers and suppliers
  • Channel partners
  • Industry experts
  • Strategic decision makers

Secondary sources

  • Industry journals and periodicals
  • Government data
  • Financial reports of key industry players
  • Historical data
  • Press releases

DATA ANALYSIS

Data Synthesis

  • Collation of data
  • Estimation of key figures
  • Analysis of derived insights

Data Validation

  • Triangulation with data models
  • Reference against proprietary databases
  • Corroboration with industry experts

REPORT WRITING

Qualitative

  • Market drivers
  • Market challenges
  • Market trends
  • Five forces analysis

Quantitative

  • Market size and forecast
  • Market segmentation
  • Geographical insights
  • Competitive landscape

Interested in this report?

Get your sample now to see our research methodology and insights!

Download Now

Frequently Asked Questions

Medical Waste Management market growth will increase by USD 4257.5 million during 2026-2030.

The Medical Waste Management market is expected to grow at a CAGR of 6% during 2026-2030.

Medical Waste Management market is segmented by Type (Non-hazardous, Hazardous) Technique (Offsite treatment, Onsite treatment) Service (Collection and transportation, Treatment and disposal, Recycling, Others)

Averda, BERTIN MEDICAL WASTE, BioMedical Waste Solutions LLC, Biotic Waste Ltd., Casella Waste Systems Inc., Clean Harbors Inc., Cleanaway Waste Management Ltd., Daniels Health, GIC Medical Disposal Inc., Grupo Tradebe Medioambiente SL, MEDPRO Disposal LLC, Mumbai Waste Management Ltd., Passco Environmental Solutions, Remondis SE and Co. KG, Rentokil Initial Plc, Republic Services Inc., Stericycle Inc., SUEZ SA, Triumvirate Environmental, Veolia Environment SA, Waste Management Inc. are a few of the key vendors in the Medical Waste Management market.

North America will register the highest growth rate of 36.5% among the other regions. Therefore, the Medical Waste Management market in North America is expected to garner significant business opportunities for the vendors during the forecast period.

US, Canada, Mexico, Germany, UK, France, Italy, Spain, The Netherlands, China, Japan, India, South Korea, Australia, Indonesia, Brazil, Argentina, Chile, Saudi Arabia, UAE, South Africa, Egypt, Israel

  • Expanding medical infrastructure and inpatient admissions is the driving factor this market.

The Medical Waste Management market vendors should focus on grabbing business opportunities from the Type segment as it accounted for the largest market share in the base year.
RIA - Research AI Assistant
Ask RIA
