Smart Waste Management Market Size 2026-2030
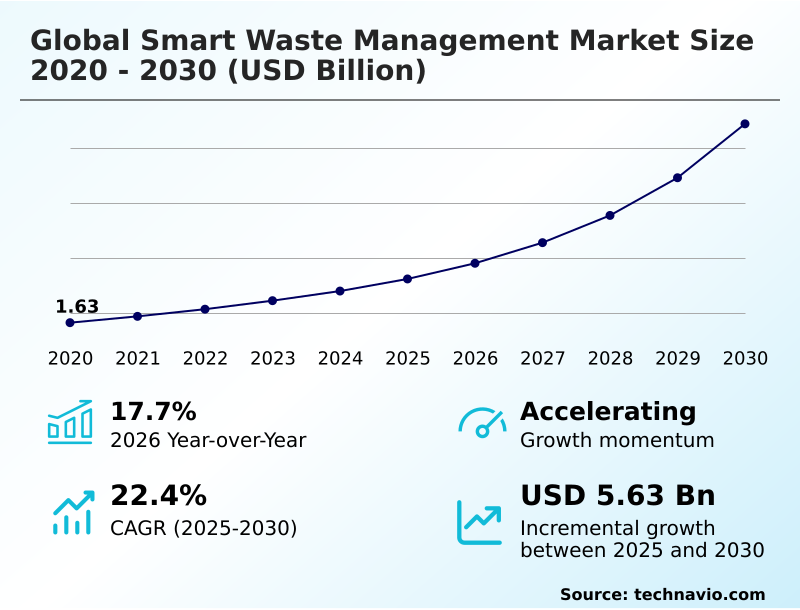
The smart waste management market size is valued to increase by USD 5.63 billion, at a CAGR of 22.4% from 2025 to 2030. Proliferation of AI-native autonomous sorting and predictive fleet optimization will drive the smart waste management market.
Major Market Trends & Insights
- North America dominated the market and accounted for a 34.4% growth during the forecast period.
- By Application - Collection segment was valued at USD 1.77 billion in 2024
- By Type - Solid waste segment accounted for the largest market revenue share in 2024
Market Size & Forecast
- Market Opportunities: USD 7.23 billion
- Market Future Opportunities: USD 5.63 billion
- CAGR from 2025 to 2030 : 22.4%
Market Summary
- The smart waste management market is shifting from labor-intensive models to data-centric ecosystems, driven by the need to manage increasing waste volumes in urban centers. This evolution is underpinned by the integration of advanced digital technologies to optimize collection, transport, and processing.
- For instance, a municipality can leverage real-time data from sensor-equipped bins to transition from fixed schedules to dynamic, on-demand collection routes, reducing fleet mileage and operational costs. This data-driven approach not only enhances logistical efficiency but also supports broader circular economy goals by improving the quality of materials sent for recycling.
- The market is characterized by innovations in automated sorting, where robotics and computer vision increase the precision and speed of separating waste streams. Concurrently, regulatory pressures for greater transparency and environmental accountability compel organizations to adopt platforms that provide verifiable data on waste diversion and regulatory compliance, solidifying the role of technology as a critical component of modern sanitation infrastructure.
What will be the Size of the Smart Waste Management Market during the forecast period?
Get Key Insights on Market Forecast (PDF) Get Free Sample
How is the Smart Waste Management Market Segmented?
The smart waste management industry research report provides comprehensive data (region-wise segment analysis), with forecasts and estimates in "USD million" for the period 2026-2030, as well as historical data from 2020-2024 for the following segments.
- Application
- Collection
- Landfill
- Recovery and recycling
- Processing
- Type
- Solid waste
- Special waste
- E-waste
- Component
- Hardware
- Software
- Services
- Geography
- North America
- US
- Canada
- Mexico
- Europe
- Germany
- UK
- France
- APAC
- China
- Japan
- India
- South America
- Brazil
- Argentina
- Middle East and Africa
- South Africa
- Saudi Arabia
- UAE
- Rest of World (ROW)
- North America
By Application Insights
The collection segment is estimated to witness significant growth during the forecast period.
The market is segmented by application, with Collection being the largest. This segment has evolved beyond simple transport to become the foundation for real-time monitoring of waste streams.
The integration of ultrasonic fill-level sensors into renewable energy compacting bins facilitates a shift to dynamic logistics, governed by dynamic route optimization algorithms. This data-centric approach to waste stream lifecycle management directly supports circular economy mandates compliance, enabling zero-waste-to-landfill targets.
It also provides the foundational data for extended producer responsibility programs. The intelligence gathered here enhances downstream applications, including improving throughput at material recovery facilities for high-purity material recovery and optimizing feedstock for waste-to-energy conversion.
Emerging technologies like the software-defined automation platform and digital product passports are further refining this segment, ensuring comprehensive tracking and compliance.
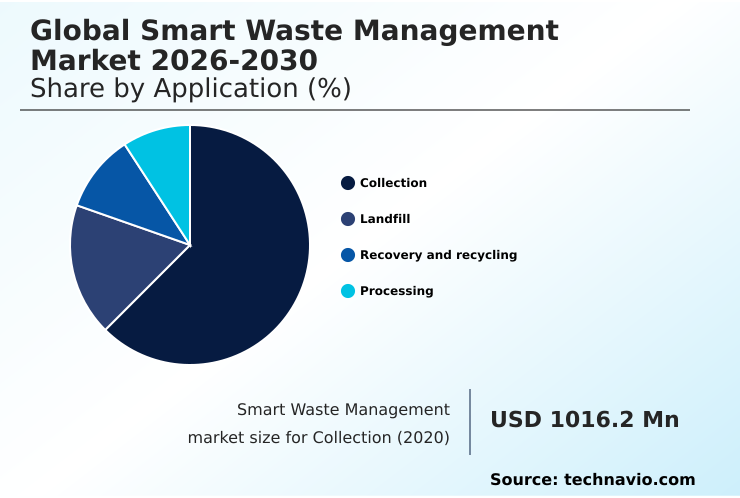
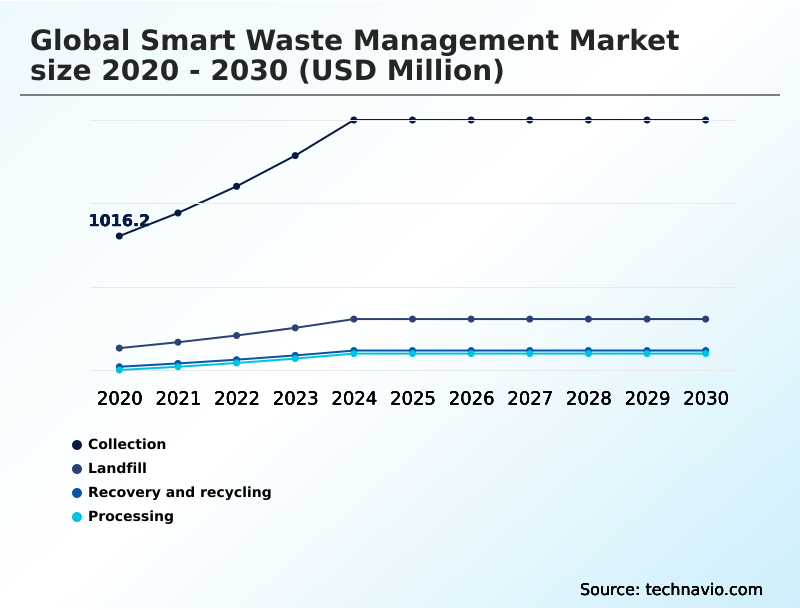
The Collection segment was valued at USD 1.77 billion in 2024 and showed a gradual increase during the forecast period.
Regional Analysis
North America is estimated to contribute 34.4% to the growth of the global market during the forecast period.Technavio’s analysts have elaborately explained the regional trends and drivers that shape the market during the forecast period.
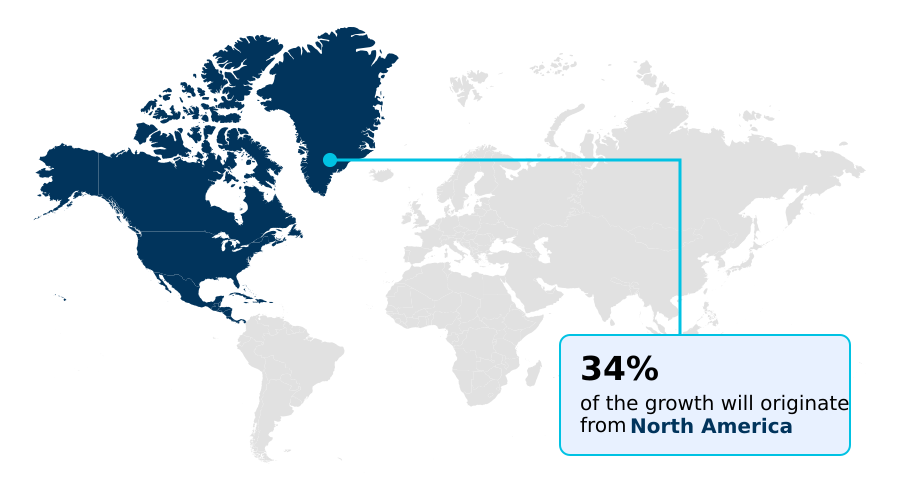
See How Smart Waste Management Market Demand is Rising in North America Get Free Sample
The geographic landscape shows mature adoption in North America and Europe, where pay-as-you-throw billing models utilizing radio-frequency identification tags are common.
These regions leverage GPS tracking modules and sophisticated waste analytics dashboards for municipal solid waste logistics and to provide verifiable waste diversion data for environmental social and governance reporting.
For instance, some European cities have improved urban sanitation service optimization by 30% through predictive analytics. In contrast, APAC is the fastest-growing market, driven by government mandates and investments in high-volume solutions.
This region focuses on advanced machine learning for waste classification and technologies like hydrometallurgical processing and pyrometallurgical processing for e-waste.
Advanced infrastructure, including automated vacuum collection systems for hazardous materials handling protocols, is also being deployed in new smart city projects in the Middle East.
Market Dynamics
Our researchers analyzed the data with 2025 as the base year, along with the key drivers, trends, and challenges. A holistic analysis of drivers will help companies refine their marketing strategies to gain a competitive advantage.
- The smart waste management market is evolving through the strategic implementation of advanced technologies aimed at boosting efficiency and sustainability. The use of an iot sensor for real-time bin fill levels is becoming standard, allowing municipalities to deploy ai-powered route optimization for waste collection, which has been shown to reduce fuel consumption by up to 30% compared to static routes.
- For more complex waste streams, blockchain for transparent hazardous material handling is gaining traction, providing an immutable ledger for compliance. In public spaces, solar-powered compactors for high-density areas reduce collection frequency, while robotic sorting for high-purity material recovery is transforming recycling facilities. The integration of smart weight-based scales on collection vehicles supports pay-as-you-throw systems, incentivizing waste reduction.
- Further innovation is seen with decentralized anaerobic digesters for organic waste and the use of computer vision to identify and sort recyclables. This is complemented by rfid tags for pay-as-you-throw systems and gps tracking to ensure chain of custody for sensitive materials.
- Behind the scenes, cloud platforms for waste analytics dashboards process vast amounts of data, driven by ai algorithms for predictive waste generation. This infrastructure is supported by lorawan for low-power sensor connectivity, enabling real-time monitoring of ph levels in digestion.
- As the industry matures, solutions like software to track circular economy compliance, smart monitoring for landfill gas capture, and automated systems for e-waste disassembly are becoming critical. These telemetry systems in smart city initiatives rely on digital passports for waste stream traceability, fundamentally changing how waste is managed.
What are the key market drivers leading to the rise in the adoption of Smart Waste Management Industry?
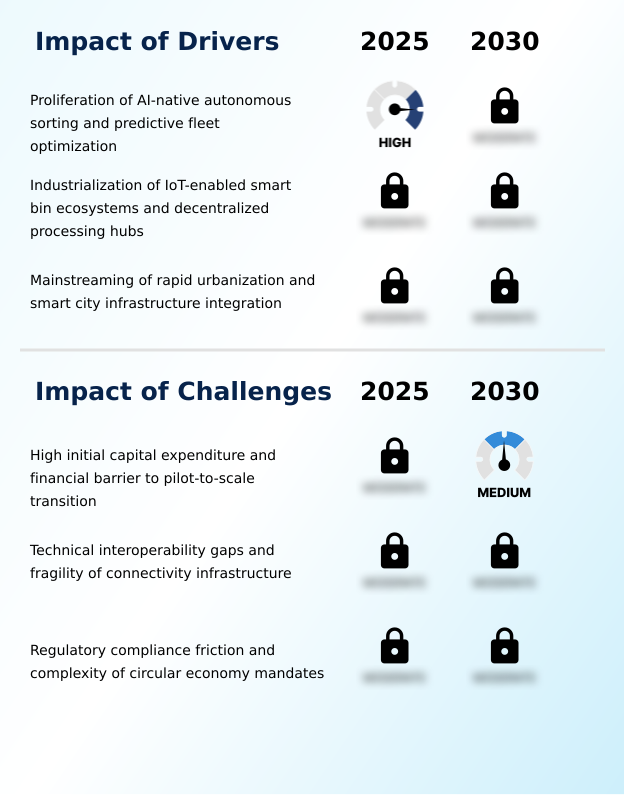
- The proliferation of AI-native autonomous sorting and predictive fleet optimization is a key driver for the market, enhancing material recovery and logistical efficiency.
- Market growth is driven by the industrialization of intelligent infrastructure. The proliferation of IoT-enabled smart bin ecosystems enables data-driven governance in sanitation, allowing operators to monitor bin status from a centralized management dashboard for public health hazard prevention.
- This data feeds into AI-based predictive analytics for predictive fleet optimization, a critical factor for operational expenditure reduction in waste collection. Our analysis shows that dynamic routing can lower fuel use by 25%.
- Concurrently, the use of computer vision for material recovery in autonomous sorting facilities is revolutionizing recycling, improving material purity.
- This deep integration of waste services into broader smart city digital infrastructure integration is also a major driver, alongside the rise of decentralized organic waste processing to manage waste at its source and support carbon footprint mitigation for fleets within unified digital public infrastructure frameworks.
What are the market trends shaping the Smart Waste Management Industry?
- A key market trend is the proliferation of solar-powered compacting smart bins, which are being increasingly deployed in high-density urban hubs. This development addresses logistical challenges and enhances urban sanitation.
- Market trends are centered on resource recovery and operational autonomy. The deployment of solar-powered compacting bins in urban centers can increase capacity by over five times, significantly reducing collection frequency and supporting sustainable urban waste solutions. This move toward self-sustaining hardware is a key part of emerging industrial sustainability strategies.
- Another major trend is the adoption of blockchain for waste traceability, creating digital passports for waste loads to ensure cross-border waste compliance and enforce the polluter pays principle enforcement with verifiable data.
- Furthermore, the shift toward decentralized waste treatment hubs is accelerating, with on-site waste processing systems using modular anaerobic digesters and thermal conversion technologies to convert organic waste into energy at the source. This is often managed through a waste management as a service model, providing real-time waste tracking and optimizing resource loops.
What challenges does the Smart Waste Management Industry face during its growth?
- High initial capital expenditure and financial barriers to transitioning pilot projects to full-scale deployment present a key challenge affecting widespread industry growth.
- Key challenges hinder widespread adoption, primarily the high initial cost of hardware like automated sorting robotics and multi-modal sensor arrays. A significant technical barrier is achieving truly interoperable digital ecosystems, as integrating hardware from multiple vendors is complicated by fragmented standards for low-power wide-area network connectivity.
- While cloud-native architectures and open application programming interfaces offer flexibility, ensuring system-wide security is paramount. The risk of service disruption from failures in cybersecurity for municipal networks is substantial, with some pilot programs reporting up to a 15% data loss from connectivity gaps. Moreover, implementing robust end-to-end encryption for IoT adds complexity.
- These issues can impede the establishment of resilient and distributed infrastructure needed for effective demand-driven logistics for collection and specialized processes like e-waste recycling and recovery, which rely on transparent waste tracking platforms for high-purity material recovery.
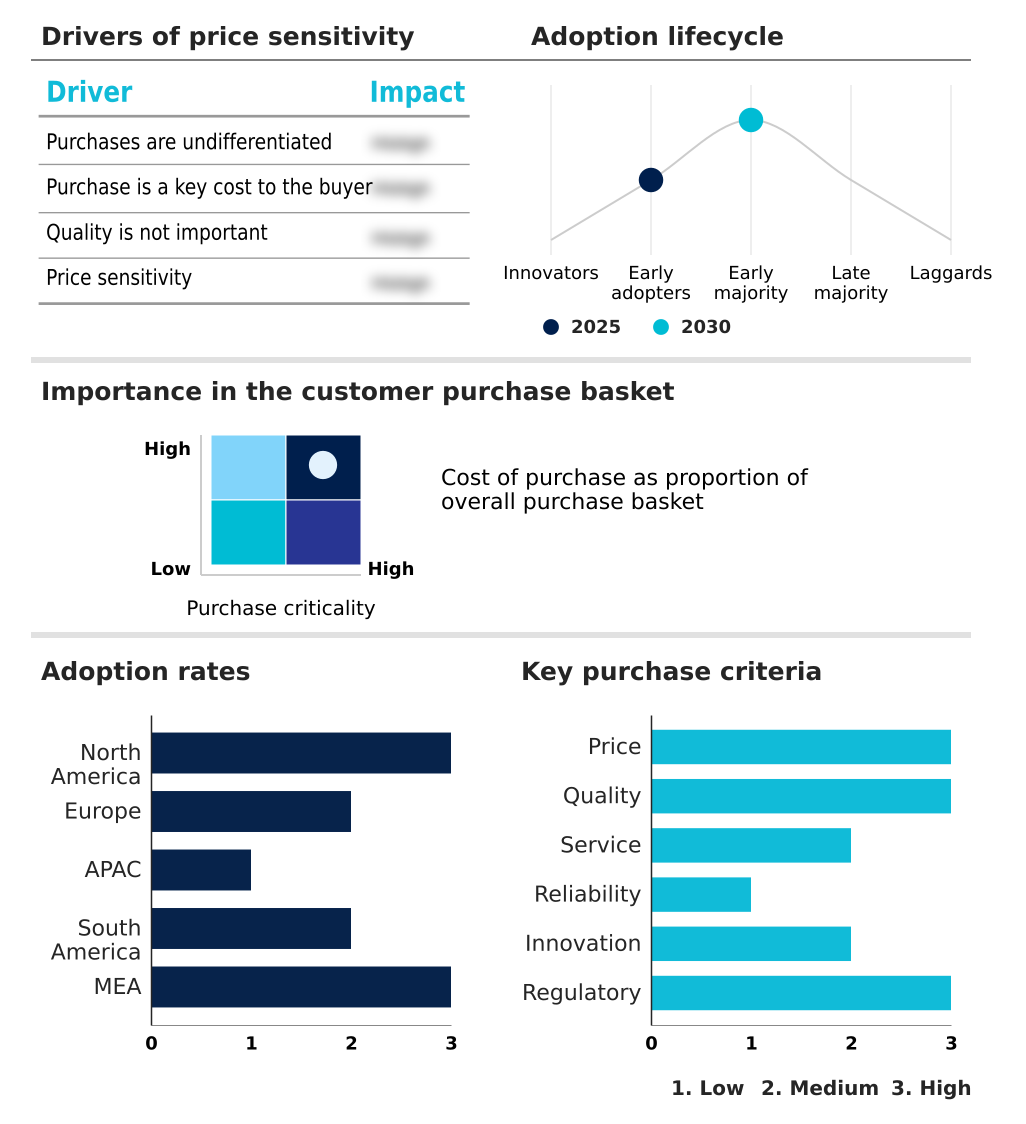
Exclusive Technavio Analysis on Customer Landscape
The smart waste management market forecasting report includes the adoption lifecycle of the market, covering from the innovator’s stage to the laggard’s stage. It focuses on adoption rates in different regions based on penetration. Furthermore, the smart waste management market report also includes key purchase criteria and drivers of price sensitivity to help companies evaluate and develop their market growth analysis strategies.
Customer Landscape of Smart Waste Management Industry
Competitive Landscape
Companies are implementing various strategies, such as strategic alliances, smart waste management market forecast, partnerships, mergers and acquisitions, geographical expansion, and product/service launches, to enhance their presence in the industry.
Aco Recycling - Key offerings focus on innovative environmental solutions, developing and integrating advanced technology to enhance sustainable smart waste management practices and operational efficiency.
The industry research and growth report includes detailed analyses of the competitive landscape of the market and information about key companies, including:
- Aco Recycling
- Arya Omnitalk Wireless Solution
- Big Belly Solar LLC.
- Bine sp. z o. o.
- BRE Group
- Covanta Holding Corp.
- Ecube Labs Co. Ltd.
- Enevo Inc.
- Evreka
- Kantor Waste4Change
- Mr. Fill B.V.
- Nordsense
- Pepperl and Fuchs SE
- Republic Services Inc.
- Saahas Waste Management Pvt Ltd
- SENSONEO j. s. a.
- SUEZ SA
- Veolia Environment SA
- Waste Harmonics LLC
- Waste Management Inc.
Qualitative and quantitative analysis of companies has been conducted to help clients understand the wider business environment as well as the strengths and weaknesses of key industry players. Data is qualitatively analyzed to categorize companies as pure play, category-focused, industry-focused, and diversified; it is quantitatively analyzed to categorize companies as dominant, leading, strong, tentative, and weak.
Recent Development and News in Smart waste management market
- In September 2024, Hauler Hero, an integrated technology provider, announced a USD 16 million Series A funding round to accelerate the development of its all-in-one AI-powered waste management operating system, aiming to unify billing, routing, and customer engagement.
- In October 2024, ABB Limited introduced the ABB Ability BuildingPro platform, which integrates cybersecure hardware modules designed to unify waste data across commercial and healthcare sectors, reflecting a move toward standardized, multi-sector sensor infrastructure.
- In January 2025, Schneider Electric launched its EcoStruxure Foxboro Software Defined Automation platform, which is being integrated into specialized waste processing plants to improve the redundancy and safety of hazardous material treatment cycles.
- In April 2025, The Dubai Municipality launched a major initiative under its long-term waste management strategy, utilizing digital platforms and smart collection systems to divert municipal waste from landfills through advanced recycling and energy recovery.
Dive into Technavio’s robust research methodology, blending expert interviews, extensive data synthesis, and validated models for unparalleled Smart Waste Management Market insights. See full methodology.
| Market Scope | |
|---|---|
| Page number | 293 |
| Base year | 2025 |
| Historic period | 2020-2024 |
| Forecast period | 2026-2030 |
| Growth momentum & CAGR | Accelerate at a CAGR of 22.4% |
| Market growth 2026-2030 | USD 5633.6 million |
| Market structure | Fragmented |
| YoY growth 2025-2026(%) | 17.7% |
| Key countries | US, Canada, Mexico, Germany, UK, France, Italy, Spain, The Netherlands, China, Japan, India, South Korea, Australia, Indonesia, Brazil, Argentina, Chile, South Africa, Saudi Arabia, UAE, Nigeria and Egypt |
| Competitive landscape | Leading Companies, Market Positioning of Companies, Competitive Strategies, and Industry Risks |
Research Analyst Overview
- The market's evolution is defined by a convergence of hardware and software designed to create intelligent, responsive sanitation systems. Core to this are IoT-enabled smart bin ecosystems, which utilize ultrasonic fill-level sensors and multi-modal sensor arrays on solar-powered compacting bins and renewable energy compacting bins to enable real-time waste tracking.
- This data, often transmitted via low-power wide-area network technologies, feeds into waste analytics dashboards on a centralized management dashboard. Boardroom decisions are now heavily influenced by AI-based predictive analytics, which powers dynamic route optimization algorithms for predictive fleet optimization, with some operators achieving a 20% reduction in collection costs.
- This software layer often relies on cloud-native architectures and open application programming interfaces. Physical processing is also transforming, with autonomous sorting facilities deploying automated sorting robotics enhanced by computer vision for material recovery and machine learning for waste classification. This improves throughput at material recovery facilities and optimizes feedstock for waste-to-energy conversion.
- For specialized streams, on-site waste processing systems with modular anaerobic digesters, thermal conversion technologies, and even automated vacuum collection systems are becoming common. Technologies like radio-frequency identification tags, GPS tracking modules, and blockchain for waste traceability create digital passports for waste loads and digital product passports, ensuring compliance. For e-waste, advanced hydrometallurgical processing and pyrometallurgical processing are critical.
- This entire framework is secured by a software-defined automation platform with end-to-end encryption for IoT to protect against threats to cybersecurity for municipal networks.
What are the Key Data Covered in this Smart Waste Management Market Research and Growth Report?
-
What is the expected growth of the Smart Waste Management Market between 2026 and 2030?
-
USD 5.63 billion, at a CAGR of 22.4%
-
-
What segmentation does the market report cover?
-
The report is segmented by Application (Collection, Landfill, Recovery and recycling, and Processing), Type (Solid waste, Special waste, and E-waste), Component (Hardware, Software, and Services) and Geography (North America, Europe, APAC, South America, Middle East and Africa)
-
-
Which regions are analyzed in the report?
-
North America, Europe, APAC, South America and Middle East and Africa
-
-
What are the key growth drivers and market challenges?
-
Proliferation of AI-native autonomous sorting and predictive fleet optimization, High initial capital expenditure and financial barrier to pilot-to-scale transition
-
-
Who are the major players in the Smart Waste Management Market?
-
Aco Recycling, Arya Omnitalk Wireless Solution, Big Belly Solar LLC., Bine sp. z o. o., BRE Group, Covanta Holding Corp., Ecube Labs Co. Ltd., Enevo Inc., Evreka, Kantor Waste4Change, Mr. Fill B.V., Nordsense, Pepperl and Fuchs SE, Republic Services Inc., Saahas Waste Management Pvt Ltd, SENSONEO j. s. a., SUEZ SA, Veolia Environment SA, Waste Harmonics LLC and Waste Management Inc.
-
Market Research Insights
- The market is defined by a strategic push toward data-driven governance in sanitation, where technology drives efficiency. Successful deployments show over a 20% operational expenditure reduction in waste collection through optimized routing. The integration of waste services into smart city digital infrastructure is becoming standard, moving beyond isolated pilots. This supports corporate zero-waste-to-landfill targets and ensures circular economy mandates compliance.
- Technologies enabling pay-as-you-throw billing models have increased household recycling rates by up to 15% in certain municipalities. Providing verifiable waste diversion data is no longer optional but a core component of transparent operations, strengthening environmental reporting and stakeholder trust.
We can help! Our analysts can customize this smart waste management market research report to meet your requirements.
 RIA -
RIA - 
