Memory Ics Market Analysis, Size, and Forecast 2026-2030: APAC (China, Japan, and South Korea), North America (US, Canada, and Mexico), Europe (Germany, France, and UK), Middle East and Africa (Saudi Arabia, UAE, and South Africa), South America (Brazil, Argentina, and Colombia), and Rest of World (ROW)

Memory Ics Market Analysis, Size, and Forecast 2026-2030:
APAC (China, Japan, and South Korea), North America (US, Canada, and Mexico), Europe (Germany, France, and UK), Middle East and Africa (Saudi Arabia, UAE, and South Africa), South America (Brazil, Argentina, and Colombia), and Rest of World (ROW)

Published: Mar 2026 317 Pages SKU: IRTNTR81294

Market Overview at a Glance

$117.92 B
Market Opportunity
10.6%
CAGR 2025 - 2030
59.6%
APAC Growth
$91.34 B
Volatile memory segment 2024

Memory Ics Market Size 2026-2030

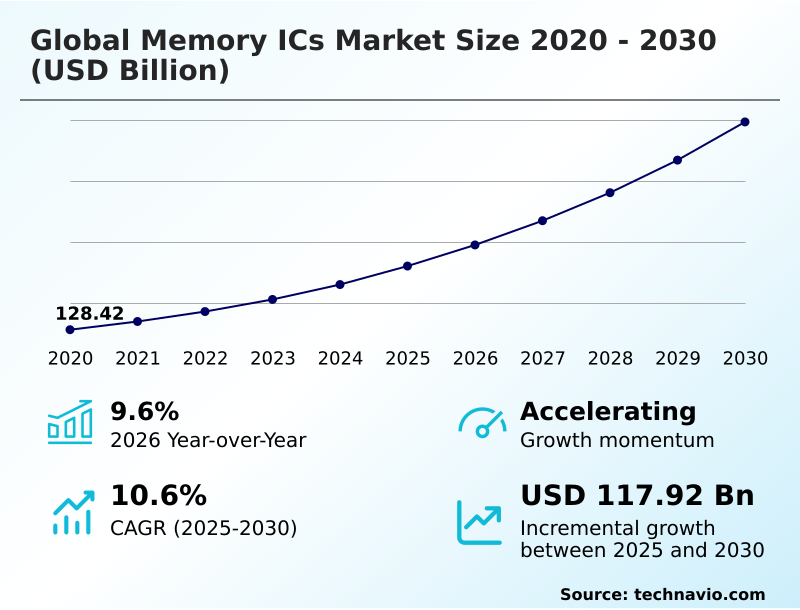
The memory ics market size is valued to increase by USD 117.92 billion, at a CAGR of 10.6% from 2025 to 2030. Proliferation of high-performance computing and AI will drive the memory ics market.

Major Market Trends & Insights

  • APAC dominated the market and accounted for a 59.6% growth during the forecast period.
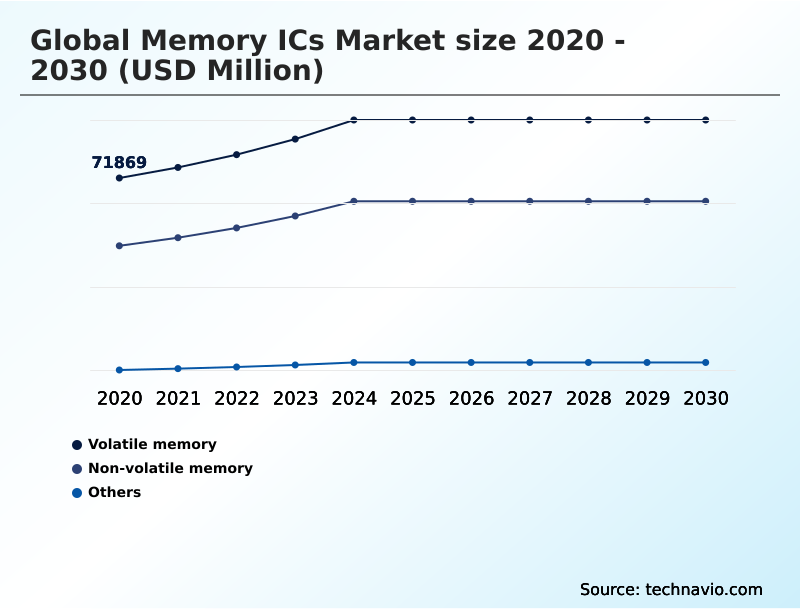
  • By Type - Volatile memory segment was valued at USD 91.34 billion in 2024
  • By End-user - Consumer electronics segment accounted for the largest market revenue share in 2024

Market Size & Forecast

  • Market Opportunities: USD 170.00 billion
  • Market Future Opportunities: USD 117.92 billion
  • CAGR from 2025 to 2030 : 10.6%

Market Summary

  • The memory ICs market is undergoing a critical transformation, driven by the insatiable data demands of artificial intelligence and cloud computing. The necessity for high bandwidth memory (HBM) and faster dynamic random access memory (DRAM) is reshaping data center architectures and influencing enterprise capital expenditure.
  • In a typical business scenario, a financial services firm can leverage memory-centric infrastructure to reduce latency in high-frequency trading algorithms, gaining a competitive edge. However, the industry grapples with the immense costs and technical complexities of scaling manufacturing processes, such as the move to extreme ultraviolet lithography.
  • Geopolitical factors also introduce significant supply chain risks, compelling a strategic re-evaluation of global fabrication footprints. Simultaneously, the automotive sector's shift toward autonomous systems creates a new, high-growth vertical that demands automotive-grade memory components with exceptional reliability and endurance.
  • The ongoing trend of disaggregating memory using protocols like Compute Express Link (CXL) further signals a shift toward more flexible and efficient hardware utilization, balancing performance with total cost of ownership.

What will be the Size of the Memory Ics Market during the forecast period?

Get Key Insights on Market Forecast (PDF) Request Free Sample

How is the Memory Ics Market Segmented?

The memory ics industry research report provides comprehensive data (region-wise segment analysis), with forecasts and estimates in "USD million" for the period 2026-2030, as well as historical data from 2020-2024 for the following segments.

  • Type
    • Volatile memory
    • Non-volatile memory
    • Others
  • End-user
    • Consumer electronics
    • IT and telecommunication
    • Automotive
    • Healthcare
    • Others
  • Application
    • Smartphone and tablets
    • Data centers and servers
    • Automotive electronics
    • Industrial electronics
    • Others
  • Geography
    • APAC
      • China
      • Japan
      • South Korea
    • North America
      • US
      • Canada
      • Mexico
    • Europe
      • Germany
      • France
      • UK
    • Middle East and Africa
      • Saudi Arabia
      • UAE
      • South Africa
    • South America
      • Brazil
      • Argentina
      • Colombia
    • Rest of World (ROW)

By Type Insights

The volatile memory segment is estimated to witness significant growth during the forecast period.

Volatile memory, which requires continuous power to retain data, is a primary pillar of the memory ICs market.

This segment, featuring dynamic random access memory (DRAM) and high bandwidth memory (HBM), is essential for high-performance computing (HPC) and artificial intelligence frameworks where low-latency performance is critical.

The industry-wide transition to Double Data Rate 5 (DDR5) standards reflects a commitment to enhancing both bandwidth and power efficiency, with the new architecture delivering up to a 50% increase in data transfer rates over its predecessor.

The adoption of advanced packaging techniques and system-on-chip (SoC) integration supports the escalating computational workloads in hyperscale data centers. This evolution addresses the memory bandwidth bottleneck, ensuring that processing power and data accessibility remain synchronized in modern computing environments.

Request Free Sample

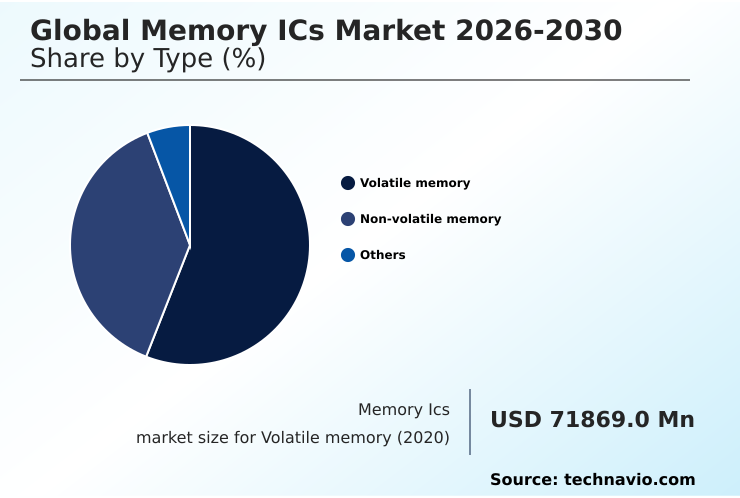
The Volatile memory segment was valued at USD 91.34 billion in 2024 and showed a gradual increase during the forecast period.

Request Free Sample

Regional Analysis

APAC is estimated to contribute 59.6% to the growth of the global market during the forecast period.Technavio’s analysts have elaborately explained the regional trends and drivers that shape the market during the forecast period.

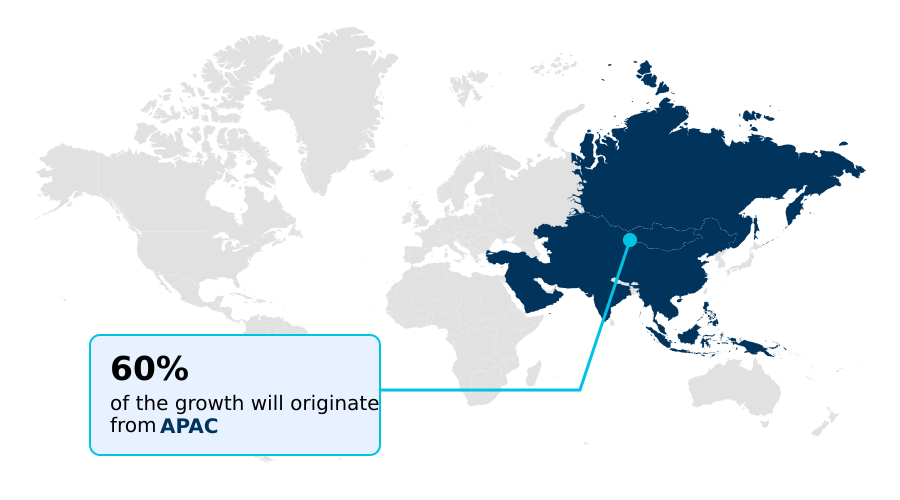
See How Memory Ics Market Demand is Rising in APAC Request Free Sample

The geographic landscape of the memory ICs market is dominated by the APAC region, which accounts for nearly 60% of the market's incremental growth and serves as the primary hub for semiconductor fabrication facilities.

This concentration is driven by massive investments in wafer fabrication processes and advanced packaging techniques. North America remains a critical design and consumption hub, home to major hyperscale data centers and designers of high-end encryption-ready memory for enterprise applications.

In Europe, the focus is on automotive grade memory and embedded memory solutions for the Industrial Internet of Things (IIoT), supported by government initiatives to bolster local production.

The technical pursuit of storage density enhancement continues globally, with new architectures enabling a 15% improvement in data retention and endurance, a key factor for software-defined storage deployments in mission-critical systems.

Market Dynamics

Our researchers analyzed the data with 2025 as the base year, along with the key drivers, trends, and challenges. A holistic analysis of drivers will help companies refine their marketing strategies to gain a competitive advantage.

  • Strategic planning within the global memory ICs market 2026-2030 now requires a deep understanding of evolving technological benchmarks and use-case-specific demands. Decision-makers are constantly evaluating ddr5 vs ddr4 performance benchmarks to justify infrastructure upgrades, while mobile device manufacturers focus on lpddr5x power consumption advantages to extend battery life.
  • For server architects, the key question is how to leverage cxl for memory expansion modules to build more flexible systems. The feasibility of these advancements hinges on resolving 3d nand vertical scaling challenges and optimizing hbm for ai training workloads. Furthermore, ensuring compliance with automotive grade memory reliability standards is non-negotiable for vehicle systems.
  • The selection of an nvme ssd for data centers depends on balancing performance with enterprise ssd endurance ratings. In parallel, the growth of the IoT is fueled by edge computing low power memory and non-volatile memory for iot devices. The industry's ability to innovate is tied to mastering euv lithography in dram production and exploring mram as a sram replacement.
  • For storage solutions, qlc nand adoption in consumer ssds is a key cost-reduction strategy. The demand for volatile memory in high-performance computing is balanced by the need for embedded flash for microcontrollers. Data retention in automotive electronics and reducing latency with cxl memory are critical for safety and performance.
  • Finally, the use of stacked dram for graphics cards and the development of phase change memory for storage-class memory are redefining performance expectations, forcing businesses to analyze twice as many supply chain variables for strategic sourcing.

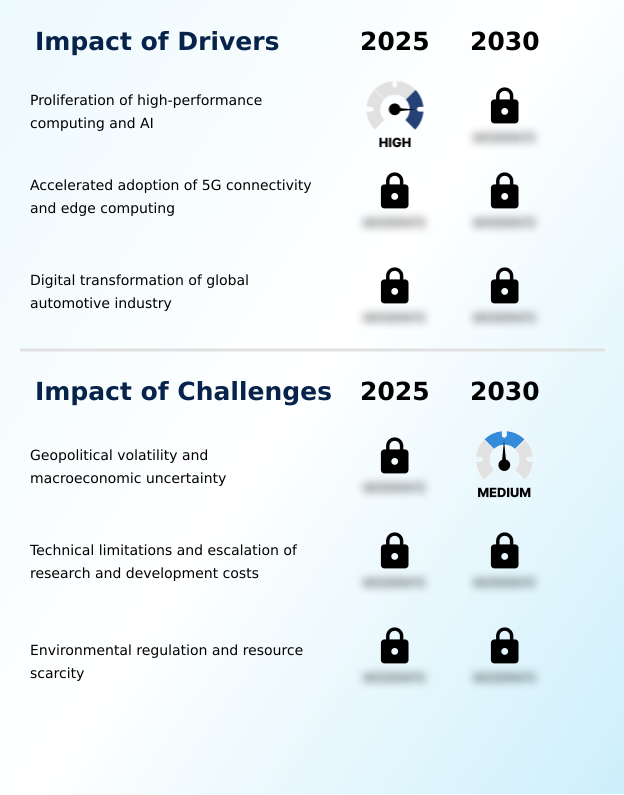
What are the key market drivers leading to the rise in the adoption of Memory Ics Industry?

  • The proliferation of high-performance computing and artificial intelligence is the key driver propelling market growth.

  • Market growth is primarily propelled by the data-intensive requirements of next-generation applications.
  • The proliferation of AI and high-performance computing (HPC) has created an insatiable demand for high bandwidth memory (HBM), with AI training workloads requiring memory capacities that are over 5 times larger than traditional server configurations.
  • In the automotive sector, the rise of software-defined vehicles equipped with advanced driver-assistance systems (ADAS) is a major driver; these systems can generate over 1 terabyte of data per hour, necessitating robust volatile memory and solid state storage.
  • The expansion of 5G and the Industrial Internet of Things (IIoT) further fuels demand for low power double data rate (LPDDR) memory in edge computing environments, enabling localized data processing and real-time analytics for improved operational efficiency.

What are the market trends shaping the Memory Ics Industry?

  • The strategic migration toward DDR5 and LPDDR5X architectures is a significant upcoming market trend, driven by the escalating demands of global computing ecosystems.

  • Key market trends are centered on architectural innovations that address escalating data demands. The adoption of Compute Express Link (CXL) is pivotal, enabling disaggregated memory architectures that can improve hardware utilization in data centers by over 30%. This shift facilitates memory pooling, significantly enhancing the efficiency of heterogeneous computing environments.
  • Concurrently, the relentless scaling of 3D NAND flash memory, now surpassing 300 layers, drives storage density enhancement. This vertical integration allows manufacturers to increase capacity for enterprise-grade solid-state drives and consumer devices. The transition to DDR5 memory is also critical, doubling the effective bandwidth compared to previous generations, which directly benefits next-generation sequencing and other data-intensive applications.
  • These advancements are supported by hybrid bonding technology and the exploration of novel materials like Ferroelectric RAM (FeRAM).

What challenges does the Memory Ics Industry face during its growth?

  • Geopolitical volatility and macroeconomic uncertainty constitute a key challenge affecting the industry's growth trajectory.

  • The memory ICs market confronts significant headwinds from both geopolitical and technical fronts. Geopolitical supply chain risk, stemming from regional manufacturing concentration, creates volatility and forces costly diversification strategies.
  • The capital expenditure intensity required for a new semiconductor fabrication facility has increased by over 200% in the last decade, with extreme ultraviolet lithography (EUV) systems representing a substantial portion of this cost. At the technical level, engineers face challenges with process node shrinkage, including quantum tunneling effects that impact data integrity.
  • Resource-intensive fabrication, which consumes millions of gallons of water daily, is also under scrutiny, with water usage at leading fabs increasing by 15% year-over-year. Overcoming these hurdles while maintaining high-yield manufacturing and achieving circular economy principles remains a primary strategic focus.

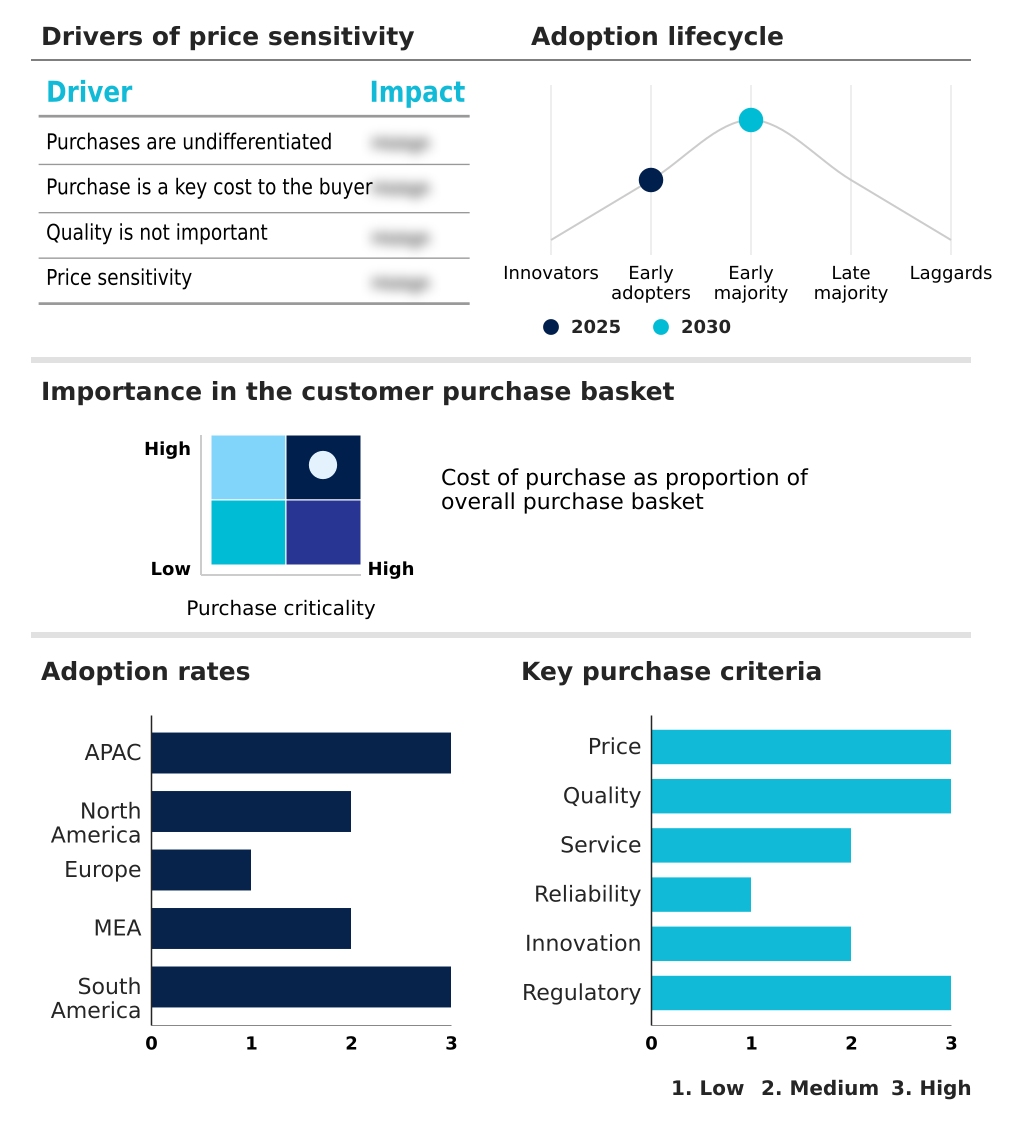
Exclusive Technavio Analysis on Customer Landscape

The memory ics market forecasting report includes the adoption lifecycle of the market, covering from the innovator’s stage to the laggard’s stage. It focuses on adoption rates in different regions based on penetration. Furthermore, the memory ics market report also includes key purchase criteria and drivers of price sensitivity to help companies evaluate and develop their market growth analysis strategies.

Customer Landscape of Memory Ics Industry

Competitive Landscape

Companies are implementing various strategies, such as strategic alliances, memory ics market forecast, partnerships, mergers and acquisitions, geographical expansion, and product/service launches, to enhance their presence in the industry.

Analog Devices Inc. - Specialized non-volatile memory solutions are engineered for high-reliability industrial and aerospace applications, focusing on data integrity in demanding operational environments.

The industry research and growth report includes detailed analyses of the competitive landscape of the market and information about key companies, including:

  • Analog Devices Inc.
  • Changxin Technology Group Co. Ltd
  • Fujitsu Ltd.
  • GigaDevice Semiconductor Inc
  • Infineon Technologies AG
  • Integrated Silicon Solution Inc
  • Kioxia Corp.
  • Macronix International Co Ltd
  • Microchip Technology Inc.
  • Micron Technology Inc.
  • ON Semiconductor Corp.
  • Renesas Electronics Corp.
  • ROHM Co. Ltd.
  • Samsung Electronics Co. Ltd.
  • Silicon Motion Technology Corp.
  • SK hynix Co. Ltd.
  • Solidigm
  • STMicroelectronics NV
  • Winbond Electronics Corp.
  • Yangtze RST Co., Ltd

Qualitative and quantitative analysis of companies has been conducted to help clients understand the wider business environment as well as the strengths and weaknesses of key industry players. Data is qualitatively analyzed to categorize companies as pure play, category-focused, industry-focused, and diversified; it is quantitatively analyzed to categorize companies as dominant, leading, strong, tentative, and weak.

Recent Development and News in Memory ics market

  • In September 2024, Samsung Electronics Co. Ltd. announced a strategic partnership with a leading automotive Tier-1 supplier to develop next-generation LPDDR5X memory solutions for autonomous driving platforms, aiming to enhance real-time data processing capabilities.
  • In November 2024, Micron Technology Inc. launched its new portfolio of enterprise-grade SSDs featuring 300+ layer 3D NAND technology, specifically targeting the performance and endurance requirements of hyperscale data center workloads.
  • In February 2025, SK hynix Co. Ltd. confirmed a multi-billion dollar investment to construct a new HBM4 production line, directly addressing the escalating demand for high-bandwidth memory from AI accelerator manufacturers.
  • In April 2025, Kioxia Corp. demonstrated a breakthrough in its BiCS FLASH technology, achieving a significant increase in bit density for QLC NAND that enhances storage capacity for consumer devices without increasing physical footprint.

Dive into Technavio’s robust research methodology, blending expert interviews, extensive data synthesis, and validated models for unparalleled Memory Ics Market insights. See full methodology.

Market Scope
Page number 317
Base year 2025
Historic period 2020-2024
Forecast period 2026-2030
Growth momentum & CAGR Accelerate at a CAGR of 10.6%
Market growth 2026-2030 USD 117921.4 million
Market structure Fragmented
YoY growth 2025-2026(%) 9.6%
Key countries China, Japan, South Korea, India, Australia, Indonesia, US, Canada, Mexico, Germany, France, UK, Italy, The Netherlands, Spain, Saudi Arabia, UAE, South Africa, Israel, Turkey, Brazil, Argentina and Colombia
Competitive landscape Leading Companies, Market Positioning of Companies, Competitive Strategies, and Industry Risks

Request Free Sample

Research Analyst Overview

  • The memory ICs market is fundamentally defined by the continuous innovation in core technologies such as dynamic random access memory (dram) and non-volatile memory (nvm), which are foundational to all digital systems. The industry's trajectory is increasingly dictated by the requirements of high-performance computing (hpc) and artificial intelligence, driving the adoption of high bandwidth memory (hbm) and stacked dram architecture.
  • Boardroom decisions on infrastructure investment are now directly influenced by the potential of compute express link (cxl) to create disaggregated memory architectures, which can reduce total data center operational costs by over 20%. This shift necessitates advancements in 3d nand flash memory, with quad-level cell (qlc) and triple-level cell (tlc) technologies pushing storage density limits.
  • The development of automotive grade memory is critical for software-defined vehicles, while enterprise-grade solid-state drives are essential for hyperscale data centers. Manufacturing these complex devices relies on a capital-intensive wafer fabrication process, including extreme ultraviolet lithography (euv) and advanced packaging techniques within a semiconductor fabrication facility.
  • As silicon-based manufacturing approaches physical limits, the industry explores alternatives like magnetoresistive random access memory (mram) and phase-change memory (pcm) to ensure future progress.

What are the Key Data Covered in this Memory Ics Market Research and Growth Report?

  • What is the expected growth of the Memory Ics Market between 2026 and 2030?

    • USD 117.92 billion, at a CAGR of 10.6%

  • What segmentation does the market report cover?

    • The report is segmented by Type (Volatile memory, Non-volatile memory, and Others), End-user (Consumer electronics, IT and telecommunication, Automotive, Healthcare, and Others), Application (Smartphone and tablets, Data centers and servers, Automotive electronics, Industrial electronics, and Others) and Geography (APAC, North America, Europe, Middle East and Africa, South America)

  • Which regions are analyzed in the report?

    • APAC, North America, Europe, Middle East and Africa and South America

  • What are the key growth drivers and market challenges?

    • Proliferation of high-performance computing and AI, Geopolitical volatility and macroeconomic uncertainty

  • Who are the major players in the Memory Ics Market?

    • Analog Devices Inc., Changxin Technology Group Co. Ltd, Fujitsu Ltd., GigaDevice Semiconductor Inc, Infineon Technologies AG, Integrated Silicon Solution Inc, Kioxia Corp., Macronix International Co Ltd, Microchip Technology Inc., Micron Technology Inc., ON Semiconductor Corp., Renesas Electronics Corp., ROHM Co. Ltd., Samsung Electronics Co. Ltd., Silicon Motion Technology Corp., SK hynix Co. Ltd., Solidigm, STMicroelectronics NV, Winbond Electronics Corp. and Yangtze RST Co., Ltd

Market Research Insights

  • The memory ICs market is shaped by intense capital expenditure intensity and the constant need to overcome process node shrinkage challenges. Advanced driver-assistance systems (ADAS) in the automotive sector now generate data volumes that have increased memory requirements by over 300% compared to previous vehicle generations.
  • Concurrently, the adoption of disaggregated architectures in data centers is improving total cost of ownership (TCO) by increasing resource utilization by up to 40%. Geopolitical supply chain risk remains a key concern, influencing strategic decisions around localized production. Innovations in power management integrated circuits (PMICs) are also critical, contributing to enhanced system efficiency.
  • The industry's focus on high-yield manufacturing is essential to manage costs amid escalating complexity, while over-the-air (OTA) updates for software-defined vehicles create new demands for durable and secure non-volatile memory.

We can help! Our analysts can customize this memory ics market research report to meet your requirements.

Get in touch

1. Executive Summary

1.1 Market overview

Executive Summary - Chart on Market Overview
Executive Summary - Data Table on Market Overview
Executive Summary - Chart on Global Market Characteristics
Executive Summary - Chart on Market by Geography
Executive Summary - Chart on Market Segmentation by Type
Executive Summary - Chart on Market Segmentation by End-user
Executive Summary - Chart on Market Segmentation by Application
Executive Summary - Chart on Incremental Growth
Executive Summary - Data Table on Incremental Growth
Executive Summary - Chart on Company Market Positioning

2. Technavio Analysis

2.1 Analysis of price sensitivity, lifecycle, customer purchase basket, adoption rates, and purchase criteria

2.2 Criticality of inputs and Factors of differentiation

Chart on Overview on criticality of inputs and factors of differentiation

2.3 Factors of disruption

Chart on Overview on factors of disruption

2.4 Impact of drivers and challenges

Chart on Impact of drivers and challenges in 2025 and 2030

3. Market Landscape

3.1 Market ecosystem

Chart on Parent Market
Data Table on - Parent Market

3.2 Market characteristics

Chart on Market characteristics analysis

3.3 Value chain analysis

Chart on Value chain analysis

4. Market Sizing

4.1 Market definition

Data Table on Offerings of companies included in the market definition

4.2 Market segment analysis

Market segments

4.3 Market size 2025

4.4 Market outlook: Forecast for 2025-2030

Chart on Global - Market size and forecast 2025-2030 ($ million)
Data Table on Global - Market size and forecast 2025-2030 ($ million)
Chart on Global Market: Year-over-year growth 2025-2030 (%)
Data Table on Global Market: Year-over-year growth 2025-2030 (%)

5. Historic Market Size

5.1 Global Memory ICs Market 2020 - 2024

Historic Market Size - Data Table on Global Memory ICs Market 2020 - 2024 ($ million)

5.2 Type segment analysis 2020 - 2024

Historic Market Size - Type Segment 2020 - 2024 ($ million)

5.3 End-user segment analysis 2020 - 2024

Historic Market Size - End-user Segment 2020 - 2024 ($ million)

5.4 Application segment analysis 2020 - 2024

Historic Market Size - Application Segment 2020 - 2024 ($ million)

5.5 Geography segment analysis 2020 - 2024

Historic Market Size - Geography Segment 2020 - 2024 ($ million)

5.6 Country segment analysis 2020 - 2024

Historic Market Size - Country Segment 2020 - 2024 ($ million)

6. Qualitative Analysis

6.1 Impact of AI on Global Memory ICs Market

7. Five Forces Analysis

7.1 Five forces summary

Five forces analysis - Comparison between 2025 and 2030

7.2 Bargaining power of buyers

Bargaining power of buyers - Impact of key factors 2025 and 2030

7.3 Bargaining power of suppliers

Bargaining power of suppliers - Impact of key factors in 2025 and 2030

7.4 Threat of new entrants

Threat of new entrants - Impact of key factors in 2025 and 2030

7.5 Threat of substitutes

Threat of substitutes - Impact of key factors in 2025 and 2030

7.6 Threat of rivalry

Threat of rivalry - Impact of key factors in 2025 and 2030

7.7 Market condition

Chart on Market condition - Five forces 2025 and 2030

8. Market Segmentation by Type

8.1 Market segments

Chart on Type - Market share 2025-2030 (%)
Data Table on Type - Market share 2025-2030 (%)

8.2 Comparison by Type

Chart on Comparison by Type
Data Table on Comparison by Type

8.3 Volatile memory - Market size and forecast 2025-2030

Chart on Volatile memory - Market size and forecast 2025-2030 ($ million)
Data Table on Volatile memory - Market size and forecast 2025-2030 ($ million)
Chart on Volatile memory - Year-over-year growth 2025-2030 (%)
Data Table on Volatile memory - Year-over-year growth 2025-2030 (%)

8.4 Non-volatile memory - Market size and forecast 2025-2030

Chart on Non-volatile memory - Market size and forecast 2025-2030 ($ million)
Data Table on Non-volatile memory - Market size and forecast 2025-2030 ($ million)
Chart on Non-volatile memory - Year-over-year growth 2025-2030 (%)
Data Table on Non-volatile memory - Year-over-year growth 2025-2030 (%)

8.5 Others - Market size and forecast 2025-2030

Chart on Others - Market size and forecast 2025-2030 ($ million)
Data Table on Others - Market size and forecast 2025-2030 ($ million)
Chart on Others - Year-over-year growth 2025-2030 (%)
Data Table on Others - Year-over-year growth 2025-2030 (%)

8.6 Market opportunity by Type

Market opportunity by Type ($ million)
Data Table on Market opportunity by Type ($ million)

9. Market Segmentation by End-user

9.1 Market segments

Chart on End-user - Market share 2025-2030 (%)
Data Table on End-user - Market share 2025-2030 (%)

9.2 Comparison by End-user

Chart on Comparison by End-user
Data Table on Comparison by End-user

9.3 Consumer electronics - Market size and forecast 2025-2030

Chart on Consumer electronics - Market size and forecast 2025-2030 ($ million)
Data Table on Consumer electronics - Market size and forecast 2025-2030 ($ million)
Chart on Consumer electronics - Year-over-year growth 2025-2030 (%)
Data Table on Consumer electronics - Year-over-year growth 2025-2030 (%)

9.4 IT and telecommunication - Market size and forecast 2025-2030

Chart on IT and telecommunication - Market size and forecast 2025-2030 ($ million)
Data Table on IT and telecommunication - Market size and forecast 2025-2030 ($ million)
Chart on IT and telecommunication - Year-over-year growth 2025-2030 (%)
Data Table on IT and telecommunication - Year-over-year growth 2025-2030 (%)

9.5 Automotive - Market size and forecast 2025-2030

Chart on Automotive - Market size and forecast 2025-2030 ($ million)
Data Table on Automotive - Market size and forecast 2025-2030 ($ million)
Chart on Automotive - Year-over-year growth 2025-2030 (%)
Data Table on Automotive - Year-over-year growth 2025-2030 (%)

9.6 Healthcare - Market size and forecast 2025-2030

Chart on Healthcare - Market size and forecast 2025-2030 ($ million)
Data Table on Healthcare - Market size and forecast 2025-2030 ($ million)
Chart on Healthcare - Year-over-year growth 2025-2030 (%)
Data Table on Healthcare - Year-over-year growth 2025-2030 (%)

9.7 Others - Market size and forecast 2025-2030

Chart on Others - Market size and forecast 2025-2030 ($ million)
Data Table on Others - Market size and forecast 2025-2030 ($ million)
Chart on Others - Year-over-year growth 2025-2030 (%)
Data Table on Others - Year-over-year growth 2025-2030 (%)

9.8 Market opportunity by End-user

Market opportunity by End-user ($ million)
Data Table on Market opportunity by End-user ($ million)

10. Market Segmentation by Application

10.1 Market segments

Chart on Application - Market share 2025-2030 (%)
Data Table on Application - Market share 2025-2030 (%)

10.2 Comparison by Application

Chart on Comparison by Application
Data Table on Comparison by Application

10.3 Smartphone and tablets - Market size and forecast 2025-2030

Chart on Smartphone and tablets - Market size and forecast 2025-2030 ($ million)
Data Table on Smartphone and tablets - Market size and forecast 2025-2030 ($ million)
Chart on Smartphone and tablets - Year-over-year growth 2025-2030 (%)
Data Table on Smartphone and tablets - Year-over-year growth 2025-2030 (%)

10.4 Data centers and servers - Market size and forecast 2025-2030

Chart on Data centers and servers - Market size and forecast 2025-2030 ($ million)
Data Table on Data centers and servers - Market size and forecast 2025-2030 ($ million)
Chart on Data centers and servers - Year-over-year growth 2025-2030 (%)
Data Table on Data centers and servers - Year-over-year growth 2025-2030 (%)

10.5 Automotive electronics - Market size and forecast 2025-2030

Chart on Automotive electronics - Market size and forecast 2025-2030 ($ million)
Data Table on Automotive electronics - Market size and forecast 2025-2030 ($ million)
Chart on Automotive electronics - Year-over-year growth 2025-2030 (%)
Data Table on Automotive electronics - Year-over-year growth 2025-2030 (%)

10.6 Industrial electronics - Market size and forecast 2025-2030

Chart on Industrial electronics - Market size and forecast 2025-2030 ($ million)
Data Table on Industrial electronics - Market size and forecast 2025-2030 ($ million)
Chart on Industrial electronics - Year-over-year growth 2025-2030 (%)
Data Table on Industrial electronics - Year-over-year growth 2025-2030 (%)

10.7 Others - Market size and forecast 2025-2030

Chart on Others - Market size and forecast 2025-2030 ($ million)
Data Table on Others - Market size and forecast 2025-2030 ($ million)
Chart on Others - Year-over-year growth 2025-2030 (%)
Data Table on Others - Year-over-year growth 2025-2030 (%)

10.8 Market opportunity by Application

Market opportunity by Application ($ million)
Data Table on Market opportunity by Application ($ million)

11. Customer Landscape

11.1 Customer landscape overview

Analysis of price sensitivity, lifecycle, customer purchase basket, adoption rates, and purchase criteria

12. Geographic Landscape

12.1 Geographic segmentation

Chart on Market share by geography 2025-2030 (%)
Data Table on Market share by geography 2025-2030 (%)

12.2 Geographic comparison

Chart on Geographic comparison
Data Table on Geographic comparison

12.3 APAC - Market size and forecast 2025-2030

Chart on APAC - Market size and forecast 2025-2030 ($ million)
Data Table on APAC - Market size and forecast 2025-2030 ($ million)
Chart on APAC - Year-over-year growth 2025-2030 (%)
Data Table on APAC - Year-over-year growth 2025-2030 (%)
Chart on Regional Comparison - APAC
Data Table on Regional Comparison - APAC

12.3.1 China - Market size and forecast 2025-2030

Chart on China - Market size and forecast 2025-2030 ($ million)
Data Table on China - Market size and forecast 2025-2030 ($ million)
Chart on China - Year-over-year growth 2025-2030 (%)
Data Table on China - Year-over-year growth 2025-2030 (%)

12.3.2 Japan - Market size and forecast 2025-2030

Chart on Japan - Market size and forecast 2025-2030 ($ million)
Data Table on Japan - Market size and forecast 2025-2030 ($ million)
Chart on Japan - Year-over-year growth 2025-2030 (%)
Data Table on Japan - Year-over-year growth 2025-2030 (%)

12.3.3 South Korea - Market size and forecast 2025-2030

Chart on South Korea - Market size and forecast 2025-2030 ($ million)
Data Table on South Korea - Market size and forecast 2025-2030 ($ million)
Chart on South Korea - Year-over-year growth 2025-2030 (%)
Data Table on South Korea - Year-over-year growth 2025-2030 (%)

12.3.4 India - Market size and forecast 2025-2030

Chart on India - Market size and forecast 2025-2030 ($ million)
Data Table on India - Market size and forecast 2025-2030 ($ million)
Chart on India - Year-over-year growth 2025-2030 (%)
Data Table on India - Year-over-year growth 2025-2030 (%)

12.3.5 Australia - Market size and forecast 2025-2030

Chart on Australia - Market size and forecast 2025-2030 ($ million)
Data Table on Australia - Market size and forecast 2025-2030 ($ million)
Chart on Australia - Year-over-year growth 2025-2030 (%)
Data Table on Australia - Year-over-year growth 2025-2030 (%)

12.3.6 Indonesia - Market size and forecast 2025-2030

Chart on Indonesia - Market size and forecast 2025-2030 ($ million)
Data Table on Indonesia - Market size and forecast 2025-2030 ($ million)
Chart on Indonesia - Year-over-year growth 2025-2030 (%)
Data Table on Indonesia - Year-over-year growth 2025-2030 (%)

12.4 North America - Market size and forecast 2025-2030

Chart on North America - Market size and forecast 2025-2030 ($ million)
Data Table on North America - Market size and forecast 2025-2030 ($ million)
Chart on North America - Year-over-year growth 2025-2030 (%)
Data Table on North America - Year-over-year growth 2025-2030 (%)
Chart on Regional Comparison - North America
Data Table on Regional Comparison - North America

12.4.1 US - Market size and forecast 2025-2030

Chart on US - Market size and forecast 2025-2030 ($ million)
Data Table on US - Market size and forecast 2025-2030 ($ million)
Chart on US - Year-over-year growth 2025-2030 (%)
Data Table on US - Year-over-year growth 2025-2030 (%)

12.4.2 Canada - Market size and forecast 2025-2030

Chart on Canada - Market size and forecast 2025-2030 ($ million)
Data Table on Canada - Market size and forecast 2025-2030 ($ million)
Chart on Canada - Year-over-year growth 2025-2030 (%)
Data Table on Canada - Year-over-year growth 2025-2030 (%)

12.4.3 Mexico - Market size and forecast 2025-2030

Chart on Mexico - Market size and forecast 2025-2030 ($ million)
Data Table on Mexico - Market size and forecast 2025-2030 ($ million)
Chart on Mexico - Year-over-year growth 2025-2030 (%)
Data Table on Mexico - Year-over-year growth 2025-2030 (%)

12.5 Europe - Market size and forecast 2025-2030

Chart on Europe - Market size and forecast 2025-2030 ($ million)
Data Table on Europe - Market size and forecast 2025-2030 ($ million)
Chart on Europe - Year-over-year growth 2025-2030 (%)
Data Table on Europe - Year-over-year growth 2025-2030 (%)
Chart on Regional Comparison - Europe
Data Table on Regional Comparison - Europe

12.5.1 Germany - Market size and forecast 2025-2030

Chart on Germany - Market size and forecast 2025-2030 ($ million)
Data Table on Germany - Market size and forecast 2025-2030 ($ million)
Chart on Germany - Year-over-year growth 2025-2030 (%)
Data Table on Germany - Year-over-year growth 2025-2030 (%)

12.5.2 France - Market size and forecast 2025-2030

Chart on France - Market size and forecast 2025-2030 ($ million)
Data Table on France - Market size and forecast 2025-2030 ($ million)
Chart on France - Year-over-year growth 2025-2030 (%)
Data Table on France - Year-over-year growth 2025-2030 (%)

12.5.3 UK - Market size and forecast 2025-2030

Chart on UK - Market size and forecast 2025-2030 ($ million)
Data Table on UK - Market size and forecast 2025-2030 ($ million)
Chart on UK - Year-over-year growth 2025-2030 (%)
Data Table on UK - Year-over-year growth 2025-2030 (%)

12.5.4 Italy - Market size and forecast 2025-2030

Chart on Italy - Market size and forecast 2025-2030 ($ million)
Data Table on Italy - Market size and forecast 2025-2030 ($ million)
Chart on Italy - Year-over-year growth 2025-2030 (%)
Data Table on Italy - Year-over-year growth 2025-2030 (%)

12.5.5 The Netherlands - Market size and forecast 2025-2030

Chart on The Netherlands - Market size and forecast 2025-2030 ($ million)
Data Table on The Netherlands - Market size and forecast 2025-2030 ($ million)
Chart on The Netherlands - Year-over-year growth 2025-2030 (%)
Data Table on The Netherlands - Year-over-year growth 2025-2030 (%)

12.5.6 Spain - Market size and forecast 2025-2030

Chart on Spain - Market size and forecast 2025-2030 ($ million)
Data Table on Spain - Market size and forecast 2025-2030 ($ million)
Chart on Spain - Year-over-year growth 2025-2030 (%)
Data Table on Spain - Year-over-year growth 2025-2030 (%)

12.6 Middle East and Africa - Market size and forecast 2025-2030

Chart on Middle East and Africa - Market size and forecast 2025-2030 ($ million)
Data Table on Middle East and Africa - Market size and forecast 2025-2030 ($ million)
Chart on Middle East and Africa - Year-over-year growth 2025-2030 (%)
Data Table on Middle East and Africa - Year-over-year growth 2025-2030 (%)
Chart on Regional Comparison - Middle East and Africa
Data Table on Regional Comparison - Middle East and Africa

12.6.1 Saudi Arabia - Market size and forecast 2025-2030

Chart on Saudi Arabia - Market size and forecast 2025-2030 ($ million)
Data Table on Saudi Arabia - Market size and forecast 2025-2030 ($ million)
Chart on Saudi Arabia - Year-over-year growth 2025-2030 (%)
Data Table on Saudi Arabia - Year-over-year growth 2025-2030 (%)

12.6.2 UAE - Market size and forecast 2025-2030

Chart on UAE - Market size and forecast 2025-2030 ($ million)
Data Table on UAE - Market size and forecast 2025-2030 ($ million)
Chart on UAE - Year-over-year growth 2025-2030 (%)
Data Table on UAE - Year-over-year growth 2025-2030 (%)

12.6.3 South Africa - Market size and forecast 2025-2030

Chart on South Africa - Market size and forecast 2025-2030 ($ million)
Data Table on South Africa - Market size and forecast 2025-2030 ($ million)
Chart on South Africa - Year-over-year growth 2025-2030 (%)
Data Table on South Africa - Year-over-year growth 2025-2030 (%)

12.6.4 Israel - Market size and forecast 2025-2030

Chart on Israel - Market size and forecast 2025-2030 ($ million)
Data Table on Israel - Market size and forecast 2025-2030 ($ million)
Chart on Israel - Year-over-year growth 2025-2030 (%)
Data Table on Israel - Year-over-year growth 2025-2030 (%)

12.6.5 Turkey - Market size and forecast 2025-2030

Chart on Turkey - Market size and forecast 2025-2030 ($ million)
Data Table on Turkey - Market size and forecast 2025-2030 ($ million)
Chart on Turkey - Year-over-year growth 2025-2030 (%)
Data Table on Turkey - Year-over-year growth 2025-2030 (%)

12.7 South America - Market size and forecast 2025-2030

Chart on South America - Market size and forecast 2025-2030 ($ million)
Data Table on South America - Market size and forecast 2025-2030 ($ million)
Chart on South America - Year-over-year growth 2025-2030 (%)
Data Table on South America - Year-over-year growth 2025-2030 (%)
Chart on Regional Comparison - South America
Data Table on Regional Comparison - South America

12.7.1 Brazil - Market size and forecast 2025-2030

Chart on Brazil - Market size and forecast 2025-2030 ($ million)
Data Table on Brazil - Market size and forecast 2025-2030 ($ million)
Chart on Brazil - Year-over-year growth 2025-2030 (%)
Data Table on Brazil - Year-over-year growth 2025-2030 (%)

12.7.2 Argentina - Market size and forecast 2025-2030

Chart on Argentina - Market size and forecast 2025-2030 ($ million)
Data Table on Argentina - Market size and forecast 2025-2030 ($ million)
Chart on Argentina - Year-over-year growth 2025-2030 (%)
Data Table on Argentina - Year-over-year growth 2025-2030 (%)

12.7.3 Colombia - Market size and forecast 2025-2030

Chart on Colombia - Market size and forecast 2025-2030 ($ million)
Data Table on Colombia - Market size and forecast 2025-2030 ($ million)
Chart on Colombia - Year-over-year growth 2025-2030 (%)
Data Table on Colombia - Year-over-year growth 2025-2030 (%)

12.8 Market opportunity by geography

Market opportunity by geography ($ million)
Data Tables on Market opportunity by geography ($ million)

13. Drivers, Challenges, and Opportunity

13.1 Market drivers

Proliferation of high-performance computing and AI
Accelerated adoption of 5G connectivity and edge computing
Digital transformation of global automotive industry

13.2 Market challenges

Geopolitical volatility and macroeconomic uncertainty
Technical limitations and escalation of research and development costs
Environmental regulation and resource scarcity

13.3 Impact of drivers and challenges

Impact of drivers and challenges in 2025 and 2030

13.4 Market opportunities

Strategic migration toward DDR5 and LPDDR5X architecture in global computing ecosystems
Advancements in compute express link for disaggregated memory architectures
Scaling of 3D NAND technology and vertical integration

14. Competitive Landscape

14.1 Overview

14.2

Overview on criticality of inputs and factors of differentiation

14.3 Landscape disruption

Overview on factors of disruption

14.4 Industry risks

Impact of key risks on business

15. Competitive Analysis

15.1 Companies profiled

Companies covered

15.2 Company ranking index

15.3 Market positioning of companies

Matrix on companies position and classification

15.4 Analog Devices Inc.

Analog Devices Inc. - Overview
Analog Devices Inc. - Business segments
Analog Devices Inc. - Key news
Analog Devices Inc. - Key offerings
Analog Devices Inc. - Segment focus
SWOT

15.5 Changxin Technology Group Co. Ltd

Changxin Technology Group Co. Ltd - Overview
Changxin Technology Group Co. Ltd - Product / Service
Changxin Technology Group Co. Ltd - Key offerings
SWOT

15.6 GigaDevice Semiconductor Inc

GigaDevice Semiconductor Inc - Overview
GigaDevice Semiconductor Inc - Product / Service
GigaDevice Semiconductor Inc - Key offerings
SWOT

15.7 Infineon Technologies AG

Infineon Technologies AG - Overview
Infineon Technologies AG - Business segments
Infineon Technologies AG - Key news
Infineon Technologies AG - Key offerings
Infineon Technologies AG - Segment focus
SWOT

15.8 Kioxia Corp.

Kioxia Corp. - Overview
Kioxia Corp. - Product / Service
Kioxia Corp. - Key offerings
SWOT

15.9 Macronix International Co Ltd

Macronix International Co Ltd - Overview
Macronix International Co Ltd - Product / Service
Macronix International Co Ltd - Key offerings
SWOT

15.10 Microchip Technology Inc.

Microchip Technology Inc. - Overview
Microchip Technology Inc. - Business segments
Microchip Technology Inc. - Key news
Microchip Technology Inc. - Key offerings
Microchip Technology Inc. - Segment focus
SWOT

15.11 Micron Technology Inc.

Micron Technology Inc. - Overview
Micron Technology Inc. - Business segments
Micron Technology Inc. - Key news
Micron Technology Inc. - Key offerings
Micron Technology Inc. - Segment focus
SWOT

15.12 Renesas Electronics Corp.

Renesas Electronics Corp. - Overview
Renesas Electronics Corp. - Business segments
Renesas Electronics Corp. - Key news
Renesas Electronics Corp. - Key offerings
Renesas Electronics Corp. - Segment focus
SWOT

15.13 ROHM Co. Ltd.

ROHM Co. Ltd. - Overview
ROHM Co. Ltd. - Business segments
ROHM Co. Ltd. - Key news
ROHM Co. Ltd. - Key offerings
ROHM Co. Ltd. - Segment focus
SWOT

15.14 Samsung Electronics Co. Ltd.

Samsung Electronics Co. Ltd. - Overview
Samsung Electronics Co. Ltd. - Business segments
Samsung Electronics Co. Ltd. - Key news
Samsung Electronics Co. Ltd. - Key offerings
Samsung Electronics Co. Ltd. - Segment focus
SWOT

15.15 SK hynix Co. Ltd.

SK hynix Co. Ltd. - Overview
SK hynix Co. Ltd. - Product / Service
SK hynix Co. Ltd. - Key news
SK hynix Co. Ltd. - Key offerings
SWOT

15.16 STMicroelectronics NV

STMicroelectronics NV - Overview
STMicroelectronics NV - Business segments
STMicroelectronics NV - Key news
STMicroelectronics NV - Key offerings
STMicroelectronics NV - Segment focus
SWOT

15.17 Winbond Electronics Corp.

Winbond Electronics Corp. - Overview
Winbond Electronics Corp. - Business segments
Winbond Electronics Corp. - Key news
Winbond Electronics Corp. - Key offerings
Winbond Electronics Corp. - Segment focus
SWOT

15.18 Yangtze RST Co., Ltd

Yangtze RST Co., Ltd - Overview
Yangtze RST Co., Ltd - Product / Service
Yangtze RST Co., Ltd - Key offerings
SWOT

16. Appendix

16.1 Scope of the report

Market definition
Objectives
Notes and caveats

16.2 Inclusions and exclusions checklist

Inclusions checklist
Exclusions checklist

16.3 Currency conversion rates for US$

16.4 Research methodology

16.5 Data procurement

Information sources

16.6 Data validation

16.7 Validation techniques employed for market sizing

16.8 Data synthesis

16.9 360 degree market analysis

16.10 List of abbreviations

Research Methodology

Technavio presents a detailed picture of the market by way of study, synthesis, and summation of data from multiple sources. The analysts have presented the various facets of the market with a particular focus on identifying the key industry influencers. The data thus presented is comprehensive, reliable, and the result of extensive research, both primary and secondary.

INFORMATION SOURCES

Primary sources

  • Manufacturers and suppliers
  • Channel partners
  • Industry experts
  • Strategic decision makers

Secondary sources

  • Industry journals and periodicals
  • Government data
  • Financial reports of key industry players
  • Historical data
  • Press releases

DATA ANALYSIS

Data Synthesis

  • Collation of data
  • Estimation of key figures
  • Analysis of derived insights

Data Validation

  • Triangulation with data models
  • Reference against proprietary databases
  • Corroboration with industry experts

REPORT WRITING

Qualitative

  • Market drivers
  • Market challenges
  • Market trends
  • Five forces analysis

Quantitative

  • Market size and forecast
  • Market segmentation
  • Geographical insights
  • Competitive landscape

Interested in this report?

Get your sample now to see our research methodology and insights!

Download Now

Frequently Asked Questions

Memory Ics market growth will increase by USD 117921.4 million during 2026-2030.

The Memory Ics market is expected to grow at a CAGR of 10.6% during 2026-2030.

Memory Ics market is segmented by Type (Volatile memory, Non-volatile memory, Others) End-user (Consumer electronics, IT and telecommunication, Automotive, Healthcare, Others) Application (Smartphone and tablets, Data centers and servers, Automotive electronics, Industrial electronics, Others)

Analog Devices Inc., Changxin Technology Group Co. Ltd, Fujitsu Ltd., GigaDevice Semiconductor Inc, Infineon Technologies AG, Integrated Silicon Solution Inc, Kioxia Corp., Macronix International Co Ltd, Microchip Technology Inc., Micron Technology Inc., ON Semiconductor Corp., Renesas Electronics Corp., ROHM Co. Ltd., Samsung Electronics Co. Ltd., Silicon Motion Technology Corp., SK hynix Co. Ltd., Solidigm, STMicroelectronics NV, Winbond Electronics Corp., Yangtze RST Co., Ltd are a few of the key vendors in the Memory Ics market.

APAC will register the highest growth rate of 59.6% among the other regions. Therefore, the Memory Ics market in APAC is expected to garner significant business opportunities for the vendors during the forecast period.

China, Japan, South Korea, India, Australia, Indonesia, US, Canada, Mexico, Germany, France, UK, Italy, The Netherlands, Spain, Saudi Arabia, UAE, South Africa, Israel, Turkey, Brazil, Argentina, Colombia

  • Proliferation of high-performance computing and AI is the driving factor this market.

The Memory Ics market vendors should focus on grabbing business opportunities from the Type segment as it accounted for the largest market share in the base year.
RIA - Research AI Assistant
Ask RIA