Memristor Memory Devices Market Size 2024-2028
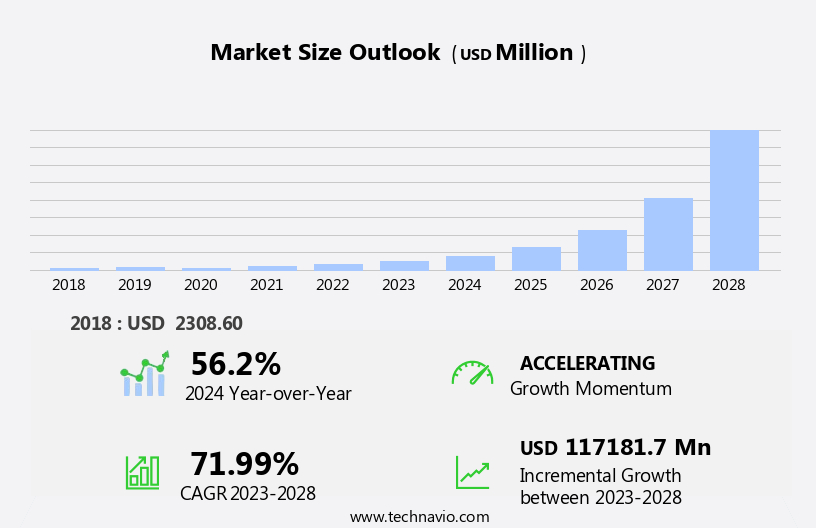
The memristor memory devices market size is forecast to increase by USD 117.18 billion, at a CAGR of 71.99% between 2023 and 2028.
- The market is poised for significant growth, driven by the expanding electronics industry and the increasing adoption of smart cities. Memristor technology, known for its ability to mimic the human brain's synaptic functionality, offers unparalleled energy efficiency and high-speed processing capabilities. These attributes make memristors an ideal choice for various applications, including artificial intelligence, machine learning, and the Internet of Things (IoT). However, the market faces challenges due to constant fluctuations in demand-supply dynamics. As the technology gains traction, the demand for memristors is increasing rapidly, while the supply side is still catching up.
- This imbalance may lead to price volatility and potential supply shortages, posing a significant challenge for market participants. To capitalize on the market's potential, companies must closely monitor demand trends and invest in scaling up production capabilities. Additionally, collaborations and partnerships with key industry players can help in sharing risks and enhancing technological advancements. By addressing these challenges and leveraging the market's growth drivers, companies can effectively navigate the competitive landscape and seize opportunities in the market.
What will be the Size of the Memristor Memory Devices Market during the forecast period?
Explore in-depth regional segment analysis with market size data - historical 2018-2022 and forecasts 2024-2028 - in the full report.
Request Free Sample
The market continues to evolve, driven by advancements in technology and applications across various sectors. Defect tolerance and hardware security are critical considerations in the development of these devices, ensuring reliable and secure data storage. Emerging memory technologies, such as software defined memory and synaptic weight, offer new possibilities for memory management and energy efficiency. Edge computing and wear leveling are key trends in the market, with memristor devices providing solutions for real-time data processing and extended memory lifespan. Phase change memory and data integrity are essential for high-performance computing and data centers, where fast read and write latencies and data security are paramount.
Neuromorphic computing and memory-centric architectures are gaining traction, with memristor devices offering advantages in material science, spin transfer torque, and fabrication processes. Energy efficiency is a significant factor in the market, with memristor devices offering lower power consumption compared to traditional memory technologies. The ongoing development of memristor devices is shaping the landscape of data storage, with applications in cloud computing, deep learning, internet of things, and machine learning. Memory controllers and memristor arrays are essential components in this evolving ecosystem, with continuous research and innovation driving the market forward. Memristor devices are revolutionizing the semiconductor industry, offering non-volatile memory solutions that are smaller, faster, and more energy-efficient than traditional memory technologies.
The market for memristor devices is dynamic and ever-changing, with ongoing research and development in areas such as fault tolerance, error correction codes, and crossbar arrays. In the realm of data storage, memristor devices offer a promising alternative to flash memory and solid-state drives, with advantages in read and write latency, power consumption, and data security. The market for memristor devices is poised for significant growth, with applications in high-performance computing, artificial neural networks, and data centers driving demand. The memristor devices market is a complex and dynamic ecosystem, with ongoing research and development in material science, transition metal oxides, and thin film deposition shaping the future of memory technology.
The market is driven by the need for faster, more energy-efficient, and more secure memory solutions, with memristor devices offering a promising solution to these challenges. In conclusion, the market is a dynamic and evolving ecosystem, with ongoing research and development shaping the future of memory technology. From defect tolerance and hardware security to emerging memory technologies and software defined memory, the market is driven by the need for faster, more energy-efficient, and more secure memory solutions. The ongoing innovation in memristor devices is revolutionizing the semiconductor industry, with applications in high-performance computing, data centers, and the internet of things leading the way. The future of memory technology is bright, with memristor devices offering a promising solution to the challenges of data storage and processing.
How is this Memristor Memory Devices Industry segmented?
The memristor memory devices industry research report provides comprehensive data (region-wise segment analysis), with forecasts and estimates in "USD million" for the period 2024-2028, as well as historical data from 2018-2022 for the following segments.
- End-user
- Consumer electronics
- IT and telecom
- Automotive
- Healthcare
- Others
- Type
- Molecular and iconic thin film memristor
- Magnetic and spin based memristor
- Geography
- North America
- US
- Europe
- Germany
- APAC
- China
- Japan
- South Korea
- Rest of World (ROW)
- North America
. By End-user Insights
The consumer electronics segment is estimated to witness significant growth during the forecast period.
The market encompasses various applications, with the consumer electronics segment being a significant contributor. Memristor technology, integrated into devices like smartphones, laptops, tablets, and other mobiles, offers advantages such as energy efficiency, faster data access, and higher data storage density compared to conventional memory technologies. The global proliferation of Internet of Things (IoT) devices is driving the demand for memristor memory devices, as these technologies require high-density, low-power memory solutions. Material science innovations, including transition metal oxides and spin transfer torque, are crucial in advancing memristor technology. Memory management techniques, such as wear leveling and error correction codes, ensure data integrity and reliability.
Synaptic weight and crossbar array architectures are essential in neuromorphic computing and machine learning applications. Emerging memory technologies, including phase change memory and memristor devices, are poised to disrupt the traditional memory landscape. Memory-centric architectures and software-defined memory are gaining traction in high-performance computing and cloud computing environments. Data centers and solid-state drives are increasingly adopting these advanced memory technologies for improved performance and energy efficiency. Fault tolerance and hardware security are essential considerations in the market, as data security becomes increasingly critical in the digital age. Fabrication processes, such as thin film deposition, are vital in scaling up production and reducing costs.
The integration of memristor memory devices in various applications, from deep learning to edge computing, underscores their versatility and potential impact on the technology landscape.
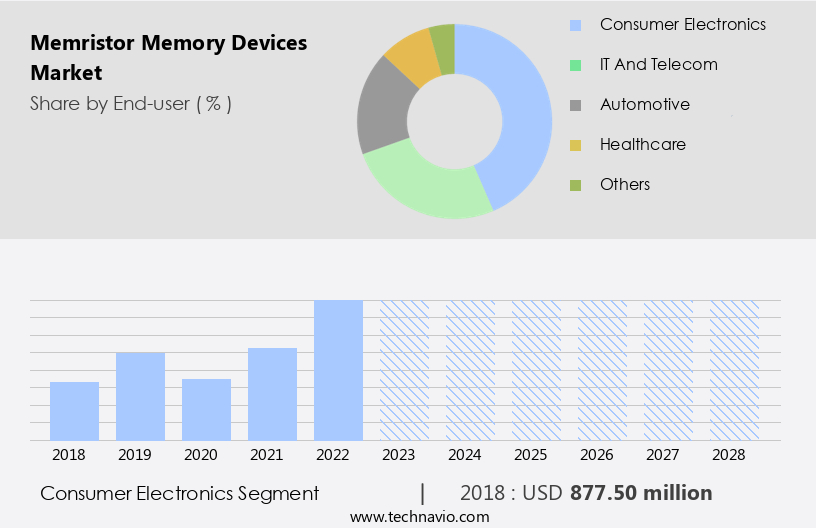
The Consumer electronics segment was valued at USD 877.50 billion in 2018 and showed a gradual increase during the forecast period.
Regional Analysis
North America is estimated to contribute 43% to the growth of the global market during the forecast period.Technavio's analysts have elaborately explained the regional trends and drivers that shape the market during the forecast period.
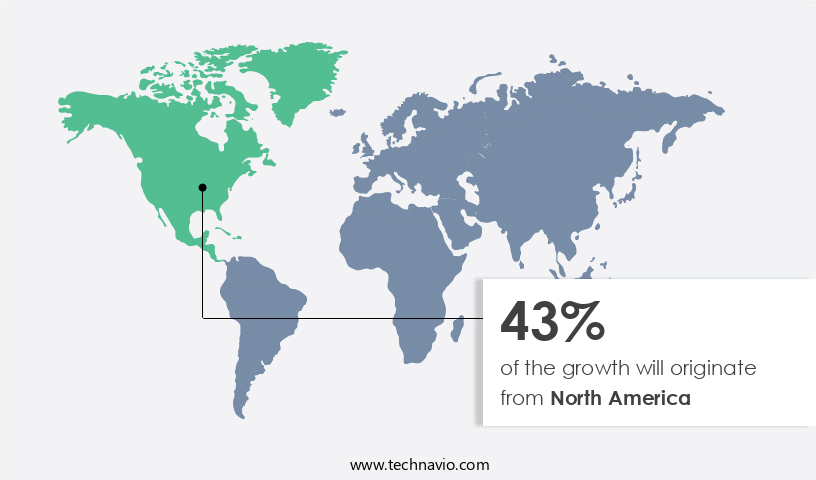
Memristor memory devices have gained significant attention in the technology industry due to their unique properties and potential applications. In North America, this market holds immense importance, driven by substantial R&D investments from local businesses and a highly skilled integrator base. Key players in this space, including those based in the US, are pioneering advancements in neuromorphic computing, automotive, flexible electronics, IoT, edge computing, and industrial robotics. The demand for memristors is further fueled by the increasing popularity of advanced consumer items such as smartphones, PCs, and intelligent home gadgets in North America. As memristors continue to evolve, offering stronger and cost-effective distributed sensing and processing solutions, the market for memristor memory devices is poised for growth.
Material science innovations, such as transition metal oxides and spin transfer torque, are crucial in enhancing memristor performance and energy efficiency. Memory management techniques, including wear leveling and error correction codes, ensure data integrity and reliability. The integration of memristors in memory-centric architectures and high-performance computing systems, as well as their potential in deep learning applications, further bolsters their market potential. The fabrication processes, including thin film deposition and crossbar array technology, are continually refined to improve memristor scalability and performance. Memristor arrays, memory controllers, and memristor devices are essential components in cloud computing, data centers, and solid-state drives, making them indispensable in the digital age. The focus on hardware security and data security is another significant trend, as memristors offer potential solutions to address power consumption, fault tolerance, and machine learning requirements.
Market Dynamics
Our researchers analyzed the data with 2023 as the base year, along with the key drivers, trends, and challenges. A holistic analysis of drivers will help companies refine their marketing strategies to gain a competitive advantage.
What are the key market drivers leading to the rise in the adoption of Memristor Memory Devices Industry?
- The expansion of smart cities serves as the primary catalyst for market growth. Memristor devices, a type of non-volatile memory, are gaining significant attention in the technology industry due to their potential benefits in various applications, particularly in data security and machine learning. Memristor-based memory solutions offer advantages such as lower power consumption, fault tolerance, and the ability to implement error correction codes. These features make memristor devices an attractive alternative to traditional solid-state drives (SSDs) and complementary metal-oxide-semiconductor (CMOS) technology. The integration of memristor devices into data centers and other IT infrastructure can lead to more efficient and secure data processing. Memristor crossbar arrays can enable faster and more accurate data processing, which is crucial for machine learning algorithms.
- Additionally, the non-volatile nature of memristor devices ensures data retention even in the absence of power, enhancing data security. Governments and corporations worldwide are investing in the development and implementation of advanced technologies to improve urban infrastructure and create smart cities. Memristor devices can play a vital role in these projects, offering improved data processing capabilities and energy efficiency. The adoption of memristor technology is expected to continue growing as the demand for more efficient and secure data processing solutions increases.
What are the market trends shaping the Memristor Memory Devices Industry?
- The electronics industry's growth is driving increased demand for memristors, making it a noteworthy market trend. Memristors, a type of resistor with the ability to change their resistance based on the electric charge passed through them, are becoming increasingly valuable in various applications due to their high functionality and efficiency.
- Memristor memory devices have gained significant attention in the technology industry due to their potential to address the increasing memory density and power requirements in consumer electronics. The demand for memristors is primarily driven by the growing market for wearable and connected devices, which are expected to witness substantial growth in the coming years. These devices necessitate high-density and fast memory solutions to enhance performance and enable advanced features. Memristors, as non-volatile memory technologies, offer the advantage of data retention even when the power is turned off. This feature is crucial for devices where data preservation is essential.
- Moreover, the emergence of artificial intelligence and machine learning applications has further fueled the adoption of memristor memory devices due to their ability to provide fast and high-density memory solutions. The importance of defect tolerance and hardware security in emerging memory technologies, such as memristors, is increasingly recognized. Memristors' ability to provide energy efficiency, synaptic weight, and wear leveling makes them an attractive option for edge computing applications. Additionally, data integrity is a critical concern, and memristor memory devices offer robust solutions to maintain data accuracy and reliability. In conclusion, the consumer electronics industry's demand for high-performance, low-power memory solutions is driving the adoption of memristor memory devices.
- The growing popularity of wearable and connected devices, the increasing importance of artificial intelligence and machine learning, and the need for energy efficiency, defect tolerance, hardware security, and data integrity are some of the key factors propelling the market for memristor memory devices.
What challenges does the Memristor Memory Devices Industry face during its growth?
- The continuous volatility in memristor demand-supply dynamics poses a significant challenge to the industry's growth trajectory.
- The market experiences significant market dynamics due to the cyclical nature of the industries it serves, including smartphones, data centers, servers, and cloud storage devices. companies face the challenge of aligning production cycles with sales in these industries to avoid oversupply or shortage conditions. Material science advancements, such as the use of transition metal oxides in memristor array and memory controllers, contribute to the development of memory-centric architectures and neuromorphic computing. These technologies aim to reduce read latency and write latency, making data storage more efficient.
- Memristor memory devices offer potential benefits, including lower power consumption and higher density compared to traditional memory modules. However, the market's success relies on the continued growth of the industries mentioned above.
Exclusive Customer Landscape
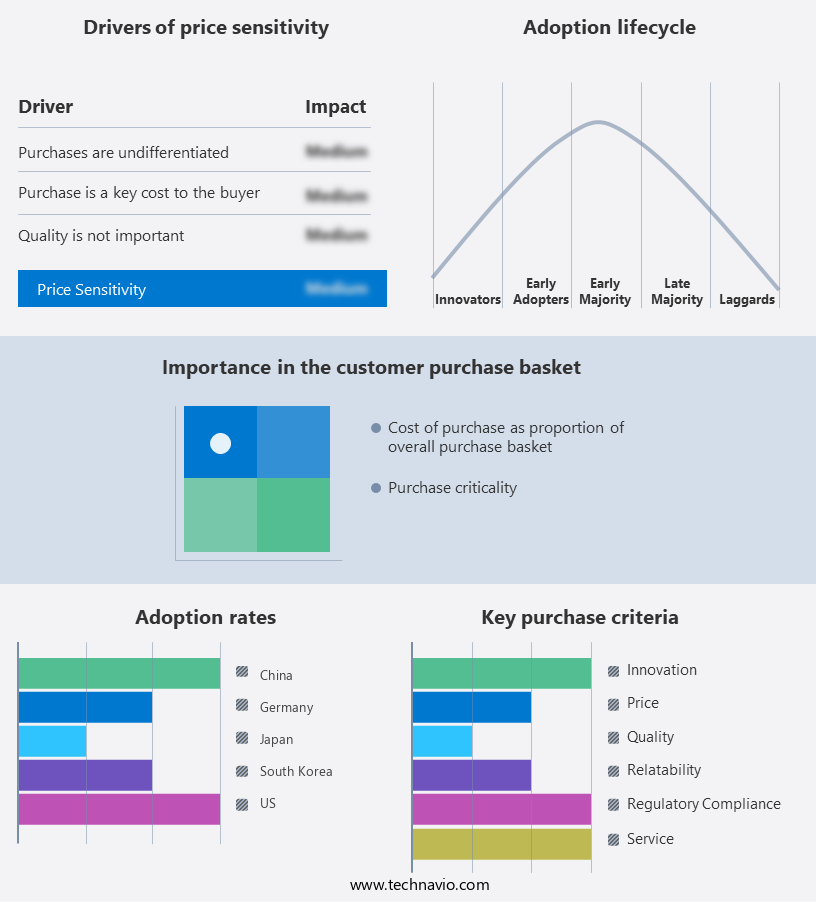
The memristor memory devices market forecasting report includes the adoption lifecycle of the market, covering from the innovator's stage to the laggard's stage. It focuses on adoption rates in different regions based on penetration. Furthermore, the memristor memory devices market report also includes key purchase criteria and drivers of price sensitivity to help companies evaluate and develop their market growth analysis strategies.
Customer Landscape
Key Companies & Market Insights
Companies are implementing various strategies, such as strategic alliances, memristor memory devices market forecast, partnerships, mergers and acquisitions, geographical expansion, and product/service launches, to enhance their presence in the industry.
4DS Memory Ltd. - The company specializes in advanced memory technology, providing innovative solutions such as 4DS Interface Switching ReRAM using memristor technology. This cutting-edge memory solution offers superior performance and energy efficiency compared to traditional memory types.
The industry research and growth report includes detailed analyses of the competitive landscape of the market and information about key companies, including:
- 4DS Memory Ltd.
- Avalanche Technology Inc.
- Crocus Nano Electronic LLC
- CrossBar Inc.
- eMemory Technology Inc.
- Fujitsu Ltd.
- Hewlett Packard Enterprise Co.
- Intel Corp.
- International Business Machines Corp.
- Intrinsic Ltd.
- Knowm Inc.
- mlabsindia
- Panasonic Holdings Corp.
- Rambus Inc.
- Renesas Electronics Corp.
- Samsung Electronics Co. Ltd.
- Sanmina Corp.
- SK hynix Co. Ltd.
- Weebit
- Western Digital Corp.
Qualitative and quantitative analysis of companies has been conducted to help clients understand the wider business environment as well as the strengths and weaknesses of key industry players. Data is qualitatively analyzed to categorize companies as pure play, category-focused, industry-focused, and diversified; it is quantitatively analyzed to categorize companies as dominant, leading, strong, tentative, and weak.
Recent Development and News in Memristor Memory Devices Market
- In February 2023, Intel unveiled its new Intel Optane DC Persistent Memory 200 series, integrating memristor technology into its data center offerings, aiming to deliver faster data access and improved workload performance (Intel Press Release, 2023).
- In May 2024, Crossbar, a leading memristor technology company, announced a strategic partnership with Samsung Electronics to develop and commercialize next-generation memristor memory solutions, combining Crossbar's memristor technology with Samsung's manufacturing expertise (Crossbar Press Release, 2024).
- In October 2024, IBM Research showcased a significant technological advancement in memristor memory devices, demonstrating a 1Tb (terabit) memristor chip, marking a major milestone in the quest for higher storage capacity and density (IBM Research, 2024).
- In January 2025, Everspin Technologies, a prominent memristor memory supplier, secured a USD50 million investment from SK Hynix, a leading memory manufacturer, to expand their production capacity and accelerate the development of their memristor memory solutions (Everspin Press Release, 2025).
Research Analyst Overview
- The memristor market is experiencing significant growth, driven by the unique properties of memristor technology and its potential applications in various industries. According to market analysis, the memristor market size is projected to expand at a steady rate, with cost analysis indicating a gradual decrease in memristor prices due to technological advancements. The memristor technology roadmap reveals ongoing research and development efforts, focusing on improving device performance and expanding memristor applications. Memristor future trends include increased adoption in neuromorphic computing, artificial intelligence, and the Internet of Things (IoT). Memristor market opportunities are vast, with potential applications in energy-efficient computing, non-volatile memory, and neural networks.
- Memristor competitive analysis reveals a diverse ecosystem of players, each with unique strengths and strategies. Memristor investment opportunities exist for companies seeking to capitalize on this emerging technology. Memristor market segmentation reveals various application areas, including memory, logic, and neuromorphic computing. Memristor research continues to uncover new insights, with ongoing modeling and simulation efforts aimed at optimizing device behavior. Memristor patents are a significant aspect of the industry landscape, with numerous players vying for intellectual property rights. Memristor challenges include scaling up production and addressing reliability concerns. Memristor market dynamics are shaped by both market growth and restraints, such as competition from established memory technologies and regulatory hurdles.
- Memristor market strategies include partnerships, collaborations, and acquisitions to expand market reach and technological capabilities. Memristor standards are being established to ensure interoperability and compatibility across various applications. Memristor market forecasts indicate continued growth, driven by the unique advantages of memristor technology and its potential applications.
Dive into Technavio's robust research methodology, blending expert interviews, extensive data synthesis, and validated models for unparalleled Memristor Memory Devices Market insights. See full methodology.
|
Market Scope |
|
|
Report Coverage |
Details |
|
Page number |
184 |
|
Base year |
2023 |
|
Historic period |
2018-2022 |
|
Forecast period |
2024-2028 |
|
Growth momentum & CAGR |
Accelerate at a CAGR of 71.99% |
|
Market growth 2024-2028 |
USD 117181.7 million |
|
Market structure |
Fragmented |
|
YoY growth 2023-2024(%) |
56.2 |
|
Key countries |
US, South Korea, Germany, China, and Japan |
|
Competitive landscape |
Leading Companies, Market Positioning of Companies, Competitive Strategies, and Industry Risks |
What are the Key Data Covered in this Memristor Memory Devices Market Research and Growth Report?
- CAGR of the Memristor Memory Devices industry during the forecast period
- Detailed information on factors that will drive the growth and forecasting between 2024 and 2028
- Precise estimation of the size of the market and its contribution of the industry in focus to the parent market
- Accurate predictions about upcoming growth and trends and changes in consumer behaviour
- Growth of the market across North America, APAC, Europe, South America, and Middle East and Africa
- Thorough analysis of the market's competitive landscape and detailed information about companies
- Comprehensive analysis of factors that will challenge the memristor memory devices market growth of industry companies
We can help! Our analysts can customize this memristor memory devices market research report to meet your requirements.
 RIA -
RIA - 
