
Software-Defined Storage Market Size 2025-2029
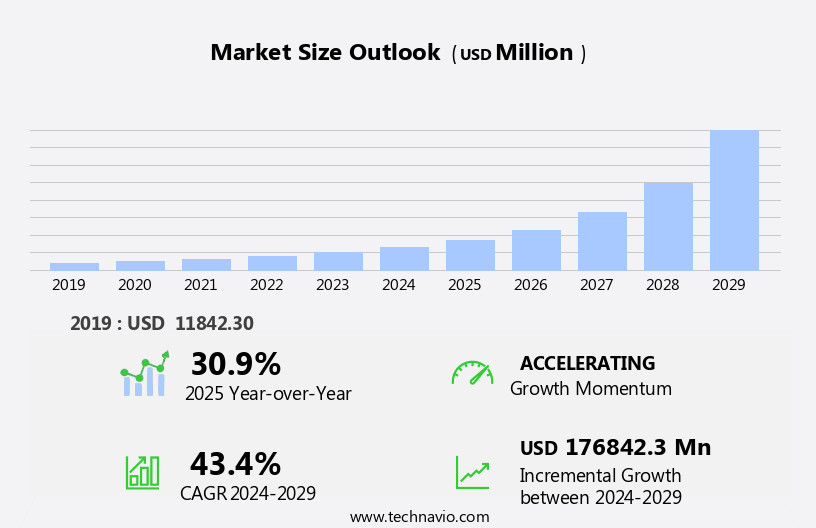
The software-defined storage (SDS) market size is forecast to increase by USD 176.84 billion at a CAGR of 43.4% between 2024 and 2029.
- The market is experiencing significant growth, driven primarily by the wave in cloud adoption and the rise of hyper-converged technology. Cloud computing's increasing popularity is leading organizations to seek more flexible and scalable storage solutions, making SDS an attractive option. Hyper-converged infrastructure, which integrates computing, storage, and networking into a single solution, is also fueling market growth. However, the high costs associated with SDS implementation can be a barrier for some organizations, particularly smaller businesses. To capitalize on this market opportunity, companies must focus on offering cost-effective solutions and providing value-added services that help customers manage and optimize their storage infrastructure.
- Additionally, partnerships and collaborations with cloud service providers and technology companies can help companies expand their reach and offer more comprehensive solutions to customers. Data security and protection are paramount concerns for IT organizations, leading to the increased adoption of SDS solutions for data encryption and recovery. Overall, the SDS market presents significant growth opportunities for companies that can navigate the challenges and provide innovative, cost-effective solutions to meet the evolving needs of organizations in today's digital landscape.
What will be the Size of the Software-Defined Storage (SDS) Market during the forecast period?
- The market is experiencing significant growth and innovation, driven by the digital transformation and exponential data growth in various sectors, including the BFSI sector, telecom industry, healthcare, and government applications. SDS enables data center solutions that are more agile, scalable, and cost-effective than traditional storage systems. With the increasing adoption of cloud storage and hyper-converged technology, SDS is becoming a preferred choice for enterprise needs. SDS solutions offer automation capabilities for process controls, data protection, and disaster recovery, making them essential for businesses in the digital economy. The integration of AI technologies and IoT devices further enhances the value proposition of SDS, enabling customer data analysis, data security, and big data management.
- The market is experiencing significant growth as businesses across various sectors, including the digital economy and emerging economies, seek to manage exponential data growth and drive digital transformation. SDS enables businesses to automate process controls, improve data protection, and enhance data center solutions through the use of artificial intelligence (AI) and container-native technologies. The SDS market is also witnessing the emergence of container-native software-defined storage and high-performance computing (HPC) solutions, catering to the specific needs of industries such as Exxact Corporation and the emerging economies. The market's direction is towards storage consolidation, data management, and scalable storage solutions that can address the demands of various industries while ensuring data security and compliance. Overall, the SDS market is poised for continued growth and innovation, driven by the evolving needs of the digital economy.
How is this Software-Defined Storage (SDS) Industry segmented?
The software-defined storage (SDS) industry research report provides comprehensive data (region-wise segment analysis), with forecasts and estimates in "USD million" for the period 2025-2029, as well as historical data from 2019-2023 for the following segments.
- End-user
- BFSI
- Telecom and IT
- Government
- Healthcare
- Others
- Component
- Solution
- Services
- Sector
- SME
- Large enterprise
- Geography
- North America
- US
- Canada
- APAC
- China
- India
- Japan
- South Korea
- Europe
- France
- Germany
- Italy
- UK
- South America
- Middle East and Africa
- North America
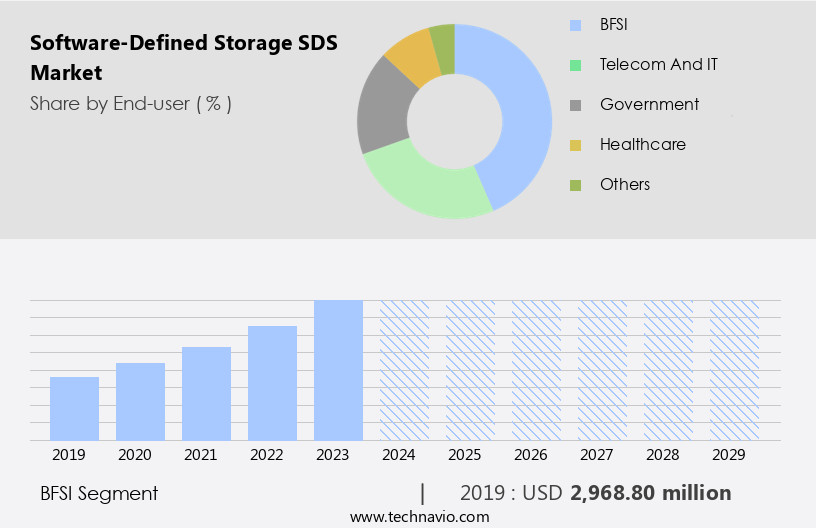
By End-user Insights
The BFSI segment is estimated to witness significant growth during the forecast period. The market is experiencing significant growth due to increasing demands from enterprises in the BFSI sector for advanced storage solutions. With the proliferation of digital channels and the digital economy, data centers and cloud storage providers are investing heavily to accommodate the expanding user base and high-bandwidth requirements. Additionally, stringent data security regulations, such as GDPR, necessitate data protection measures for sensitive user information. The emergence of new technologies, including artificial intelligence (AI), high-performance computing (HPC), and unstructured data, is driving exponential data growth.
SDS offers deployment flexibility, scalability, and a single interface for IT organizations to manage their on-premises and cloud storage effectively. The SDS market is poised for continued growth, driven by the BFSI sector's demands for flexible, secure, and cost-effective storage solutions.
Get a glance at the market report of share of various segments Request Free Sample
The BFSI segment was valued at USD 2.97 billion in 2019 and showed a gradual increase during the forecast period.
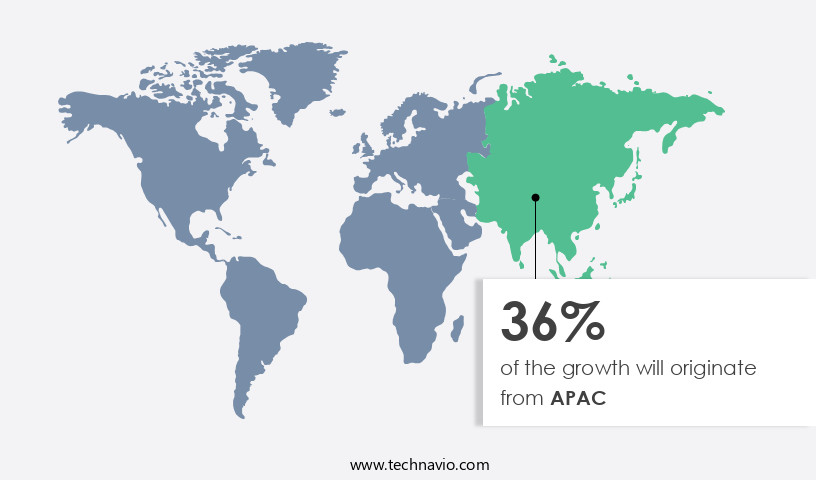
Regional Analysis
APAC is estimated to contribute 36% to the growth of the global market during the forecast period. Technavio's analysts have elaborately explained the regional trends and drivers that shape the market during the forecast period.
For more insights on the market size of various regions, Request Free Sample
The market in North America is currently the largest and is anticipated to maintain its dominance during the forecast period. The primary drivers of this market include the increasing demand for data center connectivity networks from enterprises and the upcoming 5G technology. Telecommunication service providers are actively working towards launching commercial 5G services, which is expected to boost the demand for software-defined solutions in the region. Furthermore, the healthcare sector's adoption of advanced technologies such as Artificial Intelligence (AI) is fueling the need for scalable storage architecture to manage and secure large volumes of unstructured data.
The BFSI sector, cloud storage, container-native SDS, customer data analysis, and data security are other significant areas driving the growth of the North American SDS market. The market offers deployment flexibility, digital channels, and single interface solutions, catering to the digital economy and digital transformation initiatives in various industries. Emerging economies and the public sector are also adopting software-defined infrastructure to address exponential data growth and security concerns. High-Performance Computing (HPC) and data center solutions are other potential growth areas for the market. The market caters to IT organizations, internet users, and online payments, offering solutions that meet their specific requirements while ensuring data security and compliance.
Market Dynamics
Our researchers analyzed the data with 2024 as the base year, along with the key drivers, trends, and challenges. A holistic analysis of drivers will help companies refine their marketing strategies to gain a competitive advantage.
What are the key market drivers leading to the rise in the adoption of Software-Defined Storage (SDS) Industry?
- Wave in cloud adoption is the key driver of the market. Software-defined storage (SDS) is an essential component of cloud computing, enabling organizations to manage data storage more efficiently and cost-effectively. By utilizing a network of remote servers over traditional local servers or personal computers, businesses can save significantly on storage costs, with annual savings estimated to be over 35%. The global SDS market is witnessing substantial growth, driven primarily by the increasing adoption of cloud solutions. Cloud computing offers advantages such as cost reduction, improved scalability, and enhanced efficiency, making it an attractive option for businesses.
- SDS plays a pivotal role in addressing data management challenges in cloud environments by simplifying storage management processes. This allows businesses to focus on their core competencies while ensuring optimal use of their IT resources. The adoption of SDS is expected to continue its upward trajectory, as more organizations embrace the benefits of cloud computing.
What are the market trends shaping the Software-Defined Storage (SDS) Industry?
- Rise of hyper-converged technology is the upcoming market trend. Hyper-converged infrastructure (HCI) represents a software-defined, unified system that consolidates storage, computing, networking, and management components in a single solution. This approach eliminates the reliance on multiple systems and enables the virtualization of all three components, leading to improved resource utilization. HCI offers several advantages, including increased IT efficiency by eliminating manual processes and siloed operational expertise, optimization of space, and reduction of power consumption.
- As a result, data centers achieve greater agility, speed, and efficiency. Ideal for small and medium-sized enterprises, HCI simplifies the management of computing, storage, and networks through centralized control. The technology's benefits include enhanced resource utilization, simplified management, and reduced operational costs.
What challenges does the Software-Defined Storage (SDS) Industry face during its growth?
- High costs associated with software-defined storage is a key challenge affecting the industry growth. The market offers enterprises the opportunity to consolidate their data center infrastructure, leading to reduced capital and operational expenditures. Companies provide various SDS solutions, including hyper-converged infrastructure, primary storage, secondary storage, object storage, and cloud storage. However, storage consolidation poses a challenge as enterprises may need multiple solutions based on their specific requirements. Some companies charge upfront licensing fees based on storage capacity.
- Failure to fully utilize the existing storage infrastructure with SDS solutions could result in substantial losses for enterprises. Thus, it is crucial for businesses to carefully evaluate their storage needs and select the most suitable SDS solution.
Exclusive Customer Landscape
The software-defined storage (SDS) market forecasting report includes the adoption lifecycle of the market, covering from the innovator's stage to the laggard's stage. It focuses on adoption rates in different regions based on penetration. Furthermore, the software-defined storage (SDS) market report also includes key purchase criteria and drivers of price sensitivity to help companies evaluate and develop their market growth analysis strategies.
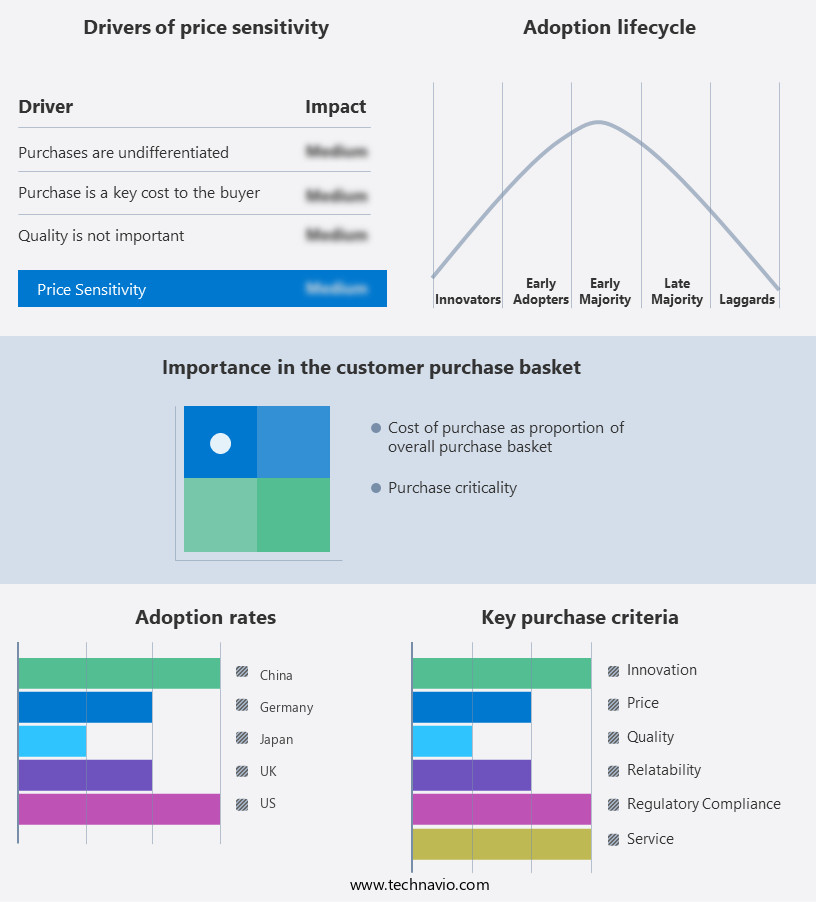
Customer Landscape
Key Companies & Market Insights
Companies are implementing various strategies, such as strategic alliances, software-defined storage (SDS) market forecast, partnerships, mergers and acquisitions, geographical expansion, and product/service launches, to enhance their presence in the industry.
Broadcom Inc. - The company offers software-defined storage that includes open compute project foundation, Broadview, open daylight, open networking foundation that uses software based controllers or application programming interfaces to communicate with underlying hardware infrastructure and direct traffic on a network.
The industry research and growth report includes detailed analyses of the competitive landscape of the market and information about key companies, including:
- Broadcom Inc.
- Cisco Systems Inc.
- Citrix Systems Inc.
- DataCore Software Corp.
- DataDirect Networks Inc.
- Dell Technologies Inc.
- Fujitsu Ltd.
- Hewlett Packard Enterprise Co.
- Hitachi Vantara LLC
- Huawei Technologies Co. Ltd.
- International Business Machines Corp.
- Lenovo Group Ltd.
- Microsoft Corp.
- NetApp Inc.
- Nutanix Inc.
- Oracle Corp.
- Pure Storage Inc.
- Red Hat Inc.
- Telefonaktiebolaget LM Ericsson
- VMware Inc.
Qualitative and quantitative analysis of companies has been conducted to help clients understand the wider business environment as well as the strengths and weaknesses of key industry players. Data is qualitatively analyzed to categorize companies as pure play, category-focused, industry-focused, and diversified; it is quantitatively analyzed to categorize companies as dominant, leading, strong, tentative, and weak.
Research Analyst Overview
The digital economy is experiencing exponential data growth, fueled by the increasing adoption of digital channels and the proliferation of internet users. This data explosion is driving the need for more efficient and scalable storage solutions. Traditional storage methods, which rely on hardware-based infrastructure, are no longer able to keep pace with the demands of modern IT organizations. Enter Software-Defined Storage (SDS), an innovative approach to data storage that offers numerous benefits to businesses across various sectors. SDS is a new technology that decouples the storage controller from the physical storage, enabling IT organizations to manage their data infrastructure through software.
This approach offers several advantages, including deployment flexibility, high-performance computing (HPC) capabilities, and data security. One of the most significant benefits of SDS is its flexibility. In today's rapidly changing business landscape, organizations need the ability to quickly adapt to new requirements and deploy new applications. SDS allows businesses to easily deploy and manage their storage infrastructure, regardless of the underlying hardware. This flexibility is particularly important for organizations in the BFSI sector, where stringent regulatory requirements and the need for high availability make it essential to have a flexible and agile storage infrastructure. Another key benefit of SDS is its ability to support new technologies, such as container-native storage and high-performance computing.
Container-native storage is becoming increasingly popular as organizations adopt containerized applications, and SDS offers a scalable and efficient solution for managing container data. HPC applications, which require large amounts of computing power and data storage, also benefit from SDS's flexibility and performance. Data security is another critical concern for IT organizations, particularly in the public sector. SDS offers advanced security features, including encryption, access control, and data masking. These features help ensure that sensitive data is protected, both in transit and at rest. Customer data analysis is another area where SDS shines. With the increasing amount of data being generated, organizations need to be able to analyze this data to gain insights and make informed decisions.
SDS offers a single interface for managing and accessing data, making it easier for organizations to analyze their data and gain valuable insights. Cloud storage is another area where SDS is making a significant impact. Cloud storage offers numerous benefits, including scalability, cost savings, and ease of deployment. SDS enables organizations to easily deploy and manage their cloud storage infrastructure, providing them with the flexibility and control they need to meet their business requirements. The emergence of SDS is also driving innovation in the data center solutions market. Traditional hardware-based storage solutions are being replaced by software-defined infrastructure, which offers greater flexibility, scalability, and efficiency.
This shift is particularly significant in emerging economies, where the need for cost-effective and scalable storage solutions is high. The Software-Defined Storage market is poised for significant growth, driven by the increasing need for more efficient and scalable storage solutions. SDS offers numerous benefits, including deployment flexibility, high-performance computing capabilities, data security, and support for new technologies. As the digital economy continues to grow, the demand for SDS is only going to increase, making it an exciting and dynamic market to watch.
|
Market Scope |
|
|
Report Coverage |
Details |
|
Page number |
230 |
|
Base year |
2024 |
|
Historic period |
2019-2023 |
|
Forecast period |
2025-2029 |
|
Growth momentum & CAGR |
Accelerate at a CAGR of 43.4% |
|
Market growth 2025-2029 |
USD 176.84 Billion |
|
Market structure |
Fragmented |
|
YoY growth 2024-2025(%) |
30.9 |
|
Key countries |
US, China, Japan, Germany, Canada, India, UK, France, South Korea, and Italy |
|
Competitive landscape |
Leading Companies, Market Positioning of Companies, Competitive Strategies, and Industry Risks |
What are the Key Data Covered in this Software-Defined Storage (SDS) Market Research and Growth Report?
- CAGR of the Software-Defined Storage (SDS) industry during the forecast period
- Detailed information on factors that will drive the growth and forecasting between 2025 and 2029
- Precise estimation of the size of the market and its contribution of the industry in focus to the parent market
- Accurate predictions about upcoming growth and trends and changes in consumer behaviour
- Growth of the market across North America, APAC, Europe, South America, and Middle East and Africa
- Thorough analysis of the market's competitive landscape and detailed information about companies
- Comprehensive analysis of factors that will challenge the software-defined storage (SDS) market growth and forecasting
We can help! Our analysts can customize this software-defined storage (SDS) market research report to meet your requirements.
 RIA -
RIA - 
