Metaverse in Travel and Tourism Market Analysis North America, Europe, APAC, South America, Middle East and Africa - US, Canada, China, Germany, UK - Size and Forecast 2024-2028

Metaverse in Travel and Tourism Market Analysis North America, Europe, APAC, South America, Middle East and Africa - US, Canada, China, Germany, UK - Size and Forecast 2024-2028

Published: Mar 2024 160 Pages SKU: IRTNTR73410

Market Overview at a Glance

$155.17 B
Market Opportunity
26.76%
CAGR
26.24
YoY growth 2023-2024(%)

Metaverse Market in Travel and Tourism Market Size 2024-2028 

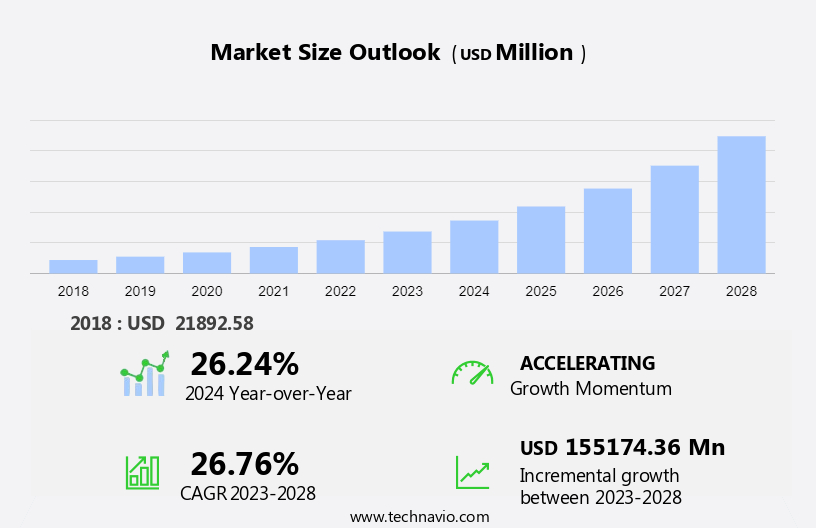
The metaverse market in travel and tourism market size is forecast to increase by USD 155.17 billion at a CAGR of 26.76% between 2023 and 2028. In the dynamic realm of technology, the metaverse market in travel and tourism is experiencing significant growth. Key drivers include the surging demand for great technologies such as Augmented Reality (AR) and Virtual Reality (VR), which offer unprecedented experiential opportunities for travelers. Furthermore, the metaverse's application in travel and tourism is on the rise, with developments in this sector revolutionizing the way we explore and experience destinations. However, this burgeoning market is not without challenges. High development costs associated with AR and VR applications pose a significant barrier to entry for many players. Despite these hurdles, the metaverse's potential to transform travel and tourism is undeniable, making it an exciting and innovative space to watch.

Metaverse Market in Travel and Tourism Market Size

 Request Free Sample

The market in the Travel and Tourism industry is experiencing significant advancements with the integration of Augmented Reality (AR), Virtual Reality (VR), and Mixed Reality (MR) technologies. Metaverse devices such as VR headsets, MR headsets, smart glasses, and smart helmets are transforming the gaming experience for tourists, offering tailored metaverses and digital twins for great exploration. Investments in the Metaverse sector are on the rise, driven by the potential for additional revenue and deployable use cases in the travel industry. The medical sector is also exploring the benefits of Metaverse technology for training and simulation purposes. Advancements in 3D modeling and the use of Unreal Engine are enhancing the realism and interactivity of Metaverse experiences.

However, challenges such as eye strain, dizziness, nausea, myopia, low resolution, and virtual sickness remain concerns for users. Electromagnetic frequency emissions from Metaverse devices are another issue that requires attention. As the Metaverse market continues to evolve, timelines for human resource development and business performance optimization will be crucial for success. Blockchain technology is expected to play a role in securing transactions and ensuring data privacy in the Metaverse travel and tourism market. Overall, the Metaverse market holds immense potential for innovation and growth in the travel industry.

Market Segmentation

The market research report provides comprehensive data (region-wise segment analysis), with forecasts and estimates in "USD billion" for 2024-2028, as well as historical data from 2018-2022 for the following segments.

  • Application
    • AR
    • MR
    • Blockchain
    • XR
    • VR
  • Component
    • Hardware
    • Software
    • Services
  • Geography
    • North America
      • Canada
      • US
    • Europe
      • Germany
      • UK
    • APAC
      • China
    • South America
    • Middle East and Africa

By Application Insights

The AR segment is estimated to witness significant growth during the forecast period. The metaverse market in travel and tourism is experiencing significant advancements with the integration of Augmented Reality (AR), Virtual Reality (VR), and Mixed Reality (MR) technologies. According to industry estimates, this sector is expected to witness substantial growth, driven by the adoption of HMDs (Head-Mounted Displays) such as VR headsets, MR headsets, smart glasses, and smart helmets. These technologies offer tailored metaverses for travelers, providing great gaming experiences and personalized explorations. Investments in the metaverse market are on the rise, with developments in the medical sector showcasing digital twins, blockchain, artificial intelligence (AI), and machine learning (ML) for healthcare providers.

Furthermore, advancements in programming and cybersecurity concerns are being addressed to ensure negligence and oversight are minimized. AR and VR technologies are revolutionizing traveler experiences by enabling real-time navigation and information, simplifying exploration in unfamiliar locales. The convergence of these technologies with AI and ML offers personalized experiences, enhancing traveler engagement. However, concerns regarding health effects, cybersecurity, regulations, defined standards, taxation, and experiential training are being addressed to ensure a seamless and safe user experience. For instance, preflight checks, integration, weapon training, and flight training simulations are being developed to ensure safety and efficiency in various sectors. In summary, the metaverse market in travel and tourism is undergoing significant advancements, driven by the adoption of AR, VR, and MR technologies, investments, and tailored metaverses. Addressing concerns regarding health effects, cybersecurity, regulations, and defined standards is crucial for the continued growth and success of this sector.

Metaverse Market in Travel and Tourism Market Size

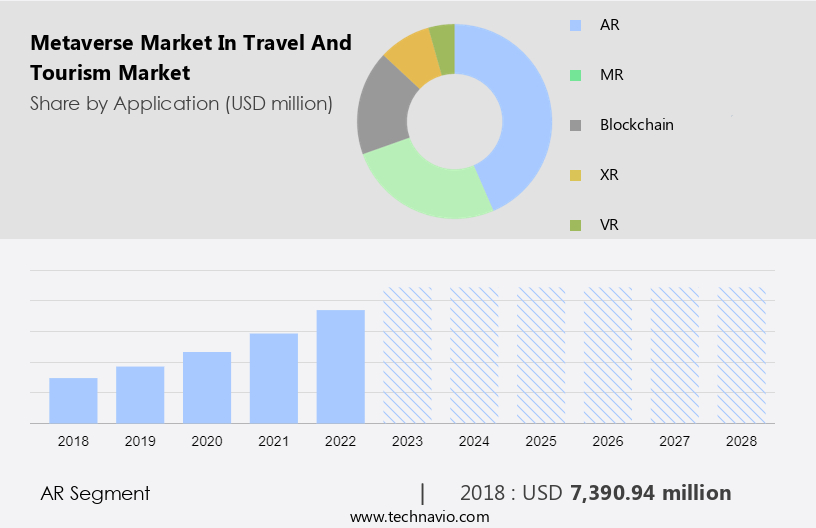
Get a glance at the market share of various segments Request Free Sample

The AR segment was valued at USD 7.39 billion in 2018 and showed a gradual increase during the forecast period.

Regional Insights

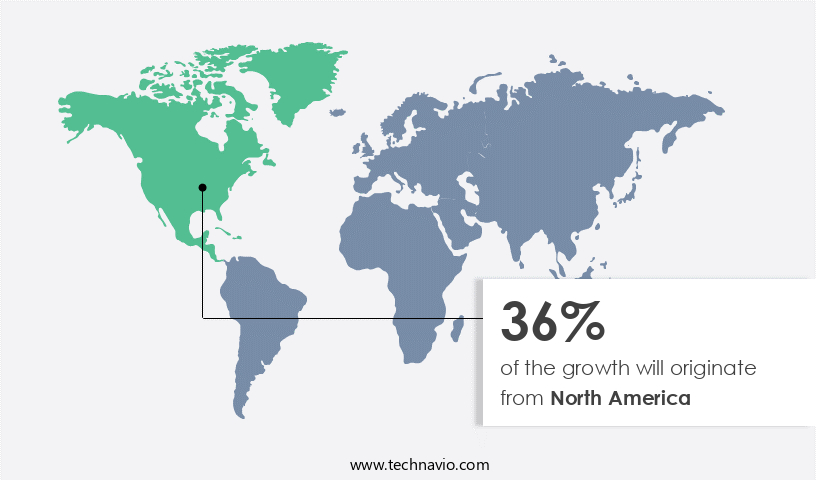
North America is estimated to contribute 36% to the growth of the global market during the forecast period. Technavio's analysts have elaborately explained the regional trends and drivers that shape the market during the forecast period.

Metaverse Market in Travel and Tourism Market Share by Geography

For more insights on the market share of various regions Request Free Sample

The metaverse market in North America's travel and tourism industry is experiencing substantial expansion, fueled by technological innovations, escalating consumer preference for great experiences, and a thriving tourism sector. Metaverse devices, such as virtual reality (VR) and augmented reality (AR) headsets, are revolutionizing the way travelers explore destinations, plan trips, and interact with tourism-related content. However, the use of these devices may result in injuries, headaches, eye strain, dizziness, nausea, and myopia, collectively referred to as "virtual sickness." To mitigate these issues, timelines for device usage and human resource training are essential. Investment from major technology and entertainment brands in metaverse platforms and experiences is driving innovation in the travel and tourism sectors.

Furthermore, virtual tours of iconic landmarks, great travel planning tools, and virtual reality-based entertainment experiences are gaining popularity. Brands and advertisers are capitalizing on these trends through marketing campaigns, virtual events, and video games. Game developers are creating deployable use cases, including gaming applications and interactive 3D media, to enhance business performance. AR technology is particularly noteworthy, as it offers participation effects that blur the line between the real world and the metaverse. Gaming applications, such as mobile-based and tablet-based portable gaming, are increasingly popular, providing a more engaging and interactive experience for users. However, concerns regarding electromagnetic frequency emissions from metaverse devices may impact consumer adoption.

Furthermore, 3D modeling and Unreal Engine are essential tools for creating great metaverse experiences. These technologies enable the development of high-resolution, realistic environments, animated objects, and playing fields that mimic real-world climate. As the metaverse market continues to evolve, it is expected to generate additional revenue streams for businesses and create new growth opportunities.

Our researchers analyzed the data with 2023 as the base year, along with the key drivers, trends, and challenges. A holistic analysis of drivers will help companies refine their marketing strategies to gain a competitive advantage.

Market Driver

The increasing demand for AR and VR technology is the key driver of the market. The Metaverse market in the travel and tourism industry is experiencing notable advancements, driven by the integration of AR and VR technologies. According to industry estimates, this sector is expected to witness substantial investments in the coming years. Metaverse, a blend of AR, VR, and MR technologies, offers unparalleled experiences through VR headsets, MR headsets, smart glasses, and smart helmets. In the travel industry, metaverse applications include creating digital avatars, VR tours, and interactive hotel elements. These tailored metaverses provide personalized experiences, allowing healthcare providers to offer experiential training, preflight checks, and simulations for weapon training and flight training.

Furthermore, the convergence of HMDs and health concerns is also paving the way for advancements in the medical sector, with the development of digital twins, AI, and ML. However, the Metaverse market also faces challenges, such as cybersecurity concerns, regulations, and defined standards. Negligence and oversight from developers can lead to potential risks, making it crucial for cybersecurity measures and taxation policies to be put in place. As the market continues to evolve, it is essential to address these concerns and ensure convergence within the industry.

Market Trends

The rise in developments in use of metaverse in travel and tourism industry is the upcoming trend in the market. The metaverse market in travel and tourism is experiencing substantial growth, with estimations suggesting that AR, VR, and MR technologies will revolutionize the sector. Companies are investing in metaverse solutions, such as VR headsets, MR headsets, smart glasses, and smart helmets, to offer tailored gaming experiences and enhance customer engagement. LynKey International Ltd., a tourism startup, recently announced a USD 8 billion project to tokenize and offer NFT and metaverse solutions for the industry. This project utilizes blockchain, AI, and ML to create personalized experiences for travelers. Advancements in the metaverse are not limited to the travel and tourism sector.

Furthermore, the medical sector is also exploring the potential of digital twins and simulations for experiential training and preflight checks. However, as technology converges, cybersecurity concerns and the need for defined standards, taxation, and regulations become increasingly important. Developers must ensure negligence and oversight are minimized, and cybersecurity measures are in place to protect users' data. Moreover, the integration of metaverse technologies in travel and tourism presents opportunities for new revenue streams, such as weapon training, flight training, and simulations. HMDs are becoming essential tools for healthcare providers to offer great and effective treatments. However, the implementation of these technologies requires careful programming and integration to ensure a seamless user experience.

Overall, the metaverse market in travel and tourism is poised for significant growth, with the potential to transform the way we travel and experience new places.

Market Challenge

The high development costs associated with AR and VR apps is a key challenge affecting the market growth. The Metaverse market in the travel and tourism industry is experiencing significant advancements with the integration of Augmented Reality (AR), Virtual Reality (VR), and Mixed Reality (MR) technologies. Estimations suggest that the use of VR headsets, MR headsets, smart glasses, and smart helmets in this sector will lead to substantial investments. Tailored metaverses offer personalized gaming experiences, allowing healthcare providers to utilize digital twins for experiential training and preflight checks. AR and VR technologies enable the creation of great and interactive environments, enhancing the travel experience. The cost of developing such content, including the use of 360-degree cameras and computer graphics, ranges from USD 50,000 to USD 100,000.

Furthermore, advancements in AI and ML are further enriching these experiences by providing customized recommendations and simulations. However, the development of metaverses in travel and tourism comes with cybersecurity concerns and regulatory oversight. Negligence and lack of defined standards can lead to potential risks. Taxation and integration with existing systems are also crucial considerations. In the gaming sector, metaverses offer weapon training, flight training, and simulations, providing a more engaging and interactive experience. The convergence of HMDs and health concerns is another area of focus, with potential applications in medical sector training and rehabilitation. Despite these challenges, the future of metaverses in travel and tourism is promising, with potential applications in experiential training, preflight checks, and integration with existing systems. Developers must address cybersecurity concerns and regulatory compliance to ensure a successful and secure implementation.

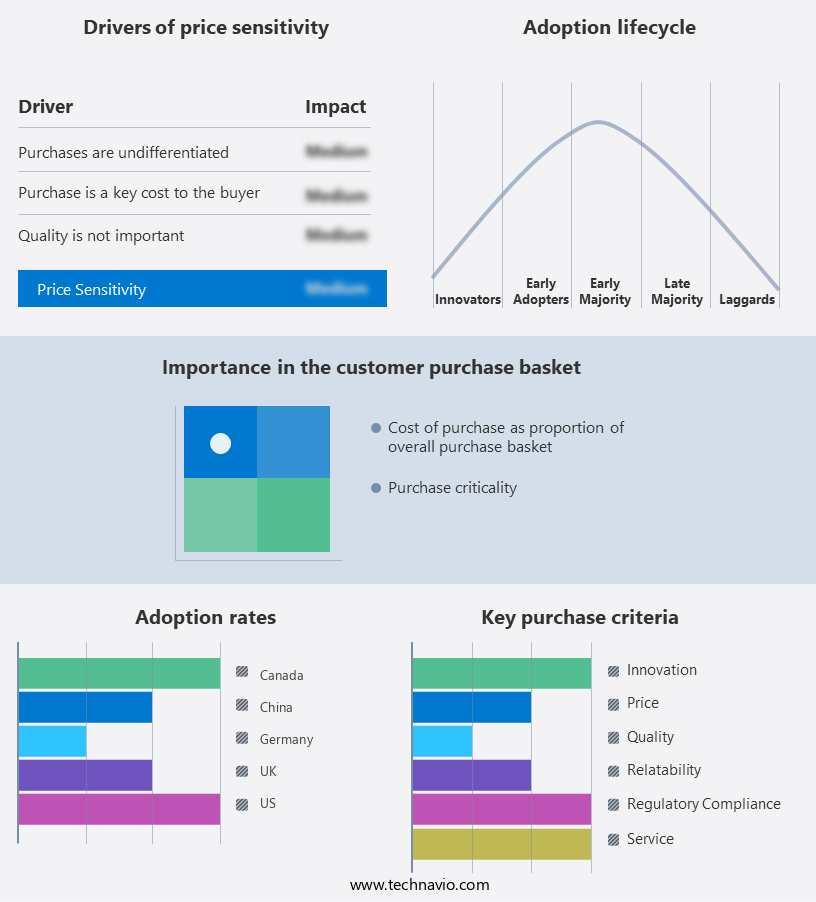
Exclusive Customer Landscape

The market forecasting report includes the adoption lifecycle of the market, covering from the innovator's stage to the laggard's stage. It focuses on adoption rates in different regions based on penetration. Furthermore, the report also includes key purchase criteria and drivers of price sensitivity to help companies evaluate and develop their market growth analysis strategies.

Metaverse Market in Travel and Tourism Market Share by Geography

 Customer Landscape

Key Companies & Market Insights

Companies are implementing various strategies, such as strategic alliances, partnerships, mergers and acquisitions, geographical expansion, and product/service launches, to enhance their presence in the market.

Accenture Plc- The company offers metaverse in travel and tourism, such as XR, for unique traveler experiences.

The market research and growth report includes detailed analyses of the competitive landscape of the market and information about key companies, including:

  • Ariva Digital
  • Infosys Ltd.
  • LynKey International Ltd.
  • Marriott International Inc.
  • Metaverse Seoul
  • Qatar Airways
  • Rendezverse

Qualitative and quantitative analysis of companies has been conducted to help clients understand the wider business environment as well as the strengths and weaknesses of key market players. Data is qualitatively analyzed to categorize companies as pure play, category-focused, industry-focused, and diversified; it is quantitatively analyzed to categorize companies as dominant, leading, strong, tentative, and weak.

Research Analyst Overview

The market in travel and tourism is an emerging trend, offering unique experiences to consumers. This virtual environment enables tourists to explore destinations in a more great and interactive way. Heads of travel and tourism companies are recognizing the potential of Metaverses in enhancing customer engagement and generating new revenue streams. Metaverses in travel and tourism provide a realistic and engaging experience, allowing users to visit various destinations, attend events, and even book accommodations. These virtual platforms offer a more personalized and convenient experience, as users can plan their trips, make reservations, and even interact with travel agents within the Metaverse.

Moreover, Metaverses provide an excellent opportunity for businesses to showcase their offerings more interactively and engagingly. For instance, hotels and resorts can offer virtual tours, allowing potential customers to explore their properties before making a booking. Similarly, travel agencies can offer customized travel packages, providing users with a more personalized and tailored experience. The Metaverse market in travel and tourism is poised to revolutionize the industry, offering a more great and interactive experience to consumers. Heads of travel and tourism companies are recognizing the potential of Metaverses and are investing in this technology to enhance customer engagement and generate new revenue streams.

Market Scope

Report Coverage

Details

Page number

160

Base year

2023

Historic period

2018-2022

Forecast period

2024-2028

Growth momentum & CAGR

Accelerate at a CAGR of 26.76%

Market growth 2024-2028

USD 155.17 billion

Market structure

Concentrated

YoY growth 2023-2024(%)

26.24

Regional analysis

North America, Europe, APAC, South America, and Middle East and Africa

Performing market contribution

North America at 36%

Key countries

US, Canada, China, Germany, and UK

Competitive landscape

Leading Companies, Market Positioning of Companies, Competitive Strategies, and Industry Risks

Key companies profiled

Ariva Digital, Infosys Ltd., LynKey International Ltd., Marriott International Inc., Metaverse Seoul, Qatar Airways, and Rendezverse

Market dynamics

Parent market analysis, market growth inducers and obstacles, market forecast, fast-growing and slow-growing segment analysis, COVID-19 impact and recovery analysis and future consumer dynamics, market condition analysis for the forecast period

Customization purview

If our market report has not included the data that you are looking for, you can reach out to our analysts and get segments customized.

Request Free Sample

What are the Key Data Covered in this Market Research and Growth Report?

  • CAGR of the market during the forecast period
  • Detailed information on factors that will drive the market growth and forecasting between 2024 and 2028
  • Precise estimation of the size of the market  and its contribution of the market in focus to the parent market
  • Accurate predictions about upcoming market growth and trends and changes in consumer behaviour
  • Growth of the market across North America, Europe, APAC, South America, and Middle East and Africa
  • Thorough analysis of the market's competitive landscape and detailed information about companies
  • Comprehensive analysis of factors that will challenge the growth of market companies

We can help! Our analysts can customize this market research report to meet your requirements. Get in touch

1 Executive Summary

  • 1.1 Market overview
    • Exhibit 01: Executive Summary – Chart on Market Overview
    • Exhibit 02: Executive Summary – Data Table on Market Overview
    • Exhibit 03: Executive Summary – Chart on Global Market Characteristics
    • Exhibit 04: Executive Summary – Chart on Market by Geography
    • Exhibit 05: Executive Summary – Chart on Market Segmentation by Application
    • Exhibit 06: Executive Summary – Chart on Market Segmentation by Component
    • Exhibit 07: Executive Summary – Chart on Incremental Growth
    • Exhibit 08: Executive Summary – Data Table on Incremental Growth
    • Exhibit 09: Executive Summary – Chart on Vendor Market Positioning

2 Market Landscape

  • 2.1 Market ecosystem
    • Exhibit 10: Parent market
    • Exhibit 11: Market Characteristics

3 Market Sizing

  • 3.1 Market definition
    • Exhibit 12: Offerings of vendors included in the market definition
  • 3.2 Market segment analysis
    • Exhibit 13: Market segments
  • 3.3 Market size 2023
    • 3.4 Market outlook: Forecast for 2023-2028
      • Exhibit 14: Chart on Global - Market size and forecast 2023-2028 ($ million)
      • Exhibit 15: Data Table on Global - Market size and forecast 2023-2028 ($ million)
      • Exhibit 16: Chart on Global Market: Year-over-year growth 2023-2028 (%)
      • Exhibit 17: Data Table on Global Market: Year-over-year growth 2023-2028 (%)

    4 Historic Market Size

    • 4.1 Global metaverse market in travel and tourism industry 2018 - 2022
      • Exhibit 18: Historic Market Size – Data Table on global metaverse market in travel and tourism industry 2018 - 2022 ($ million)
    • 4.2 Application Segment Analysis 2018 - 2022
      • Exhibit 19: Historic Market Size – Application Segment 2018 - 2022 ($ million)
    • 4.3 Component Segment Analysis 2018 - 2022
      • Exhibit 20: Historic Market Size – Component Segment 2018 - 2022 ($ million)
    • 4.4 Geography Segment Analysis 2018 - 2022
      • Exhibit 21: Historic Market Size – Geography Segment 2018 - 2022 ($ million)
    • 4.5 Country Segment Analysis 2018 - 2022
      • Exhibit 22: Historic Market Size – Country Segment 2018 - 2022 ($ million)

    5 Five Forces Analysis

    • 5.1 Five forces summary
      • Exhibit 23: Five forces analysis - Comparison between 2023 and 2028
    • 5.2 Bargaining power of buyers
      • Exhibit 24: Chart on Bargaining power of buyers – Impact of key factors 2023 and 2028
    • 5.3 Bargaining power of suppliers
      • Exhibit 25: Bargaining power of suppliers – Impact of key factors in 2023 and 2028
    • 5.4 Threat of new entrants
      • Exhibit 26: Threat of new entrants – Impact of key factors in 2023 and 2028
    • 5.5 Threat of substitutes
      • Exhibit 27: Threat of substitutes – Impact of key factors in 2023 and 2028
    • 5.6 Threat of rivalry
      • Exhibit 28: Threat of rivalry – Impact of key factors in 2023 and 2028
    • 5.7 Market condition
      • Exhibit 29: Chart on Market condition - Five forces 2023 and 2028

    6 Market Segmentation by Application

    • 6.1 Market segments
      • Exhibit 30: Chart on Application - Market share 2023-2028 (%)
      • Exhibit 31: Data Table on Application - Market share 2023-2028 (%)
    • 6.2 Comparison by Application
      • Exhibit 32: Chart on Comparison by Application
      • Exhibit 33: Data Table on Comparison by Application
    • 6.3 AR - Market size and forecast 2023-2028
      • Exhibit 34: Chart on AR - Market size and forecast 2023-2028 ($ million)
      • Exhibit 35: Data Table on AR - Market size and forecast 2023-2028 ($ million)
      • Exhibit 36: Chart on AR - Year-over-year growth 2023-2028 (%)
      • Exhibit 37: Data Table on AR - Year-over-year growth 2023-2028 (%)
    • 6.4 MR - Market size and forecast 2023-2028
      • Exhibit 38: Chart on MR - Market size and forecast 2023-2028 ($ million)
      • Exhibit 39: Data Table on MR - Market size and forecast 2023-2028 ($ million)
      • Exhibit 40: Chart on MR - Year-over-year growth 2023-2028 (%)
      • Exhibit 41: Data Table on MR - Year-over-year growth 2023-2028 (%)
    • 6.5 Blockchain - Market size and forecast 2023-2028
      • Exhibit 42: Chart on Blockchain - Market size and forecast 2023-2028 ($ million)
      • Exhibit 43: Data Table on Blockchain - Market size and forecast 2023-2028 ($ million)
      • Exhibit 44: Chart on Blockchain - Year-over-year growth 2023-2028 (%)
      • Exhibit 45: Data Table on Blockchain - Year-over-year growth 2023-2028 (%)
    • 6.6 XR - Market size and forecast 2023-2028
      • Exhibit 46: Chart on XR - Market size and forecast 2023-2028 ($ million)
      • Exhibit 47: Data Table on XR - Market size and forecast 2023-2028 ($ million)
      • Exhibit 48: Chart on XR - Year-over-year growth 2023-2028 (%)
      • Exhibit 49: Data Table on XR - Year-over-year growth 2023-2028 (%)
    • 6.7 VR - Market size and forecast 2023-2028
      • Exhibit 50: Chart on VR - Market size and forecast 2023-2028 ($ million)
      • Exhibit 51: Data Table on VR - Market size and forecast 2023-2028 ($ million)
      • Exhibit 52: Chart on VR - Year-over-year growth 2023-2028 (%)
      • Exhibit 53: Data Table on VR - Year-over-year growth 2023-2028 (%)
    • 6.8 Market opportunity by Application
      • Exhibit 54: Market opportunity by Application ($ million)
      • Exhibit 55: Data Table on Market opportunity by Application ($ million)

    7 Market Segmentation by Component

    • 7.1 Market segments
      • Exhibit 56: Chart on Component - Market share 2023-2028 (%)
      • Exhibit 57: Data Table on Component - Market share 2023-2028 (%)
    • 7.2 Comparison by Component
      • Exhibit 58: Chart on Comparison by Component
      • Exhibit 59: Data Table on Comparison by Component
    • 7.3 Hardware - Market size and forecast 2023-2028
      • Exhibit 60: Chart on Hardware - Market size and forecast 2023-2028 ($ million)
      • Exhibit 61: Data Table on Hardware - Market size and forecast 2023-2028 ($ million)
      • Exhibit 62: Chart on Hardware - Year-over-year growth 2023-2028 (%)
      • Exhibit 63: Data Table on Hardware - Year-over-year growth 2023-2028 (%)
    • 7.4 Software - Market size and forecast 2023-2028
      • Exhibit 64: Chart on Software - Market size and forecast 2023-2028 ($ million)
      • Exhibit 65: Data Table on Software - Market size and forecast 2023-2028 ($ million)
      • Exhibit 66: Chart on Software - Year-over-year growth 2023-2028 (%)
      • Exhibit 67: Data Table on Software - Year-over-year growth 2023-2028 (%)
    • 7.5 Services - Market size and forecast 2023-2028
      • Exhibit 68: Chart on Services - Market size and forecast 2023-2028 ($ million)
      • Exhibit 69: Data Table on Services - Market size and forecast 2023-2028 ($ million)
      • Exhibit 70: Chart on Services - Year-over-year growth 2023-2028 (%)
      • Exhibit 71: Data Table on Services - Year-over-year growth 2023-2028 (%)
    • 7.6 Market opportunity by Component
      • Exhibit 72: Market opportunity by Component ($ million)
      • Exhibit 73: Data Table on Market opportunity by Component ($ million)

    8 Customer Landscape

    • 8.1 Customer landscape overview
      • Exhibit 74: Analysis of price sensitivity, lifecycle, customer purchase basket, adoption rates, and purchase criteria

    9 Geographic Landscape

    • 9.1 Geographic segmentation
      • Exhibit 75: Chart on Market share by geography 2023-2028 (%)
      • Exhibit 76: Data Table on Market share by geography 2023-2028 (%)
    • 9.2 Geographic comparison
      • Exhibit 77: Chart on Geographic comparison
      • Exhibit 78: Data Table on Geographic comparison
    • 9.3 North America - Market size and forecast 2023-2028
      • Exhibit 79: Chart on North America - Market size and forecast 2023-2028 ($ million)
      • Exhibit 80: Data Table on North America - Market size and forecast 2023-2028 ($ million)
      • Exhibit 81: Chart on North America - Year-over-year growth 2023-2028 (%)
      • Exhibit 82: Data Table on North America - Year-over-year growth 2023-2028 (%)
    • 9.4 Europe - Market size and forecast 2023-2028
      • Exhibit 83: Chart on Europe - Market size and forecast 2023-2028 ($ million)
      • Exhibit 84: Data Table on Europe - Market size and forecast 2023-2028 ($ million)
      • Exhibit 85: Chart on Europe - Year-over-year growth 2023-2028 (%)
      • Exhibit 86: Data Table on Europe - Year-over-year growth 2023-2028 (%)
    • 9.5 APAC - Market size and forecast 2023-2028
      • Exhibit 87: Chart on APAC - Market size and forecast 2023-2028 ($ million)
      • Exhibit 88: Data Table on APAC - Market size and forecast 2023-2028 ($ million)
      • Exhibit 89: Chart on APAC - Year-over-year growth 2023-2028 (%)
      • Exhibit 90: Data Table on APAC - Year-over-year growth 2023-2028 (%)
    • 9.6 South America - Market size and forecast 2023-2028
      • Exhibit 91: Chart on South America - Market size and forecast 2023-2028 ($ million)
      • Exhibit 92: Data Table on South America - Market size and forecast 2023-2028 ($ million)
      • Exhibit 93: Chart on South America - Year-over-year growth 2023-2028 (%)
      • Exhibit 94: Data Table on South America - Year-over-year growth 2023-2028 (%)
    • 9.7 Middle East and Africa - Market size and forecast 2023-2028
      • Exhibit 95: Chart on Middle East and Africa - Market size and forecast 2023-2028 ($ million)
      • Exhibit 96: Data Table on Middle East and Africa - Market size and forecast 2023-2028 ($ million)
      • Exhibit 97: Chart on Middle East and Africa - Year-over-year growth 2023-2028 (%)
      • Exhibit 98: Data Table on Middle East and Africa - Year-over-year growth 2023-2028 (%)
    • 9.8 US - Market size and forecast 2023-2028
      • Exhibit 99: Chart on US - Market size and forecast 2023-2028 ($ million)
      • Exhibit 100: Data Table on US - Market size and forecast 2023-2028 ($ million)
      • Exhibit 101: Chart on US - Year-over-year growth 2023-2028 (%)
      • Exhibit 102: Data Table on US - Year-over-year growth 2023-2028 (%)
    • 9.9 China - Market size and forecast 2023-2028
      • Exhibit 103: Chart on China - Market size and forecast 2023-2028 ($ million)
      • Exhibit 104: Data Table on China - Market size and forecast 2023-2028 ($ million)
      • Exhibit 105: Chart on China - Year-over-year growth 2023-2028 (%)
      • Exhibit 106: Data Table on China - Year-over-year growth 2023-2028 (%)
    • 9.10 Germany - Market size and forecast 2023-2028
      • Exhibit 107: Chart on Germany - Market size and forecast 2023-2028 ($ million)
      • Exhibit 108: Data Table on Germany - Market size and forecast 2023-2028 ($ million)
      • Exhibit 109: Chart on Germany - Year-over-year growth 2023-2028 (%)
      • Exhibit 110: Data Table on Germany - Year-over-year growth 2023-2028 (%)
    • 9.11 Canada - Market size and forecast 2023-2028
      • Exhibit 111: Chart on Canada - Market size and forecast 2023-2028 ($ million)
      • Exhibit 112: Data Table on Canada - Market size and forecast 2023-2028 ($ million)
      • Exhibit 113: Chart on Canada - Year-over-year growth 2023-2028 (%)
      • Exhibit 114: Data Table on Canada - Year-over-year growth 2023-2028 (%)
    • 9.12 UK - Market size and forecast 2023-2028
      • Exhibit 115: Chart on UK - Market size and forecast 2023-2028 ($ million)
      • Exhibit 116: Data Table on UK - Market size and forecast 2023-2028 ($ million)
      • Exhibit 117: Chart on UK - Year-over-year growth 2023-2028 (%)
      • Exhibit 118: Data Table on UK - Year-over-year growth 2023-2028 (%)
    • 9.13 Market opportunity by geography
      • Exhibit 119: Market opportunity by geography ($ million)
      • Exhibit 120: Data Tables on Market opportunity by geography ($ million)

    10 Drivers, Challenges, and Trends

    • 10.1 Market drivers
      • 10.2 Market challenges
        • 10.3 Impact of drivers and challenges
          • Exhibit 121: Impact of drivers and challenges in 2023 and 2028
        • 10.4 Market trends

          11 Vendor Landscape

          • 11.1 Overview
            • 11.2 Vendor landscape
              • Exhibit 122: Overview on Criticality of inputs and Factors of differentiation
            • 11.3 Landscape disruption
              • Exhibit 123: Overview on factors of disruption
            • 11.4 Industry risks
              • Exhibit 124: Impact of key risks on business

            12 Vendor Analysis

            • 12.1 Vendors covered
              • Exhibit 125: Vendors covered
            • 12.2 Market positioning of vendors
              • Exhibit 126: Matrix on vendor position and classification
            • 12.3 Ariva Digital
              • Exhibit 127: Ariva Digital - Overview
              • Exhibit 128: Ariva Digital - Product / Service
              • Exhibit 129: Ariva Digital - Key offerings
            • 12.4 Infosys Ltd.
              • Exhibit 130: Infosys Ltd. - Overview
              • Exhibit 131: Infosys Ltd. - Business segments
              • Exhibit 132: Infosys Ltd. - Key news
              • Exhibit 133: Infosys Ltd. - Key offerings
              • Exhibit 134: Infosys Ltd. - Segment focus
            • 12.5 LynKey International Ltd.
              • Exhibit 135: LynKey International Ltd. - Overview
              • Exhibit 136: LynKey International Ltd. - Product / Service
              • Exhibit 137: LynKey International Ltd. - Key offerings
            • 12.6 Marriott International Inc.
              • Exhibit 138: Marriott International Inc. - Overview
              • Exhibit 139: Marriott International Inc. - Business segments
              • Exhibit 140: Marriott International Inc. - Key news
              • Exhibit 141: Marriott International Inc. - Key offerings
              • Exhibit 142: Marriott International Inc. - Segment focus
            • 12.7 Metaverse Seoul
              • Exhibit 143: Metaverse Seoul - Overview
              • Exhibit 144: Metaverse Seoul - Product / Service
              • Exhibit 145: Metaverse Seoul - Key offerings
            • 12.8 Qatar Airways
              • Exhibit 146: Qatar Airways - Overview
              • Exhibit 147: Qatar Airways - Product / Service
              • Exhibit 148: Qatar Airways - Key offerings
            • 12.9 Rendezverse
              • Exhibit 149: Rendezverse - Overview
              • Exhibit 150: Rendezverse - Product / Service
              • Exhibit 151: Rendezverse - Key offerings

            13 Appendix

            • 13.1 Scope of the report
              • 13.2 Inclusions and exclusions checklist
                • Exhibit 152: Inclusions checklist
                • Exhibit 153: Exclusions checklist
              • 13.3 Currency conversion rates for US$
                • Exhibit 154: Currency conversion rates for US$
              • 13.4 Research methodology
                • Exhibit 155: Research methodology
                • Exhibit 156: Validation techniques employed for market sizing
                • Exhibit 157: Information sources
              • 13.5 List of abbreviations
                • Exhibit 158: List of abbreviations

              Research Methodology

              Technavio presents a detailed picture of the market by way of study, synthesis, and summation of data from multiple sources. The analysts have presented the various facets of the market with a particular focus on identifying the key industry influencers. The data thus presented is comprehensive, reliable, and the result of extensive research, both primary and secondary.

              INFORMATION SOURCES

              Primary sources

              • Manufacturers and suppliers
              • Channel partners
              • Industry experts
              • Strategic decision makers

              Secondary sources

              • Industry journals and periodicals
              • Government data
              • Financial reports of key industry players
              • Historical data
              • Press releases

              DATA ANALYSIS

              Data Synthesis

              • Collation of data
              • Estimation of key figures
              • Analysis of derived insights

              Data Validation

              • Triangulation with data models
              • Reference against proprietary databases
              • Corroboration with industry experts

              REPORT WRITING

              Qualitative

              • Market drivers
              • Market challenges
              • Market trends
              • Five forces analysis

              Quantitative

              • Market size and forecast
              • Market segmentation
              • Geographical insights
              • Competitive landscape

              Interested in this report?

              Get your sample now to see our research methodology and insights!

              Download Now

              Frequently Asked Questions

              Metaversein Travel and Tourism market growth will increase by $ 155174.36 mn during 2024-2028.

              The Metaversein Travel and Tourism market is expected to grow at a CAGR of 26.76% during 2024-2028.

              Metaversein Travel and Tourism market is segmented by Application( AR, MR, Blockchain, XR, VR) Component( Hardware, Software, Services, South America, Middle East and Africa)

              Ariva Digital, Infosys Ltd., LynKey International Ltd., Marriott International Inc., Metaverse Seoul, Qatar Airways, Rendezverse are a few of the key vendors in the Metaversein Travel and Tourism market.

              North America will register the highest growth rate of 36% among the other regions. Therefore, the Metaversein Travel and Tourism market in North America is expected to garner significant business opportunities for the vendors during the forecast period.

              US, Canada, China, Germany, UK

              • Increasing demand for AR and VR technologyCustomers are increasingly adopting VR and AR technology is the driving factor this market.
              • either for professional or private use. This adoption rate has increased significantly over the last decade. An increasing number of customers are actively requesting VR solutions is the driving factor this market.
              • whereas others are curious about VR and are seeking information about it. AR is widely used to provide metaverse travel and tourism solutions is the driving factor this market.
              • such as creating digital avatars is the driving factor this market.
              • VR tours is the driving factor this market.
              • interactive hotel elements is the driving factor this market.
              • and other ways to tell customers about the property and the amenities available to them. Metaverse is a mixed reality (mixture of AR/VR) that has unlimited access is the driving factor this market.
              • unlike usual VR programs. The evolution of VR into a more mixed reality has created readability in virtual spaces through annotations as well as decoding tags. The AR will allow some aspects of the metaverse to be projected into the physical world in an open or access-controlled way. VR programs in the metaverse can offer unique experiences to consumers in the education is the driving factor this market.
              • entertainment is the driving factor this market.
              • commerce is the driving factor this market.
              • and service industries. Technological innovations will further drive the demand for AR and VR applications during the forecast period is the driving factor this market.
              • as these applications will enable users to use the technology in a more user-friendly manner. Wearable technology platforms will likely enhance the utility of AR in the global metaverse market in travel and tourism industry. For instance is the driving factor this market.
              • Google is actively working on AR Smart Glasses for the global metaverse market in travel and tourism industry. Therefore is the driving factor this market.
              • the growing application area of AR and VR technology will boost the growth of the global metaverse market in travel and tourism industry during the forecast period. is the driving factor this market.

              The Metaversein Travel and Tourism market vendors should focus on grabbing business opportunities from the AR segment as it accounted for the largest market share in the base year.
              RIA - Research AI Assistant
              Ask RIA