Mobile Value-Added Services (MVAS) Market Analysis, Size, and Forecast 2025-2029: North America (US and Canada), Europe (France, Germany, and UK), APAC (Australia, China, India, Japan, and South Korea), and Rest of World (ROW)

Mobile Value-Added Services (MVAS) Market Analysis, Size, and Forecast 2025-2029:
North America (US and Canada), Europe (France, Germany, and UK), APAC (Australia, China, India, Japan, and South Korea), and Rest of World (ROW)

Published: May 2025 240 Pages SKU: IRTNTR44646

Market Overview at a Glance

$1290.7 B
Market Opportunity
19.8%
CAGR
16.3
YoY growth 2024-2025(%)

Mobile Value-Added Services (MVAS) Market Size 2025-2029

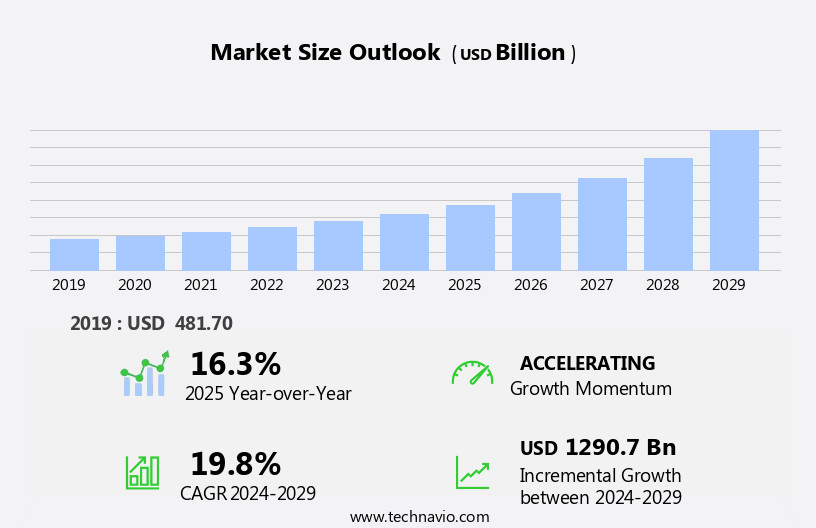
The mobile value-added services (mvas) market size is forecast to increase by USD 1290.7 billion, at a CAGR of 19.8% between 2024 and 2029.

  • The market is experiencing significant growth, driven by the rapid increase in smartphone penetration and the increasing popularity of Augmented Reality (AR) in location-based games. The proliferation of smartphones has expanded the reach of MVAS, enabling service providers to tap into a vast and growing customer base. Furthermore, the integration of AR technology in location-based games is fueling demand for MVAS, as users seek immersive and interactive gaming experiences. However, the market is not without challenges. Content monetization remains a significant constraint, as users increasingly demand free services and ad-supported models face growing competition from other digital platforms.
  • Service providers must innovate and differentiate their offerings to secure revenue streams and maintain customer loyalty. Additionally, regulatory hurdles and security concerns pose further challenges, requiring MVAS providers to navigate complex regulatory environments and invest in robust security infrastructure to protect user data and privacy. Companies seeking to capitalize on the opportunities presented by the MVAS market must stay abreast of these trends and challenges, and develop strategies to effectively monetize content, leverage AR technology, and address regulatory and security concerns.

What will be the Size of the Mobile Value-Added Services (MVAS) Market during the forecast period?

Mobile Value-Added Services (MVAS) Market Size

Explore in-depth regional segment analysis with market size data - historical 2019-2023 and forecasts 2025-2029 - in the full report.  
Request Free Sample

The market continues to evolve, with dynamic market patterns unfolding across various sectors. QR code scanning, WAP services, mobile wallet, mobile entertainment, mobile payment gateways, mobile security, mobile news services, mobile healthcare services, mobile software development, mobile ticketing, mobile analytics, mobile payments, mms messaging, near-field communication (NFC), mobile video streaming, mobile data services, mobile education services, and mobile location services are integral components of this ever-evolving landscape. Mobile weather services enable users to access real-time meteorological information, while mobile advertising networks optimize digital marketing efforts. Mobile user experience is a critical factor in the success of mobile applications, driving the demand for mobile content delivery and mobile marketing platforms.

Mobile network operators provide the infrastructure for mobile services, facilitating mobile banking, mobile billing systems, mobile travel services, mobile social media, and mobile app stores. Mobile gaming and mobile device manufacturers cater to the entertainment sector, offering immersive experiences to consumers. Mobile customer support and mobile content providers ensure seamless interaction and access to essential services. Mobile commerce, mobile ticketing, and mobile analytics facilitate transactions and data-driven decision-making. The integration of mobile security, mobile news services, mobile healthcare services, and mobile software development addresses growing consumer needs, further expanding the MVAS market's scope. The continuous evolution of mobile technology and the increasing adoption of mobile services underscore the market's ongoing dynamism.

How is this Mobile Value-Added Services (MVAS) Industry segmented?

The mobile value-added services (mvas) industry research report provides comprehensive data (region-wise segment analysis), with forecasts and estimates in "USD billion" for the period 2025-2029, as well as historical data from 2019-2023 for the following segments.

  • Product
    • Mobile advertising
    • Mobile games
    • Mobile music and video streaming
    • Mobile money and m-commerce
    • Mobile publications
  • End-user
    • BFSI
    • Media and entertainment
    • Healthcare
    • Education
    • Others
  • Sector
    • Large enterprises
    • Small and medium enterprises
  • Geography
    • North America
      • US
      • Canada
    • Europe
      • France
      • Germany
      • UK
    • APAC
      • Australia
      • China
      • India
      • Japan
      • South Korea
    • Rest of World (ROW)

    By Product Insights

    The mobile advertising segment is estimated to witness significant growth during the forecast period.

    The market encompasses a range of offerings, including mobile weather services, mobile advertising networks, mobile music streaming, mobile marketing platforms, mobile content delivery, mobile banking, mobile travel services, mobile social media, mobile app store, mobile gaming, mobile device manufacturers, sms messaging, mobile customer support, mobile content providers, mobile applications, mobile commerce, qr code scanning, wap services, mobile wallet, mobile entertainment, mobile payment gateways, mobile security, mobile news services, mobile healthcare services, mobile software development, mobile ticketing, mobile analytics, mobile payments, mms messaging, near-field communication (NFC), mobile video streaming, mobile data services, mobile education services, and mobile location services.

    The mobile advertising segment, which includes revenue from SMS and MMS ads, click-to-download and click-to-call ads, in-app ads, and image text and banner ads, has experienced significant growth due to the increasing consumer preference for mobile devices. Major tech companies like Google and Apple have capitalized on this trend by offering optimized mobile advertising platforms. Advertisements are customized based on consumer data, such as browsing history, geographic location, and shopping habits. In-app advertising was the leading contributor to the mobile advertising segment in 2024, particularly in developed markets like the US. The proliferation of mobile broadband has made video advertising an attractive format for consumers, offering an engaging experience in a non-intrusive manner.

    Additionally, the integration of mobile wallets, mobile payment gateways, and mobile security services has further fueled the growth of the MVAS market. Mobile content providers and mobile network operators collaborate to deliver a seamless user experience, with mobile device manufacturers continually innovating to enhance the consumer experience. Mobile marketing platforms facilitate targeted campaigns, while mobile customer support offers real-time assistance. Mobile commerce, including mobile ticketing and mobile payments, has gained traction, making everyday transactions more convenient. The integration of mobile location services, qr code scanning, and NFC technology has opened up new opportunities for businesses to engage with consumers in innovative ways.

    Mobile education services and mobile healthcare services cater to the growing demand for personalized, on-demand learning and healthcare solutions. Mobile data services ensure uninterrupted connectivity, while mobile entertainment offers a wide range of options to cater to diverse consumer preferences. In conclusion, the MVAS market is characterized by continuous innovation and collaboration among various stakeholders to meet the evolving needs of consumers in the mobile-first world.

    Mobile Value-Added Services (MVAS) Market Size

    Request Free Sample

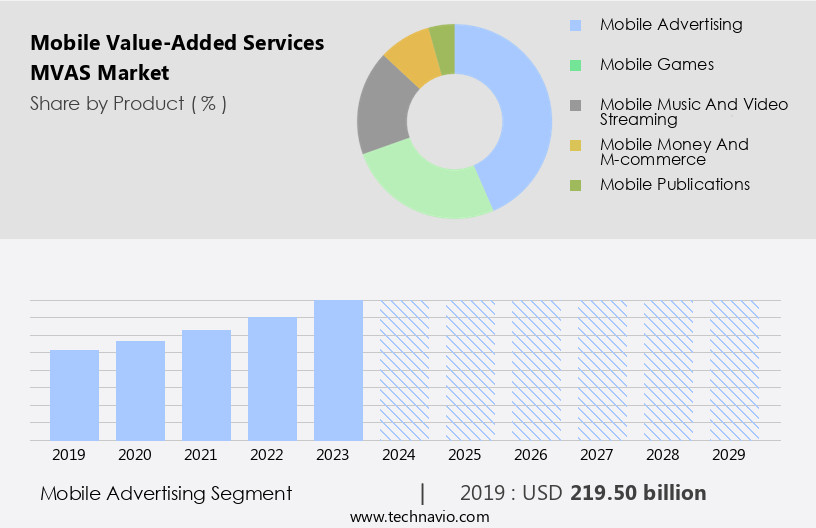
    The Mobile advertising segment was valued at USD 219.50 billion in 2019 and showed a gradual increase during the forecast period.

    Regional Analysis

    APAC is estimated to contribute 58% to the growth of the global market during the forecast period.Technavio’s analysts have elaborately explained the regional trends and drivers that shape the market during the forecast period.

    Mobile Value-Added Services (MVAS) Market Share by Geography

     Request Free Sample

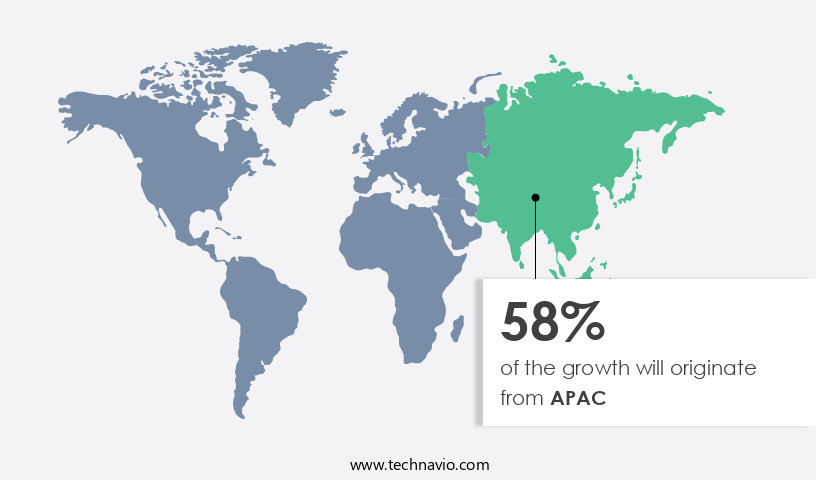
    The market is experiencing significant growth, particularly in the Asia Pacific (APAC) region. The region's dominance in 2024 can be attributed to the rapid proliferation of smartphones and mobile broadband in emerging economies like China and India. International and domestic companies providing smartphones and mobile broadband services have played a pivotal role in the penetration of mobile devices and the Internet. Furthermore, government initiatives aimed at developing mobile technology infrastructure are expected to continue driving the MVAS market in APAC during the forecast period. Key industries such as transportation and banking are undergoing digitization, with mobile applications becoming increasingly popular.

    For instance, online cab booking apps like Ola and Uber have gained significant traction in India. Mobile weather services, advertising networks, user experience, music streaming, marketing platforms, content delivery, network operators, banking, advertising, billing systems, travel services, social media, app stores, gaming, device manufacturers, messaging, customer support, content providers, applications, commerce, qr code scanning, wap services, wallets, entertainment, payment gateways, security, news services, healthcare services, software development, ticketing, analytics, payments, mms messaging, near-field communication (NFC), video streaming, data services, education services, and location services are all integral components of the MVAS market. With the increasing adoption of mobile technology and the convenience it offers, the MVAS market is poised for continued growth in APAC and beyond.

    Market Dynamics

    Our researchers analyzed the data with 2024 as the base year, along with the key drivers, trends, and challenges. A holistic analysis of drivers will help companies refine their marketing strategies to gain a competitive advantage.

    What are the key market drivers leading to the rise in the adoption of Mobile Value-Added Services (MVAS) Industry?

    • The substantial growth in smartphone adoption is the primary factor fueling market expansion. 

    • The global mobile market has witnessed significant growth, with the number of mobile subscribers increasing from 5 billion in 2018 to 5.6 billion by 2023. This growth represents approximately 70% of the global population and is driven by the widespread adoption of smartphones and tablets. Consumers are increasingly relying on mobile devices for various activities, including mobile gaming, web browsing, social media interaction, and mobile commerce. The portability of these devices has led to a shift from traditional desktops, as users seek to access content on the go. The rise in disposable income globally has further fueled this trend.
    • Mobile value-added services (MVAS), which include mobile travel services, mobile social media, mobile app stores, mobile customer support, and mobile content providers, have become essential components of the mobile ecosystem. These services offer immersive and harmonious experiences, emphasizing convenience and ease of use. Mobile applications, such as mobile travel services and mobile commerce, have gained immense popularity, providing users with the ability to book flights, hotels, and make purchases from anywhere. SMS messaging remains a crucial aspect of mobile communication, offering a quick and convenient way to stay connected. Overall, the mobile market is expected to continue its growth trajectory, offering numerous opportunities for businesses and consumers alike.

    What are the market trends shaping the Mobile Value-Added Services (MVAS) Industry?

    • The rising prevalence of augmented reality (AR) technology in location-based games represents a significant market trend. This innovative approach to gaming is gaining increasing popularity and is expected to shape the future of the industry.

    • The market encompasses various applications and services that enhance the functionality of mobile devices. These include QR code scanning, WAP services, mobile wallet, mobile entertainment, mobile payment gateways, mobile security, mobile news services, mobile healthcare services, mobile software development, and mobile ticketing. The market's growth is driven by the increasing usage of smartphones and the continuous advancements in mobile technology. AR technology, specifically in location-based games, is a significant contributor to the market's expansion. AR games, which layer virtual content over real-world surroundings and objects, can be accessed via smartphones and wearables like smart glasses.
    • AR games, unlike virtual reality (VR) games, do not necessitate expensive dedicated equipment. This flexibility makes AR games more accessible and popular. In 2025, the adoption of AR in location-based games is expected to continue its upward trend. Popular games such as Pokemon Go, Ingress, Zombies, Run!, Harry Potter: Wizards Unite, Knightfall AR, Orna RPG, Dragon Quest Walk, and Jurassic World Alive remain at the forefront of this trend. The integration of AR technology in mobile games offers an immersive and harmonious user experience, making it an essential component of the MVAS market.

    What challenges does the Mobile Value-Added Services (MVAS) Industry face during its growth?

    • The growth of the content monetization industry is significantly impacted by the constraints imposed on this process. These challenges, which are inherent to content monetization, must be addressed in order to foster industry expansion. 

    • Mobile Value-Added Services (MVAS) have emerged as a significant revenue generation opportunity for mobile service providers, given the decline in revenue from traditional voice calls. With the proliferation of free voice and video calling apps and messaging services, mobile analytics, mobile payments, mms messaging, mobile video streaming, mobile data services, mobile education services, mobile location services, and near-field communication (NFC) have become crucial areas of focus. These services offer unique features and added value to customers, enabling mobile service providers to monetize OTT content.
    • Companies like Reliance Industries and AT&T, which currently provide free OTT content through partnerships with third-party providers, are expected to transition to a subscription-based revenue model during the forecast period. The shift towards digital services and the increasing demand for personalized and immersive experiences are expected to fuel the growth of the MVAS market.

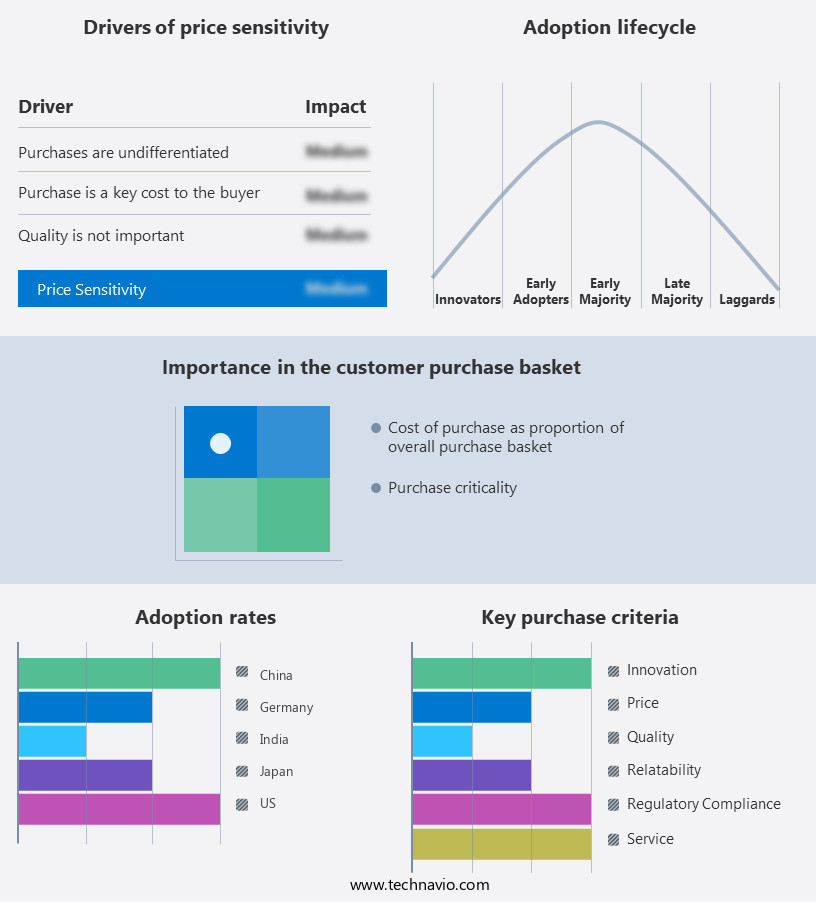
    Exclusive Customer Landscape

    The mobile value-added services (mvas) market forecasting report includes the adoption lifecycle of the market, covering from the innovator’s stage to the laggard’s stage. It focuses on adoption rates in different regions based on penetration. Furthermore, the mobile value-added services (mvas) market report also includes key purchase criteria and drivers of price sensitivity to help companies evaluate and develop their market growth analysis strategies.

    Mobile Value-Added Services (MVAS) Market Share by Geography

     Customer Landscape

    Key Companies & Market Insights

    Companies are implementing various strategies, such as strategic alliances, mobile value-added services (mvas) market forecast, partnerships, mergers and acquisitions, geographical expansion, and product/service launches, to enhance their presence in the industry.

    America Movil SAB de CV - The company provides a range of Multimedia Value-Added Services (MVAS), including Claro Sync for cloud storage, Claro Video for streaming media, Claro Musica for music access, and Claro Viajes for travel planning. These innovative offerings enhance users' digital experiences, seamlessly integrating essential services into their daily lives. Claro Sync ensures secure, accessible data storage, while Claro Video delivers high-definition entertainment on demand. Claro Musica offers a vast library of music for streaming and download, and Claro Viajes simplifies travel planning with real-time information and booking capabilities. By prioritizing user convenience and originality, the company continues to expand its MVAS portfolio, setting the standard for digital innovation.

    The industry research and growth report includes detailed analyses of the competitive landscape of the market and information about key companies, including:

    • America Movil SAB de CV
    • Apple Inc.
    • AT and T Inc.
    • Call Up
    • Cisco Systems Inc.
    • Comviva Technologies Ltd.
    • Google LLC
    • Huawei Technologies Co. Ltd.
    • Infosys Ltd.
    • InMobi Pte. Ltd.
    • International Business Machines Corp.
    • Jio Platforms
    • Monty Mobile
    • MyRepublic Ltd
    • OnMobile Global Ltd.
    • Samsung Electronics Co. Ltd.
    • Singapore Telecommunications Ltd.
    • Telcovas Solutions and Services Pvt Ltd
    • Telefonaktiebolaget LM Ericsson
    • Vodafone Group Plc

    Qualitative and quantitative analysis of companies has been conducted to help clients understand the wider business environment as well as the strengths and weaknesses of key industry players. Data is qualitatively analyzed to categorize companies as pure play, category-focused, industry-focused, and diversified; it is quantitatively analyzed to categorize companies as dominant, leading, strong, tentative, and weak.

    Recent Development and News in Mobile Value-Added Services (MVAS) Market

    • In February 2024, leading telecommunications company, Airtel Africa, announced the launch of a new mobile value-added service (MVAS) platform, "Airtel Money," in three new African countries: Democratic Republic of Congo, Malawi, and Uganda. This expansion significantly broadens the company's reach in the African market and aims to provide financial services, including mobile money transfers, bill payments, and mobile top-ups, to millions of unbanked and underbanked populations (Airtel Africa Press Release, 2024).
    • In March 2025, tech giant Google and mobile network operator, Vodafone Group, announced a strategic partnership to bring Google's Mobile Services, including Google Play and YouTube, to Vodafone's MVAS platform. This collaboration is expected to enhance the user experience for Vodafone's mobile customers by providing them with access to a wider range of apps and digital content (Vodafone Group Press Release, 2025).
    • In May 2024, telecommunications company, Bharti Airtel, acquired a majority stake in Hike Messenger, a popular messaging app in India. This acquisition is aimed at strengthening Bharti Airtel's digital offerings and expanding its presence in the digital communications market. Hike Messenger, with its 100 million user base, will now be integrated with Bharti Airtel's mobile services, offering users a more comprehensive digital communications and entertainment experience (Bharti Airtel Press Release, 2024).
    • In January 2025, the European Union (EU) introduced new regulations for MVAS, requiring providers to obtain explicit consent from customers before charging them for premium services. This policy change aims to protect consumers from unexpected charges and promote transparency in the MVAS market (European Commission Press Release, 2025).

    Research Analyst Overview

    • The market is characterized by subscription models that cater to diverse mobile user demographics, enabling access to various services such as mobile marketing strategies, mobile advertising formats, and mobile app monetization. Mobile payment acceptance is a significant trend, with mobile network performance and infrastructure playing a crucial role in ensuring seamless transactions. Mobile technology trends, including advancements in mobile advertising effectiveness and mobile device compatibility, are driving innovation in the market. Roaming charges, data usage, and mobile network coverage remain key concerns for users, necessitating mobile network infrastructure improvements and mobile technology advancements. Mobile user privacy is another critical issue, with regulations such as mobile industry regulations governing data security and mobile payment security.
    • Mobile security threats, including malware and phishing attacks, pose challenges to market growth. Mobile network performance and mobile technology trends continue to shape mobile marketing strategies, with mobile advertising formats becoming increasingly sophisticated to engage customers effectively. Mobile user demographics and mobile customer engagement are essential factors in determining the success of mobile advertising campaigns. Overall, the MVAS market is dynamic, with continuous innovation and evolving consumer demands shaping its future.

    Dive into Technavio’s robust research methodology, blending expert interviews, extensive data synthesis, and validated models for unparalleled Mobile Value-Added Services (MVAS) Market insights. See full methodology.

    Market Scope

    Report Coverage

    Details

    Page number

    240

    Base year

    2024

    Historic period

    2019-2023

    Forecast period

    2025-2029

    Growth momentum & CAGR

    Accelerate at a CAGR of 19.8%

    Market growth 2025-2029

    USD 1290.7 billion

    Market structure

    Fragmented

    YoY growth 2024-2025(%)

    16.3

    Key countries

    US, China, Japan, India, South Korea, Australia, Germany, Canada, UK, and France

    Competitive landscape

    Leading Companies, Market Positioning of Companies, Competitive Strategies, and Industry Risks

    Request Free Sample

    What are the Key Data Covered in this Mobile Value-Added Services (MVAS) Market Research and Growth Report?

    • CAGR of the Mobile Value-Added Services (MVAS) industry during the forecast period
    • Detailed information on factors that will drive the growth and forecasting between 2025 and 2029
    • Precise estimation of the size of the market and its contribution of the industry in focus to the parent market
    • Accurate predictions about upcoming growth and trends and changes in consumer behaviour
    • Growth of the market across APAC, North America, Europe, South America, and Middle East and Africa
    • Thorough analysis of the market’s competitive landscape and detailed information about companies
    • Comprehensive analysis of factors that will challenge the mobile value-added services (mvas) market growth of industry companies

    We can help! Our analysts can customize this mobile value-added services (mvas) market research report to meet your requirements.

    Get in touch


    1 Executive Summary

    • 1.1 Market overview
      • Executive Summary - Chart on Market Overview
      • Executive Summary - Data Table on Market Overview
      • Executive Summary - Chart on Global Market Characteristics
      • Executive Summary - Chart on Market by Geography
      • Executive Summary - Chart on Market Segmentation by Product
      • Executive Summary - Chart on Market Segmentation by End-user
      • Executive Summary - Chart on Market Segmentation by Sector
      • Executive Summary - Chart on Incremental Growth
      • Executive Summary - Data Table on Incremental Growth
      • Executive Summary - Chart on Company Market Positioning

    2 Technavio Analysis

    • 2.1 Analysis of price sensitivity, lifecycle, customer purchase basket, adoption rates, and purchase criteria
      • Analysis of price sensitivity, lifecycle, customer purchase basket, adoption rates, and purchase criteria
    • 2.2 Criticality of inputs and Factors of differentiation
      • Overview on criticality of inputs and factors of differentiation
    • 2.3 Factors of disruption
      • Overview on factors of disruption
    • 2.4 Impact of drivers and challenges
      • Impact of drivers and challenges in 2024 and 2029

    3 Market Landscape

    • 3.1 Market ecosystem
      • Parent Market
      • Data Table on - Parent Market
    • 3.2 Market characteristics
      • Market characteristics analysis
    • 3.3 Value chain analysis
      • Value chain analysis

    4 Market Sizing

    • 4.1 Market definition
      • Offerings of companies included in the market definition
    • 4.2 Market segment analysis
      • Market segments
    • 4.3 Market size 2024
      • 4.4 Market outlook: Forecast for 2024-2029
        • Chart on Global - Market size and forecast 2024-2029 ($ billion)
        • Data Table on Global - Market size and forecast 2024-2029 ($ billion)
        • Chart on Global Market: Year-over-year growth 2024-2029 (%)
        • Data Table on Global Market: Year-over-year growth 2024-2029 (%)

      5 Historic Market Size

      • 5.1 Global Mobile Value-Added Services (MVAS) Market 2019 - 2023
        • Historic Market Size - Data Table on Global Mobile Value-Added Services (MVAS) Market 2019 - 2023 ($ billion)
      • 5.2 Product segment analysis 2019 - 2023
        • Historic Market Size - Product Segment 2019 - 2023 ($ billion)
      • 5.3 End-user segment analysis 2019 - 2023
        • Historic Market Size - End-user Segment 2019 - 2023 ($ billion)
      • 5.4 Sector segment analysis 2019 - 2023
        • Historic Market Size - Sector Segment 2019 - 2023 ($ billion)
      • 5.5 Geography segment analysis 2019 - 2023
        • Historic Market Size - Geography Segment 2019 - 2023 ($ billion)
      • 5.6 Country segment analysis 2019 - 2023
        • Historic Market Size - Country Segment 2019 - 2023 ($ billion)

      6 Qualitative Analysis

      • 6.1 Impact of AI on Global Mobile Value-added Services (MVAS) Market

        7 Five Forces Analysis

        • 7.1 Five forces summary
          • Five forces analysis - Comparison between 2024 and 2029
        • 7.2 Bargaining power of buyers
          • Bargaining power of buyers - Impact of key factors 2024 and 2029
        • 7.3 Bargaining power of suppliers
          • Bargaining power of suppliers - Impact of key factors in 2024 and 2029
        • 7.4 Threat of new entrants
          • Threat of new entrants - Impact of key factors in 2024 and 2029
        • 7.5 Threat of substitutes
          • Threat of substitutes - Impact of key factors in 2024 and 2029
        • 7.6 Threat of rivalry
          • Threat of rivalry - Impact of key factors in 2024 and 2029
        • 7.7 Market condition
          • Chart on Market condition - Five forces 2024 and 2029

        8 Market Segmentation by Product

        • 8.1 Market segments
          • Chart on Product - Market share 2024-2029 (%)
          • Data Table on Product - Market share 2024-2029 (%)
        • 8.2 Comparison by Product
          • Chart on Comparison by Product
          • Data Table on Comparison by Product
        • 8.3 Mobile advertising - Market size and forecast 2024-2029
          • Chart on Mobile advertising - Market size and forecast 2024-2029 ($ billion)
          • Data Table on Mobile advertising - Market size and forecast 2024-2029 ($ billion)
          • Chart on Mobile advertising - Year-over-year growth 2024-2029 (%)
          • Data Table on Mobile advertising - Year-over-year growth 2024-2029 (%)
        • 8.4 Mobile games - Market size and forecast 2024-2029
          • Chart on Mobile games - Market size and forecast 2024-2029 ($ billion)
          • Data Table on Mobile games - Market size and forecast 2024-2029 ($ billion)
          • Chart on Mobile games - Year-over-year growth 2024-2029 (%)
          • Data Table on Mobile games - Year-over-year growth 2024-2029 (%)
        • 8.5 Mobile music and video streaming - Market size and forecast 2024-2029
          • Chart on Mobile music and video streaming - Market size and forecast 2024-2029 ($ billion)
          • Data Table on Mobile music and video streaming - Market size and forecast 2024-2029 ($ billion)
          • Chart on Mobile music and video streaming - Year-over-year growth 2024-2029 (%)
          • Data Table on Mobile music and video streaming - Year-over-year growth 2024-2029 (%)
        • 8.6 Mobile money and m-commerce - Market size and forecast 2024-2029
          • Chart on Mobile money and m-commerce - Market size and forecast 2024-2029 ($ billion)
          • Data Table on Mobile money and m-commerce - Market size and forecast 2024-2029 ($ billion)
          • Chart on Mobile money and m-commerce - Year-over-year growth 2024-2029 (%)
          • Data Table on Mobile money and m-commerce - Year-over-year growth 2024-2029 (%)
        • 8.7 Mobile publications - Market size and forecast 2024-2029
          • Chart on Mobile publications - Market size and forecast 2024-2029 ($ billion)
          • Data Table on Mobile publications - Market size and forecast 2024-2029 ($ billion)
          • Chart on Mobile publications - Year-over-year growth 2024-2029 (%)
          • Data Table on Mobile publications - Year-over-year growth 2024-2029 (%)
        • 8.8 Market opportunity by Product
          • Market opportunity by Product ($ billion)
          • Data Table on Market opportunity by Product ($ billion)

        9 Market Segmentation by End-user

        • 9.1 Market segments
          • Chart on End-user - Market share 2024-2029 (%)
          • Data Table on End-user - Market share 2024-2029 (%)
        • 9.2 Comparison by End-user
          • Chart on Comparison by End-user
          • Data Table on Comparison by End-user
        • 9.3 BFSI - Market size and forecast 2024-2029
          • Chart on BFSI - Market size and forecast 2024-2029 ($ billion)
          • Data Table on BFSI - Market size and forecast 2024-2029 ($ billion)
          • Chart on BFSI - Year-over-year growth 2024-2029 (%)
          • Data Table on BFSI - Year-over-year growth 2024-2029 (%)
        • 9.4 Media and entertainment - Market size and forecast 2024-2029
          • Chart on Media and entertainment - Market size and forecast 2024-2029 ($ billion)
          • Data Table on Media and entertainment - Market size and forecast 2024-2029 ($ billion)
          • Chart on Media and entertainment - Year-over-year growth 2024-2029 (%)
          • Data Table on Media and entertainment - Year-over-year growth 2024-2029 (%)
        • 9.5 Healthcare - Market size and forecast 2024-2029
          • Chart on Healthcare - Market size and forecast 2024-2029 ($ billion)
          • Data Table on Healthcare - Market size and forecast 2024-2029 ($ billion)
          • Chart on Healthcare - Year-over-year growth 2024-2029 (%)
          • Data Table on Healthcare - Year-over-year growth 2024-2029 (%)
        • 9.6 Education - Market size and forecast 2024-2029
          • Chart on Education - Market size and forecast 2024-2029 ($ billion)
          • Data Table on Education - Market size and forecast 2024-2029 ($ billion)
          • Chart on Education - Year-over-year growth 2024-2029 (%)
          • Data Table on Education - Year-over-year growth 2024-2029 (%)
        • 9.7 Others - Market size and forecast 2024-2029
          • Chart on Others - Market size and forecast 2024-2029 ($ billion)
          • Data Table on Others - Market size and forecast 2024-2029 ($ billion)
          • Chart on Others - Year-over-year growth 2024-2029 (%)
          • Data Table on Others - Year-over-year growth 2024-2029 (%)
        • 9.8 Market opportunity by End-user
          • Market opportunity by End-user ($ billion)
          • Data Table on Market opportunity by End-user ($ billion)

        10 Market Segmentation by Sector

        • 10.1 Market segments
          • Chart on Sector - Market share 2024-2029 (%)
          • Data Table on Sector - Market share 2024-2029 (%)
        • 10.2 Comparison by Sector
          • Chart on Comparison by Sector
          • Data Table on Comparison by Sector
        • 10.3 Large enterprises - Market size and forecast 2024-2029
          • Chart on Large enterprises - Market size and forecast 2024-2029 ($ billion)
          • Data Table on Large enterprises - Market size and forecast 2024-2029 ($ billion)
          • Chart on Large enterprises - Year-over-year growth 2024-2029 (%)
          • Data Table on Large enterprises - Year-over-year growth 2024-2029 (%)
        • 10.4 Small and medium enterprises - Market size and forecast 2024-2029
          • Chart on Small and medium enterprises - Market size and forecast 2024-2029 ($ billion)
          • Data Table on Small and medium enterprises - Market size and forecast 2024-2029 ($ billion)
          • Chart on Small and medium enterprises - Year-over-year growth 2024-2029 (%)
          • Data Table on Small and medium enterprises - Year-over-year growth 2024-2029 (%)
        • 10.5 Market opportunity by Sector
          • Market opportunity by Sector ($ billion)
          • Data Table on Market opportunity by Sector ($ billion)

        11 Customer Landscape

        • 11.1 Customer landscape overview
          • Analysis of price sensitivity, lifecycle, customer purchase basket, adoption rates, and purchase criteria

        12 Geographic Landscape

        • 12.1 Geographic segmentation
          • Chart on Market share by geography 2024-2029 (%)
          • Data Table on Market share by geography 2024-2029 (%)
        • 12.2 Geographic comparison
          • Chart on Geographic comparison
          • Data Table on Geographic comparison
        • 12.3 APAC - Market size and forecast 2024-2029
          • Chart on APAC - Market size and forecast 2024-2029 ($ billion)
          • Data Table on APAC - Market size and forecast 2024-2029 ($ billion)
          • Chart on APAC - Year-over-year growth 2024-2029 (%)
          • Data Table on APAC - Year-over-year growth 2024-2029 (%)
        • 12.4 North America - Market size and forecast 2024-2029
          • Chart on North America - Market size and forecast 2024-2029 ($ billion)
          • Data Table on North America - Market size and forecast 2024-2029 ($ billion)
          • Chart on North America - Year-over-year growth 2024-2029 (%)
          • Data Table on North America - Year-over-year growth 2024-2029 (%)
        • 12.5 Europe - Market size and forecast 2024-2029
          • Chart on Europe - Market size and forecast 2024-2029 ($ billion)
          • Data Table on Europe - Market size and forecast 2024-2029 ($ billion)
          • Chart on Europe - Year-over-year growth 2024-2029 (%)
          • Data Table on Europe - Year-over-year growth 2024-2029 (%)
        • 12.6 South America - Market size and forecast 2024-2029
          • Chart on South America - Market size and forecast 2024-2029 ($ billion)
          • Data Table on South America - Market size and forecast 2024-2029 ($ billion)
          • Chart on South America - Year-over-year growth 2024-2029 (%)
          • Data Table on South America - Year-over-year growth 2024-2029 (%)
        • 12.7 Middle East and Africa - Market size and forecast 2024-2029
          • Chart on Middle East and Africa - Market size and forecast 2024-2029 ($ billion)
          • Data Table on Middle East and Africa - Market size and forecast 2024-2029 ($ billion)
          • Chart on Middle East and Africa - Year-over-year growth 2024-2029 (%)
          • Data Table on Middle East and Africa - Year-over-year growth 2024-2029 (%)
        • 12.8 US - Market size and forecast 2024-2029
          • Chart on US - Market size and forecast 2024-2029 ($ billion)
          • Data Table on US - Market size and forecast 2024-2029 ($ billion)
          • Chart on US - Year-over-year growth 2024-2029 (%)
          • Data Table on US - Year-over-year growth 2024-2029 (%)
        • 12.9 China - Market size and forecast 2024-2029
          • Chart on China - Market size and forecast 2024-2029 ($ billion)
          • Data Table on China - Market size and forecast 2024-2029 ($ billion)
          • Chart on China - Year-over-year growth 2024-2029 (%)
          • Data Table on China - Year-over-year growth 2024-2029 (%)
        • 12.10 Japan - Market size and forecast 2024-2029
          • Chart on Japan - Market size and forecast 2024-2029 ($ billion)
          • Data Table on Japan - Market size and forecast 2024-2029 ($ billion)
          • Chart on Japan - Year-over-year growth 2024-2029 (%)
          • Data Table on Japan - Year-over-year growth 2024-2029 (%)
        • 12.11 India - Market size and forecast 2024-2029
          • Chart on India - Market size and forecast 2024-2029 ($ billion)
          • Data Table on India - Market size and forecast 2024-2029 ($ billion)
          • Chart on India - Year-over-year growth 2024-2029 (%)
          • Data Table on India - Year-over-year growth 2024-2029 (%)
        • 12.12 South Korea - Market size and forecast 2024-2029
          • Chart on South Korea - Market size and forecast 2024-2029 ($ billion)
          • Data Table on South Korea - Market size and forecast 2024-2029 ($ billion)
          • Chart on South Korea - Year-over-year growth 2024-2029 (%)
          • Data Table on South Korea - Year-over-year growth 2024-2029 (%)
        • 12.13 Australia - Market size and forecast 2024-2029
          • Chart on Australia - Market size and forecast 2024-2029 ($ billion)
          • Data Table on Australia - Market size and forecast 2024-2029 ($ billion)
          • Chart on Australia - Year-over-year growth 2024-2029 (%)
          • Data Table on Australia - Year-over-year growth 2024-2029 (%)
        • 12.14 Germany - Market size and forecast 2024-2029
          • Chart on Germany - Market size and forecast 2024-2029 ($ billion)
          • Data Table on Germany - Market size and forecast 2024-2029 ($ billion)
          • Chart on Germany - Year-over-year growth 2024-2029 (%)
          • Data Table on Germany - Year-over-year growth 2024-2029 (%)
        • 12.15 Canada - Market size and forecast 2024-2029
          • Chart on Canada - Market size and forecast 2024-2029 ($ billion)
          • Data Table on Canada - Market size and forecast 2024-2029 ($ billion)
          • Chart on Canada - Year-over-year growth 2024-2029 (%)
          • Data Table on Canada - Year-over-year growth 2024-2029 (%)
        • 12.16 UK - Market size and forecast 2024-2029
          • Chart on UK - Market size and forecast 2024-2029 ($ billion)
          • Data Table on UK - Market size and forecast 2024-2029 ($ billion)
          • Chart on UK - Year-over-year growth 2024-2029 (%)
          • Data Table on UK - Year-over-year growth 2024-2029 (%)
        • 12.17 France - Market size and forecast 2024-2029
          • Chart on France - Market size and forecast 2024-2029 ($ billion)
          • Data Table on France - Market size and forecast 2024-2029 ($ billion)
          • Chart on France - Year-over-year growth 2024-2029 (%)
          • Data Table on France - Year-over-year growth 2024-2029 (%)
        • 12.18 Market opportunity by geography
          • Market opportunity by geography ($ billion)
          • Data Tables on Market opportunity by geography ($ billion)

        13 Drivers, Challenges, and Opportunity/Restraints

        • 13.1 Market drivers
          • 13.2 Market challenges
            • 13.3 Impact of drivers and challenges
              • Impact of drivers and challenges in 2024 and 2029
            • 13.4 Market opportunities/restraints

              14 Competitive Landscape

              • 14.1 Overview
                • 14.2 Competitive Landscape
                  • Overview on criticality of inputs and factors of differentiation
                • 14.3 Landscape disruption
                  • Overview on factors of disruption
                • 14.4 Industry risks
                  • Impact of key risks on business

                15 Competitive Analysis

                • 15.1 Companies profiled
                  • Companies covered
                • 15.2 Company ranking index
                  • Company ranking index
                • 15.3 Market positioning of companies
                  • Matrix on companies position and classification
                • 15.4 America Movil SAB de CV
                  • America Movil SAB de CV - Overview
                  • America Movil SAB de CV - Business segments
                  • America Movil SAB de CV - Key offerings
                  • America Movil SAB de CV - Segment focus
                  • SWOT
                • 15.5 Apple Inc.
                  • Apple Inc. - Overview
                  • Apple Inc. - Business segments
                  • Apple Inc. - Key news
                  • Apple Inc. - Key offerings
                  • Apple Inc. - Segment focus
                  • SWOT
                • 15.6 AT and T Inc.
                  • AT and T Inc. - Overview
                  • AT and T Inc. - Business segments
                  • AT and T Inc. - Key news
                  • AT and T Inc. - Key offerings
                  • AT and T Inc. - Segment focus
                  • SWOT
                • 15.7 Cisco Systems Inc.
                  • Cisco Systems Inc. - Overview
                  • Cisco Systems Inc. - Business segments
                  • Cisco Systems Inc. - Key news
                  • Cisco Systems Inc. - Key offerings
                  • Cisco Systems Inc. - Segment focus
                  • SWOT
                • 15.8 Comviva Technologies Ltd.
                  • Comviva Technologies Ltd. - Overview
                  • Comviva Technologies Ltd. - Business segments
                  • Comviva Technologies Ltd. - Key news
                  • Comviva Technologies Ltd. - Key offerings
                  • Comviva Technologies Ltd. - Segment focus
                  • SWOT
                • 15.9 Google LLC
                  • Google LLC - Overview
                  • Google LLC - Product / Service
                  • Google LLC - Key news
                  • Google LLC - Key offerings
                  • SWOT
                • 15.10 Huawei Technologies Co. Ltd.
                  • Huawei Technologies Co. Ltd. - Overview
                  • Huawei Technologies Co. Ltd. - Product / Service
                  • Huawei Technologies Co. Ltd. - Key news
                  • Huawei Technologies Co. Ltd. - Key offerings
                  • SWOT
                • 15.11 Infosys Ltd.
                  • Infosys Ltd. - Overview
                  • Infosys Ltd. - Business segments
                  • Infosys Ltd. - Key news
                  • Infosys Ltd. - Key offerings
                  • Infosys Ltd. - Segment focus
                  • SWOT
                • 15.12 International Business Machines Corp.
                  • International Business Machines Corp. - Overview
                  • International Business Machines Corp. - Business segments
                  • International Business Machines Corp. - Key news
                  • International Business Machines Corp. - Key offerings
                  • International Business Machines Corp. - Segment focus
                  • SWOT
                • 15.13 Jio Platforms
                  • Jio Platforms - Overview
                  • Jio Platforms - Product / Service
                  • Jio Platforms - Key offerings
                  • SWOT
                • 15.14 Monty Mobile
                  • Monty Mobile - Overview
                  • Monty Mobile - Product / Service
                  • Monty Mobile - Key offerings
                  • SWOT
                • 15.15 OnMobile Global Ltd.
                  • OnMobile Global Ltd. - Overview
                  • OnMobile Global Ltd. - Product / Service
                  • OnMobile Global Ltd. - Key offerings
                  • SWOT
                • 15.16 Samsung Electronics Co. Ltd.
                  • Samsung Electronics Co. Ltd. - Overview
                  • Samsung Electronics Co. Ltd. - Business segments
                  • Samsung Electronics Co. Ltd. - Key news
                  • Samsung Electronics Co. Ltd. - Key offerings
                  • Samsung Electronics Co. Ltd. - Segment focus
                  • SWOT
                • 15.17 Telefonaktiebolaget LM Ericsson
                  • Telefonaktiebolaget LM Ericsson - Overview
                  • Telefonaktiebolaget LM Ericsson - Business segments
                  • Telefonaktiebolaget LM Ericsson - Key news
                  • Telefonaktiebolaget LM Ericsson - Key offerings
                  • Telefonaktiebolaget LM Ericsson - Segment focus
                  • SWOT
                • 15.18 Vodafone Group Plc
                  • Vodafone Group Plc - Overview
                  • Vodafone Group Plc - Business segments
                  • Vodafone Group Plc - Key offerings
                  • Vodafone Group Plc - Segment focus
                  • SWOT

                16 Appendix

                • 16.1 Scope of the report
                  • 16.2 Inclusions and exclusions checklist
                    • Inclusions checklist
                    • Exclusions checklist
                  • 16.3 Currency conversion rates for US$
                    • Currency conversion rates for US$
                  • 16.4 Research methodology
                    • Research methodology
                  • 16.5 Data procurement
                    • Information sources
                  • 16.6 Data validation
                    • Data validation
                  • 16.7 Validation techniques employed for market sizing
                    • Validation techniques employed for market sizing
                  • 16.8 Data synthesis
                    • Data synthesis
                  • 16.9 360 degree market analysis
                    • 360 degree market analysis
                  • 16.10 List of abbreviations
                    • List of abbreviations

                  Research Methodology

                  Technavio presents a detailed picture of the market by way of study, synthesis, and summation of data from multiple sources. The analysts have presented the various facets of the market with a particular focus on identifying the key industry influencers. The data thus presented is comprehensive, reliable, and the result of extensive research, both primary and secondary.

                  INFORMATION SOURCES

                  Primary sources

                  • Manufacturers and suppliers
                  • Channel partners
                  • Industry experts
                  • Strategic decision makers

                  Secondary sources

                  • Industry journals and periodicals
                  • Government data
                  • Financial reports of key industry players
                  • Historical data
                  • Press releases

                  DATA ANALYSIS

                  Data Synthesis

                  • Collation of data
                  • Estimation of key figures
                  • Analysis of derived insights

                  Data Validation

                  • Triangulation with data models
                  • Reference against proprietary databases
                  • Corroboration with industry experts

                  REPORT WRITING

                  Qualitative

                  • Market drivers
                  • Market challenges
                  • Market trends
                  • Five forces analysis

                  Quantitative

                  • Market size and forecast
                  • Market segmentation
                  • Geographical insights
                  • Competitive landscape

                  Interested in this report?

                  Get your sample now to see our research methodology and insights!

                  Download Now

                  Frequently Asked Questions

                  Mobile Value-Added Services (Mvas) market growth will increase by $ 1290.7 bn during 2025-2029 .

                  The Mobile Value-Added Services (Mvas) market is expected to grow at a CAGR of 19.8% during 2025-2029 .

                  Mobile Value-Added Services (Mvas) market is segmented by Product( Mobile advertising, Mobile games, Mobile music and video streaming, Mobile money and m-commerce, Mobile publications) End-user( BFSI, Media and entertainment, Healthcare, Education, Others) Sector( Large enterprises, Small and medium enterprises, Europe, South America, Middle East and Africa)

                  America Movil SAB de CV, Apple Inc., AT and T Inc., Call Up, Cisco Systems Inc., Comviva Technologies Ltd., Google LLC, Huawei Technologies Co. Ltd., Infosys Ltd., InMobi Pte. Ltd., International Business Machines Corp., Jio Platforms, Monty Mobile, MyRepublic Ltd, OnMobile Global Ltd., Samsung Electronics Co. Ltd., Singapore Telecommunications Ltd., Telcovas Solutions and Services Pvt Ltd, Telefonaktiebolaget LM Ericsson, Vodafone Group Plc are a few of the key vendors in the Mobile Value-Added Services (Mvas) market.

                  APAC will register the highest growth rate of 58% among the other regions. Therefore, the Mobile Value-Added Services (Mvas) market in APAC is expected to garner significant business opportunities for the vendors during the forecast period.

                  US, China, Japan, India, South Korea, Australia, Germany, Canada, UK, France

                  • Rapid increase in smartphone penetrationThere has been a rapid increase in the number of smartphone users worldwide. The total number of global mobile subscribers (those subscribing to a cellular service) grew from 5 billion in 2018 to 5.6 billion by 2023 is the driving factor this market.
                  • accounting for 70% of the global population. Consumers are increasingly using mobile devices for various purposes is the driving factor this market.
                  • ranging from gaming and web browsing to e-commerce and social media interaction.Rising disposable income globally has led to the adoption of smartphone devices and tablets and has been driven by users need to access content on the go. The portability of such devices has spurred a shift toward mobile platforms from traditional desktops. Also is the driving factor this market.
                  • with mobile phone manufacturers introducing a wide array of smartphone offerings at competitive prices is the driving factor this market.
                  • consumers can choose smartphones that cater to their specific requirements. For instance is the driving factor this market.
                  • several companies in the Asian market is the driving factor this market.
                  • such as Xiaomi is the driving factor this market.
                  • One Plus is the driving factor this market.
                  • Oppo is the driving factor this market.
                  • and Huawei is the driving factor this market.
                  • are offering smartphones with multiple features at low costs through various distribution channels. The high competition in the smartphone industry is reflected in the declining prices of smartphones is the driving factor this market.
                  • thus making them affordable for consumers. With improvements in Internet speeds and technological infrastructure is the driving factor this market.
                  • especially in emerging economies such as India and China is the driving factor this market.
                  • smartphone penetration will continue to increase in these countries during the forecast period. This is the driving factor this market.
                  • in turn is the driving factor this market.
                  • is expected to drive the global MVAS market during the forecast period. is the driving factor this market.

                  The Mobile Value-Added Services (Mvas) market vendors should focus on grabbing business opportunities from the Mobile advertising segment as it accounted for the largest market share in the base year.