Molasses Market Analysis, Size, and Forecast 2026-2030: APAC (India, China, and Japan), North America (US, Canada, and Mexico), Europe (Germany, France, and UK), Middle East and Africa (Saudi Arabia, South Africa, and UAE), South America (Brazil and Argentina), and Rest of World (ROW)

Molasses Market Analysis, Size, and Forecast 2026-2030:
APAC (India, China, and Japan), North America (US, Canada, and Mexico), Europe (Germany, France, and UK), Middle East and Africa (Saudi Arabia, South Africa, and UAE), South America (Brazil and Argentina), and Rest of World (ROW)

Published: Mar 2026 290 Pages SKU: IRTNTR71743

Market Overview at a Glance

$5.27 B
Market Opportunity
5.7%
CAGR 2025 - 2030
63.1%
APAC Growth
$9.79 B
Feed segment 2024

Molasses Market Size 2026-2030

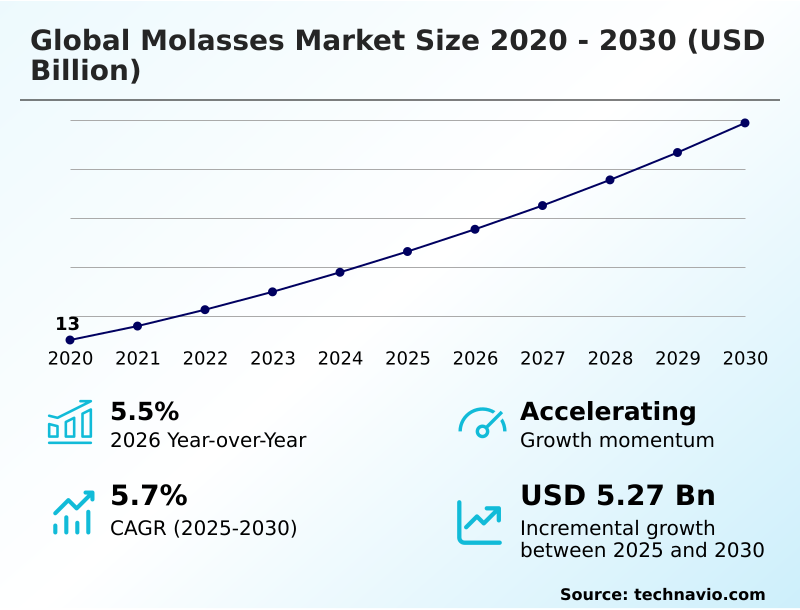
The molasses market size is valued to increase by USD 5.27 billion, at a CAGR of 5.7% from 2025 to 2030. Rising global demand for bioethanol and renewable fuel mandates will drive the molasses market.

Major Market Trends & Insights

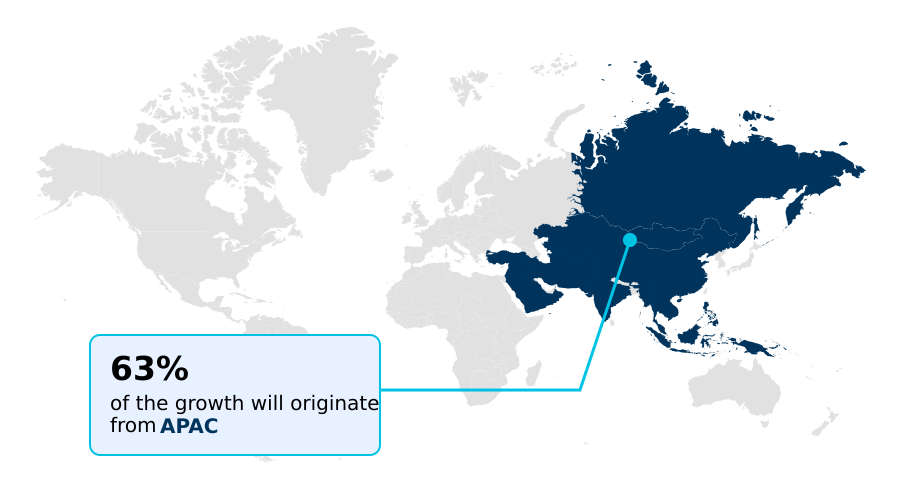
  • APAC dominated the market and accounted for a 63.1% growth during the forecast period.
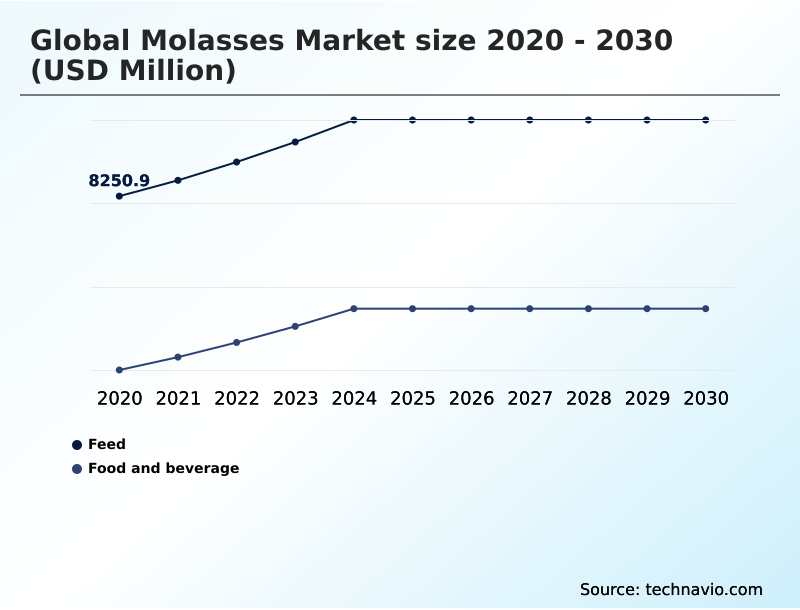
  • By Application - Feed segment was valued at USD 9.79 billion in 2024
  • By Type - Blackstrap molasses segment accounted for the largest market revenue share in 2024

Market Size & Forecast

  • Market Opportunities: USD 8.89 billion
  • Market Future Opportunities: USD 5.27 billion
  • CAGR from 2025 to 2030 : 5.7%

Market Summary

  • The molasses market is shaped by its integral role as a byproduct in sugar refining and its diverse applications across industries. A primary driver is the global push for renewable energy, where molasses serves as a critical bioethanol feedstock for biofuel production. Concurrently, the animal feed sector relies on it as a palatability enhancer and energy supplement.
  • A key trend involves the market's bifurcation, with high-value, food-grade molasses for clean-label food processing decoupling from the commodity feed-grade market. However, the industry faces challenges from climatic volatility impacting sugarcane yields and regulatory policies that divert supply toward government-mandated fuel programs.
  • For instance, a business focused on the circular bioeconomy might leverage specialty molasses streams in precision fermentation to produce high-margin bioplastics, navigating supply chain risks by securing long-term contracts for organic molasses certified material. This strategy turns a traditional commodity into a cornerstone of sustainable industrial innovation, highlighting the market's shift toward value-added derivatives and advanced bio-manufacturing.

What will be the Size of the Molasses Market during the forecast period?

Get Key Insights on Market Forecast (PDF) Request Free Sample

How is the Molasses Market Segmented?

The molasses industry research report provides comprehensive data (region-wise segment analysis), with forecasts and estimates in "USD million" for the period 2026-2030, as well as historical data from 2020-2024 for the following segments.

  • Application
    • Feed
    • Food and beverage
  • Type
    • Blackstrap molasses
    • Regular molasses
  • Source
    • Sugarcane
    • Sugar
    • Others
  • Geography
    • APAC
      • India
      • China
      • Japan
    • North America
      • US
      • Canada
      • Mexico
    • Europe
      • Germany
      • France
      • UK
    • Middle East and Africa
      • Saudi Arabia
      • South Africa
      • UAE
    • South America
      • Brazil
      • Argentina
    • Rest of World (ROW)

By Application Insights

The feed segment is estimated to witness significant growth during the forecast period.

The molasses market is segmented by its core applications, with animal feed representing the dominant segment. The use of molasses as an animal feed supplement is driven by its function as a feed palatability enhancer and a liquid feed binder.

Its high brix content offers a cost-effective energy source in ruminant nutrition, improving digestion. While APAC accounts for 63.1% of market opportunities, North America's robust livestock industry creates substantial demand. Manufacturers utilize feed-grade molasses as a pelleting process aid.

This versatile sugarcane byproduct, including specific types like beet molasses, is essential for optimizing feed formulations, acting as a refined sugar substitute and ensuring consistent nutritional intake for livestock, making sustainable molasses sourcing a key consideration for industrial buyers.

Request Free Sample

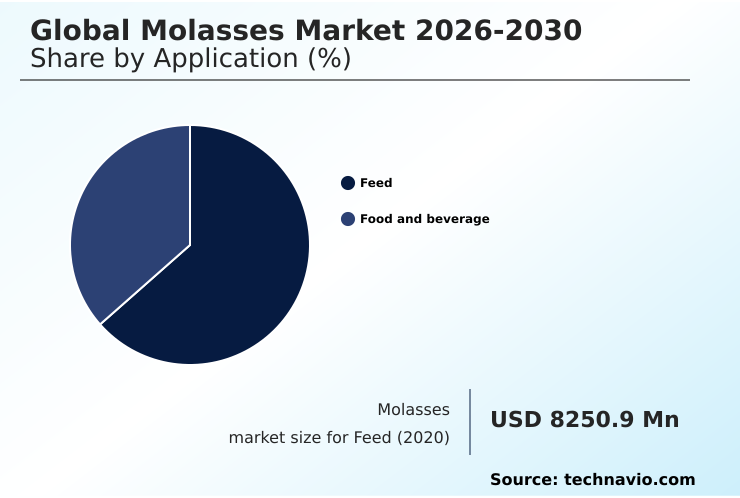
The Feed segment was valued at USD 9.79 billion in 2024 and showed a gradual increase during the forecast period.

Request Free Sample

Regional Analysis

APAC is estimated to contribute 63.1% to the growth of the global market during the forecast period.Technavio’s analysts have elaborately explained the regional trends and drivers that shape the market during the forecast period.

See How Molasses Market Demand is Rising in APAC Request Free Sample

The geographic landscape of the molasses market is dominated by APAC, which represents 63.1% of the global opportunity, driven by large-scale sugarcane cultivation in countries like India and Thailand.

In this region, molasses is a critical bioethanol feedstock, supporting national renewable energy programs. North America, representing 23.64% of the opportunity, is a major consumption market, primarily using molasses as an animal feed supplement and liquid feed binder.

Europe is focused on high-value applications, integrating beet molasses and cane molasses into its circular bioeconomy as a green chemistry feedstock and a key component in precision fermentation. The molasses mineral profile makes it valuable in organic feed formulations globally.

This regional specialization influences molasses import-export flows, with molasses storage and handling logistics being critical for connecting production hubs with consumption centers.

Market Dynamics

Our researchers analyzed the data with 2025 as the base year, along with the key drivers, trends, and challenges. A holistic analysis of drivers will help companies refine their marketing strategies to gain a competitive advantage.

  • The global molasses market is defined by a complex interplay of grades, sources, and applications, influencing everything from industrial processes to consumer products. Understanding the nuances when comparing blackstrap vs regular molasses is critical for procurement, as each offers different levels of fermentable sugars and mineral content.
  • Using molasses in animal feed remains the largest volume application, where its impact on feed palatability is a key purchasing driver. Molasses as a bioethanol feedstock is a major driver, with government mandates creating dedicated demand streams. Meanwhile, the benefits of organic molasses are being leveraged in premium food and health markets.
  • Fluctuations in molasses price per metric ton are closely watched by buyers in sectors from baking to chemical production. The impact of molasses on soil health is an emerging application in sustainable agriculture. For food producers, using food grade molasses for baking offers a clean-label sweetener solution.
  • Molasses sourcing from sugarcane is the dominant production method, but industrial uses of beet molasses are crucial in temperate climates. Its role in rum production is historical and continues in the craft spirits sector. Sustainable sourcing of molasses is becoming a key differentiator, alongside best practices for molasses storage to maintain quality.
  • As a clean-label sweetener, it replaces refined sugars, though regulatory impact on molasses supply can create volatility. For industrial biotechnology, it serves as a preferred fermentation substrate. Companies continually evaluate molasses alternatives in animal feed, while producers invest in advanced molasses clarification techniques.
  • Ultimately, the market is trending toward molasses for high-value bio-manufacturing, transforming it from a simple byproduct into a strategic industrial input.

What are the key market drivers leading to the rise in the adoption of Molasses Industry?

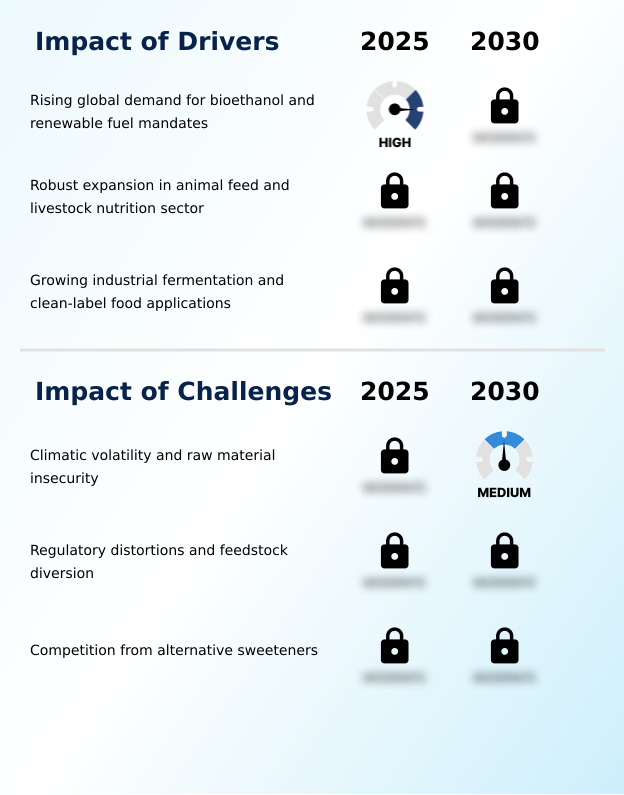
  • The rising global demand for bioethanol, driven by mandates for renewable fuels, serves as a key driver for the market.

  • The market's growth is primarily driven by government-led renewable energy mandates and sustained demand from the livestock industry.
  • The mandated blending of bioethanol with gasoline, which can improve fuel octane ratings by up to 3%, has positioned molasses as a strategic bioethanol feedstock.
  • Major economies are aggressively pursuing targets, with some aiming for a 20% ethanol blend, creating a massive, reliable demand channel for fermentable sugars. Simultaneously, the animal nutrition sector's reliance on molasses as a key animal feed supplement remains robust.
  • Its use as a feed palatability enhancer contributes to improved livestock health and productivity, with feedlot operators consistently procuring it despite price surges.
  • This dual demand from energy and agriculture, which includes its use as a soil microbial stimulant, solidifies the market's strong foundation.

What are the market trends shaping the Molasses Industry?

  • The market is witnessing a significant trend toward the integration of precision fermentation. This shift is driving the adoption of advanced bio-manufacturing processes for high-value applications.

  • A primary trend is the market's bifurcation into commodity and specialty segments. While molasses for potable alcohol remains a high-volume application, the growth is in high-value uses. The demand for specialty molasses streams in clean-label food processing is surging, with premium molasses blends commanding prices over ten times higher than standard feed-grade molasses.
  • This is driven by their use as a natural sweetener and natural food coloring, aligning with consumer preferences. Concurrently, the integration of molasses in bio-manufacturing and precision fermentation is transforming it into a strategic industrial input.
  • This shift is supported by significant capital injections, with one recent initiative dedicating substantial funding to scale up fermentation infrastructure, reducing dependency on petrochemical-based products by over 15%. This trend influences traditional sweetener applications and molasses for craft beverages.

What challenges does the Molasses Industry face during its growth?

  • Climatic volatility, which leads to raw material insecurity, poses a key challenge to the industry's growth.

  • The most significant market challenge is supply chain vulnerability stemming from climatic volatility and regulatory distortions. Unpredictable weather patterns directly impact sugarcane yields and the total recoverable sugar (atr) content, with a 5% drop in tons of cane per hectare (tch) in a major producing region creating immediate global supply tightness.
  • This agricultural uncertainty is compounded by government policies that divert blackstrap molasses toward biofuel production to meet blending targets, such as a 20% mandate. This policy-driven demand creates artificial scarcity for traditional users in the food and feed industries, forcing them to compete with a price floor set by the energy sector.
  • Consequently, users of molasses for yeast production nutrient or as a high-fructose corn syrup alternative face heightened price volatility and raw material insecurity, impacting production costs.

Exclusive Technavio Analysis on Customer Landscape

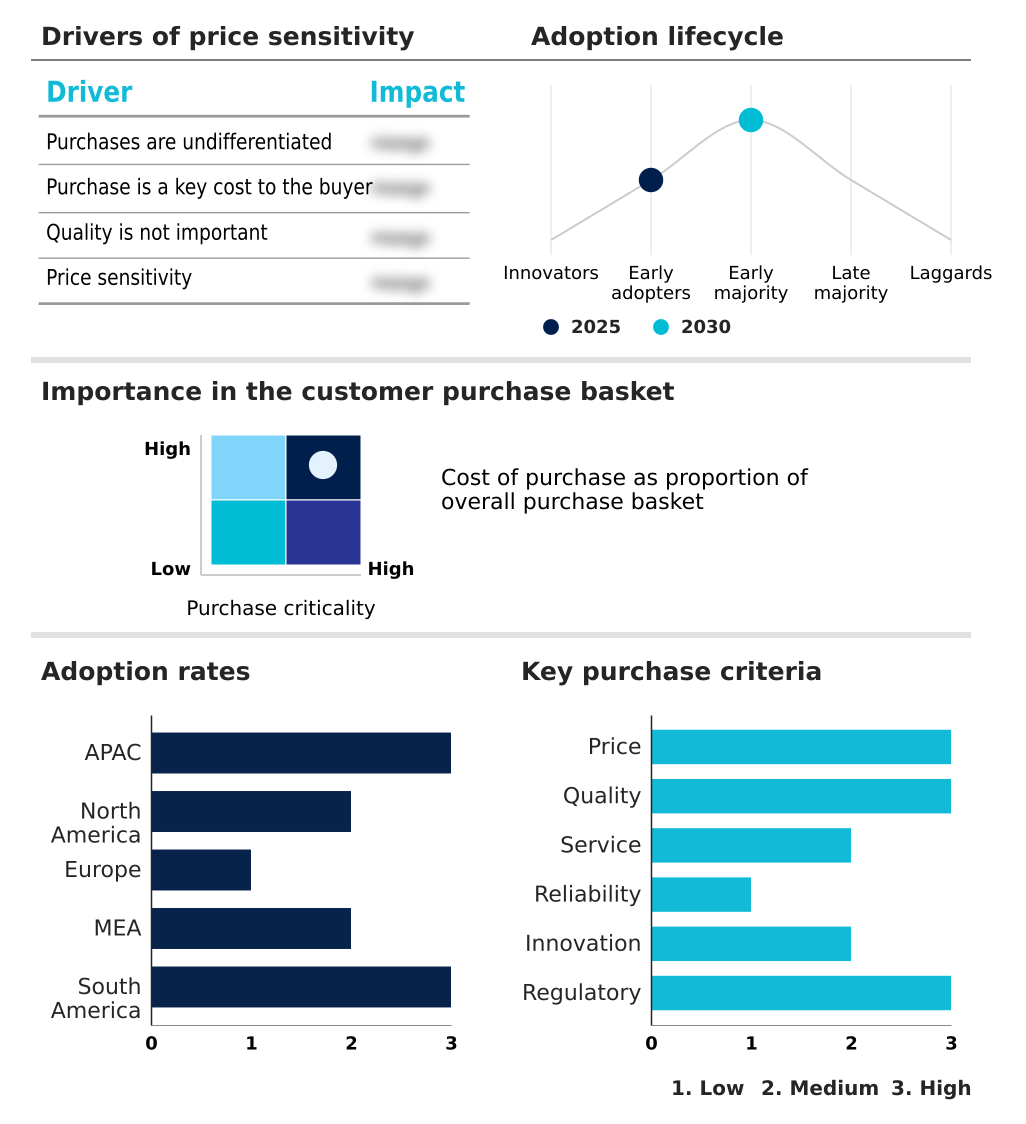
The molasses market forecasting report includes the adoption lifecycle of the market, covering from the innovator’s stage to the laggard’s stage. It focuses on adoption rates in different regions based on penetration. Furthermore, the molasses market report also includes key purchase criteria and drivers of price sensitivity to help companies evaluate and develop their market growth analysis strategies.

Customer Landscape of Molasses Industry

Competitive Landscape

Companies are implementing various strategies, such as strategic alliances, molasses market forecast, partnerships, mergers and acquisitions, geographical expansion, and product/service launches, to enhance their presence in the industry.

Archer Daniels Midland Co. - Offerings include diverse molasses grades, such as cane and beet molasses, catering to industrial fermentation, animal nutrition, and food and beverage applications.

The industry research and growth report includes detailed analyses of the competitive landscape of the market and information about key companies, including:

  • Archer Daniels Midland Co.
  • Associated British Foods Plc
  • B and G Foods Inc.
  • Cargill Inc.
  • Cora Texas Manufacturing Co.
  • Cosan SA
  • Cosun Beet Co.
  • Crosby Molasses Co. Ltd.
  • Florida Crystals Corp.
  • Imperial Sugar Co.
  • Louis Dreyfus Co. BV
  • Malt Products Corp.
  • Michigan Sugar Co.
  • Mitr Phol Group
  • Nordzucker AG
  • Sudzucker AG
  • Tereos SCA
  • Wilmar International Ltd.
  • Zook AG

Qualitative and quantitative analysis of companies has been conducted to help clients understand the wider business environment as well as the strengths and weaknesses of key industry players. Data is qualitatively analyzed to categorize companies as pure play, category-focused, industry-focused, and diversified; it is quantitatively analyzed to categorize companies as dominant, leading, strong, tentative, and weak.

Recent Development and News in Molasses market

  • In August, 2024, the government of India relaxed restrictions, allowing sugar mills to produce ethanol from sugarcane juice and various molasses grades to advance its 20% blending objective.
  • In February, 2025, Nordzucker AG successfully concluded an extended 2024-2025 production campaign in Germany, achieving high beet yields that ensured a stable supply of molasses for feed and fermentation industries.
  • In April, 2025, Brazil's National Supply Company (Conab) released its initial forecast for the 2025-2026 crop cycle, indicating a strategic focus on ethanol output despite challenging weather conditions.
  • In May, 2025, Tereos announced its Brazilian operations maintained stable sugarcane crushing volumes for the 2024-2025 harvest, matching previous records and securing molasses availability for export markets.

Dive into Technavio’s robust research methodology, blending expert interviews, extensive data synthesis, and validated models for unparalleled Molasses Market insights. See full methodology.

Market Scope
Page number 290
Base year 2025
Historic period 2020-2024
Forecast period 2026-2030
Growth momentum & CAGR Accelerate at a CAGR of 5.7%
Market growth 2026-2030 USD 5267.3 million
Market structure Fragmented
YoY growth 2025-2026(%) 5.5%
Key countries India, China, Thailand, Japan, South Korea, Australia, US, Canada, Mexico, Germany, France, UK, Italy, Spain, The Netherlands, Saudi Arabia, South Africa, Egypt, UAE, Nigeria, Brazil, Argentina and Chile
Competitive landscape Leading Companies, Market Positioning of Companies, Competitive Strategies, and Industry Risks

Request Free Sample

Research Analyst Overview

  • The molasses market operates as a critical nexus between agriculture and industry, with its value derived from its role as a versatile sugarcane byproduct. Key applications include its use as a bioethanol feedstock and an essential animal feed supplement. The industry is navigating a structural shift, where this viscous byproduct refining is increasingly seen as a circular bioeconomy input.
  • For instance, a regulatory change in one region mandating a shift in allocation from 19% to 25% for potable alcohol production directly impacts the availability of this green chemistry feedstock for other sectors, a risk factor that must be addressed in corporate strategic planning. The composition, including sucrose concentration and total recoverable sugar (atr), dictates its utility.
  • From its role as a rum distillation substrate to a bioplastic precursor, the applications are expanding. Boardroom decisions are increasingly focused on supply chain resilience, considering factors like heated storage terminals and tons of cane per hectare (tch) yields. The push for clean-label ingredients is elevating certain grades as a high-fructose corn syrup alternative.
  • This dynamic requires a sophisticated understanding of everything from its function as a dust suppressant agent to its classification as an organic molasses certified product.

What are the Key Data Covered in this Molasses Market Research and Growth Report?

  • What is the expected growth of the Molasses Market between 2026 and 2030?

    • USD 5.27 billion, at a CAGR of 5.7%

  • What segmentation does the market report cover?

    • The report is segmented by Application (Feed, and Food and beverage), Type (Blackstrap molasses, and Regular molasses), Source (Sugarcane, Sugar, and Others) and Geography (APAC, North America, Europe, Middle East and Africa, South America)

  • Which regions are analyzed in the report?

    • APAC, North America, Europe, Middle East and Africa and South America

  • What are the key growth drivers and market challenges?

    • Rising global demand for bioethanol and renewable fuel mandates, Climatic volatility and raw material insecurity

  • Who are the major players in the Molasses Market?

    • Archer Daniels Midland Co., Associated British Foods Plc, B and G Foods Inc., Cargill Inc., Cora Texas Manufacturing Co., Cosan SA, Cosun Beet Co., Crosby Molasses Co. Ltd., Florida Crystals Corp., Imperial Sugar Co., Louis Dreyfus Co. BV, Malt Products Corp., Michigan Sugar Co., Mitr Phol Group, Nordzucker AG, Sudzucker AG, Tereos SCA, Wilmar International Ltd. and Zook AG

Market Research Insights

  • Market dynamics are increasingly influenced by the dual demand for both high-volume industrial feedstocks and high-value food ingredients. The utilization of molasses for biofuel production is a significant factor, with its efficiency in fermentation processes showing a 10% higher yield compared to some grain-based alternatives.
  • Concurrently, the demand for molasses in artisanal foods and craft beverages is reshaping procurement strategies, as food-grade molasses can command a price premium of over 25% compared to feed-grade molasses. This price differential is driving a focus on molasses quality parameters and sustainable molasses sourcing.
  • End-users are also exploring molasses in aquaculture and as a soil amendment, expanding its application profile. The molasses regulatory framework continues to evolve, influencing molasses supply chain and price dynamics globally, particularly in organic feed formulations where traceability is paramount.

We can help! Our analysts can customize this molasses market research report to meet your requirements.

Get in touch

1. Executive Summary

1.1 Market overview

Executive Summary - Chart on Market Overview
Executive Summary - Data Table on Market Overview
Executive Summary - Chart on Global Market Characteristics
Executive Summary - Chart on Market by Geography
Executive Summary - Chart on Market Segmentation by Application
Executive Summary - Chart on Market Segmentation by Type
Executive Summary - Chart on Market Segmentation by Source
Executive Summary - Chart on Incremental Growth
Executive Summary - Data Table on Incremental Growth
Executive Summary - Chart on Company Market Positioning

2. Technavio Analysis

2.1 Analysis of price sensitivity, lifecycle, customer purchase basket, adoption rates, and purchase criteria

2.2 Criticality of inputs and Factors of differentiation

Chart on Overview on criticality of inputs and factors of differentiation

2.3 Factors of disruption

Chart on Overview on factors of disruption

2.4 Impact of drivers and challenges

Chart on Impact of drivers and challenges in 2025 and 2030

3. Market Landscape

3.1 Market ecosystem

Chart on Parent Market
Data Table on - Parent Market

3.2 Market characteristics

Chart on Market characteristics analysis

3.3 Value chain analysis

Chart on Value chain analysis

4. Market Sizing

4.1 Market definition

Data Table on Offerings of companies included in the market definition

4.2 Market segment analysis

Market segments

4.3 Market size 2025

4.4 Market outlook: Forecast for 2025-2030

Chart on Global - Market size and forecast 2025-2030 ($ million)
Data Table on Global - Market size and forecast 2025-2030 ($ million)
Chart on Global Market: Year-over-year growth 2025-2030 (%)
Data Table on Global Market: Year-over-year growth 2025-2030 (%)

5. Historic Market Size

5.1 Global Molasses Market 2020 - 2024

Historic Market Size - Data Table on Global Molasses Market 2020 - 2024 ($ million)

5.2 Application segment analysis 2020 - 2024

Historic Market Size - Application Segment 2020 - 2024 ($ million)

5.3 Type segment analysis 2020 - 2024

Historic Market Size - Type Segment 2020 - 2024 ($ million)

5.4 Source segment analysis 2020 - 2024

Historic Market Size - Source Segment 2020 - 2024 ($ million)

5.5 Geography segment analysis 2020 - 2024

Historic Market Size - Geography Segment 2020 - 2024 ($ million)

5.6 Country segment analysis 2020 - 2024

Historic Market Size - Country Segment 2020 - 2024 ($ million)

6. Qualitative Analysis

6.1 Impact of AI on Global Molasses Market

7. Five Forces Analysis

7.1 Five forces summary

Five forces analysis - Comparison between 2025 and 2030

7.2 Bargaining power of buyers

Bargaining power of buyers - Impact of key factors 2025 and 2030

7.3 Bargaining power of suppliers

Bargaining power of suppliers - Impact of key factors in 2025 and 2030

7.4 Threat of new entrants

Threat of new entrants - Impact of key factors in 2025 and 2030

7.5 Threat of substitutes

Threat of substitutes - Impact of key factors in 2025 and 2030

7.6 Threat of rivalry

Threat of rivalry - Impact of key factors in 2025 and 2030

7.7 Market condition

Chart on Market condition - Five forces 2025 and 2030

8. Market Segmentation by Application

8.1 Market segments

Chart on Application - Market share 2025-2030 (%)
Data Table on Application - Market share 2025-2030 (%)

8.2 Comparison by Application

Chart on Comparison by Application
Data Table on Comparison by Application

8.3 Feed - Market size and forecast 2025-2030

Chart on Feed - Market size and forecast 2025-2030 ($ million)
Data Table on Feed - Market size and forecast 2025-2030 ($ million)
Chart on Feed - Year-over-year growth 2025-2030 (%)
Data Table on Feed - Year-over-year growth 2025-2030 (%)

8.4 Food and beverage - Market size and forecast 2025-2030

Chart on Food and beverage - Market size and forecast 2025-2030 ($ million)
Data Table on Food and beverage - Market size and forecast 2025-2030 ($ million)
Chart on Food and beverage - Year-over-year growth 2025-2030 (%)
Data Table on Food and beverage - Year-over-year growth 2025-2030 (%)

8.5 Market opportunity by Application

Market opportunity by Application ($ million)
Data Table on Market opportunity by Application ($ million)

9. Market Segmentation by Type

9.1 Market segments

Chart on Type - Market share 2025-2030 (%)
Data Table on Type - Market share 2025-2030 (%)

9.2 Comparison by Type

Chart on Comparison by Type
Data Table on Comparison by Type

9.3 Blackstrap molasses - Market size and forecast 2025-2030

Chart on Blackstrap molasses - Market size and forecast 2025-2030 ($ million)
Data Table on Blackstrap molasses - Market size and forecast 2025-2030 ($ million)
Chart on Blackstrap molasses - Year-over-year growth 2025-2030 (%)
Data Table on Blackstrap molasses - Year-over-year growth 2025-2030 (%)

9.4 Regular molasses - Market size and forecast 2025-2030

Chart on Regular molasses - Market size and forecast 2025-2030 ($ million)
Data Table on Regular molasses - Market size and forecast 2025-2030 ($ million)
Chart on Regular molasses - Year-over-year growth 2025-2030 (%)
Data Table on Regular molasses - Year-over-year growth 2025-2030 (%)

9.5 Market opportunity by Type

Market opportunity by Type ($ million)
Data Table on Market opportunity by Type ($ million)

10. Market Segmentation by Source

10.1 Market segments

Chart on Source - Market share 2025-2030 (%)
Data Table on Source - Market share 2025-2030 (%)

10.2 Comparison by Source

Chart on Comparison by Source
Data Table on Comparison by Source

10.3 Sugarcane - Market size and forecast 2025-2030

Chart on Sugarcane - Market size and forecast 2025-2030 ($ million)
Data Table on Sugarcane - Market size and forecast 2025-2030 ($ million)
Chart on Sugarcane - Year-over-year growth 2025-2030 (%)
Data Table on Sugarcane - Year-over-year growth 2025-2030 (%)

10.4 Sugar - Market size and forecast 2025-2030

Chart on Sugar - Market size and forecast 2025-2030 ($ million)
Data Table on Sugar - Market size and forecast 2025-2030 ($ million)
Chart on Sugar - Year-over-year growth 2025-2030 (%)
Data Table on Sugar - Year-over-year growth 2025-2030 (%)

10.5 Others - Market size and forecast 2025-2030

Chart on Others - Market size and forecast 2025-2030 ($ million)
Data Table on Others - Market size and forecast 2025-2030 ($ million)
Chart on Others - Year-over-year growth 2025-2030 (%)
Data Table on Others - Year-over-year growth 2025-2030 (%)

10.6 Market opportunity by Source

Market opportunity by Source ($ million)
Data Table on Market opportunity by Source ($ million)

11. Customer Landscape

11.1 Customer landscape overview

Analysis of price sensitivity, lifecycle, customer purchase basket, adoption rates, and purchase criteria

12. Geographic Landscape

12.1 Geographic segmentation

Chart on Market share by geography 2025-2030 (%)
Data Table on Market share by geography 2025-2030 (%)

12.2 Geographic comparison

Chart on Geographic comparison
Data Table on Geographic comparison

12.3 APAC - Market size and forecast 2025-2030

Chart on APAC - Market size and forecast 2025-2030 ($ million)
Data Table on APAC - Market size and forecast 2025-2030 ($ million)
Chart on APAC - Year-over-year growth 2025-2030 (%)
Data Table on APAC - Year-over-year growth 2025-2030 (%)
Chart on Regional Comparison - APAC
Data Table on Regional Comparison - APAC

12.3.1 India - Market size and forecast 2025-2030

Chart on India - Market size and forecast 2025-2030 ($ million)
Data Table on India - Market size and forecast 2025-2030 ($ million)
Chart on India - Year-over-year growth 2025-2030 (%)
Data Table on India - Year-over-year growth 2025-2030 (%)

12.3.2 China - Market size and forecast 2025-2030

Chart on China - Market size and forecast 2025-2030 ($ million)
Data Table on China - Market size and forecast 2025-2030 ($ million)
Chart on China - Year-over-year growth 2025-2030 (%)
Data Table on China - Year-over-year growth 2025-2030 (%)

12.3.3 Thailand - Market size and forecast 2025-2030

Chart on Thailand - Market size and forecast 2025-2030 ($ million)
Data Table on Thailand - Market size and forecast 2025-2030 ($ million)
Chart on Thailand - Year-over-year growth 2025-2030 (%)
Data Table on Thailand - Year-over-year growth 2025-2030 (%)

12.3.4 Japan - Market size and forecast 2025-2030

Chart on Japan - Market size and forecast 2025-2030 ($ million)
Data Table on Japan - Market size and forecast 2025-2030 ($ million)
Chart on Japan - Year-over-year growth 2025-2030 (%)
Data Table on Japan - Year-over-year growth 2025-2030 (%)

12.3.5 South Korea - Market size and forecast 2025-2030

Chart on South Korea - Market size and forecast 2025-2030 ($ million)
Data Table on South Korea - Market size and forecast 2025-2030 ($ million)
Chart on South Korea - Year-over-year growth 2025-2030 (%)
Data Table on South Korea - Year-over-year growth 2025-2030 (%)

12.3.6 Australia - Market size and forecast 2025-2030

Chart on Australia - Market size and forecast 2025-2030 ($ million)
Data Table on Australia - Market size and forecast 2025-2030 ($ million)
Chart on Australia - Year-over-year growth 2025-2030 (%)
Data Table on Australia - Year-over-year growth 2025-2030 (%)

12.4 North America - Market size and forecast 2025-2030

Chart on North America - Market size and forecast 2025-2030 ($ million)
Data Table on North America - Market size and forecast 2025-2030 ($ million)
Chart on North America - Year-over-year growth 2025-2030 (%)
Data Table on North America - Year-over-year growth 2025-2030 (%)
Chart on Regional Comparison - North America
Data Table on Regional Comparison - North America

12.4.1 US - Market size and forecast 2025-2030

Chart on US - Market size and forecast 2025-2030 ($ million)
Data Table on US - Market size and forecast 2025-2030 ($ million)
Chart on US - Year-over-year growth 2025-2030 (%)
Data Table on US - Year-over-year growth 2025-2030 (%)

12.4.2 Canada - Market size and forecast 2025-2030

Chart on Canada - Market size and forecast 2025-2030 ($ million)
Data Table on Canada - Market size and forecast 2025-2030 ($ million)
Chart on Canada - Year-over-year growth 2025-2030 (%)
Data Table on Canada - Year-over-year growth 2025-2030 (%)

12.4.3 Mexico - Market size and forecast 2025-2030

Chart on Mexico - Market size and forecast 2025-2030 ($ million)
Data Table on Mexico - Market size and forecast 2025-2030 ($ million)
Chart on Mexico - Year-over-year growth 2025-2030 (%)
Data Table on Mexico - Year-over-year growth 2025-2030 (%)

12.5 Europe - Market size and forecast 2025-2030

Chart on Europe - Market size and forecast 2025-2030 ($ million)
Data Table on Europe - Market size and forecast 2025-2030 ($ million)
Chart on Europe - Year-over-year growth 2025-2030 (%)
Data Table on Europe - Year-over-year growth 2025-2030 (%)
Chart on Regional Comparison - Europe
Data Table on Regional Comparison - Europe

12.5.1 Germany - Market size and forecast 2025-2030

Chart on Germany - Market size and forecast 2025-2030 ($ million)
Data Table on Germany - Market size and forecast 2025-2030 ($ million)
Chart on Germany - Year-over-year growth 2025-2030 (%)
Data Table on Germany - Year-over-year growth 2025-2030 (%)

12.5.2 France - Market size and forecast 2025-2030

Chart on France - Market size and forecast 2025-2030 ($ million)
Data Table on France - Market size and forecast 2025-2030 ($ million)
Chart on France - Year-over-year growth 2025-2030 (%)
Data Table on France - Year-over-year growth 2025-2030 (%)

12.5.3 UK - Market size and forecast 2025-2030

Chart on UK - Market size and forecast 2025-2030 ($ million)
Data Table on UK - Market size and forecast 2025-2030 ($ million)
Chart on UK - Year-over-year growth 2025-2030 (%)
Data Table on UK - Year-over-year growth 2025-2030 (%)

12.5.4 Italy - Market size and forecast 2025-2030

Chart on Italy - Market size and forecast 2025-2030 ($ million)
Data Table on Italy - Market size and forecast 2025-2030 ($ million)
Chart on Italy - Year-over-year growth 2025-2030 (%)
Data Table on Italy - Year-over-year growth 2025-2030 (%)

12.5.5 Spain - Market size and forecast 2025-2030

Chart on Spain - Market size and forecast 2025-2030 ($ million)
Data Table on Spain - Market size and forecast 2025-2030 ($ million)
Chart on Spain - Year-over-year growth 2025-2030 (%)
Data Table on Spain - Year-over-year growth 2025-2030 (%)

12.5.6 The Netherlands - Market size and forecast 2025-2030

Chart on The Netherlands - Market size and forecast 2025-2030 ($ million)
Data Table on The Netherlands - Market size and forecast 2025-2030 ($ million)
Chart on The Netherlands - Year-over-year growth 2025-2030 (%)
Data Table on The Netherlands - Year-over-year growth 2025-2030 (%)

12.6 Middle East and Africa - Market size and forecast 2025-2030

Chart on Middle East and Africa - Market size and forecast 2025-2030 ($ million)
Data Table on Middle East and Africa - Market size and forecast 2025-2030 ($ million)
Chart on Middle East and Africa - Year-over-year growth 2025-2030 (%)
Data Table on Middle East and Africa - Year-over-year growth 2025-2030 (%)
Chart on Regional Comparison - Middle East and Africa
Data Table on Regional Comparison - Middle East and Africa

12.6.1 Saudi Arabia - Market size and forecast 2025-2030

Chart on Saudi Arabia - Market size and forecast 2025-2030 ($ million)
Data Table on Saudi Arabia - Market size and forecast 2025-2030 ($ million)
Chart on Saudi Arabia - Year-over-year growth 2025-2030 (%)
Data Table on Saudi Arabia - Year-over-year growth 2025-2030 (%)

12.6.2 South Africa - Market size and forecast 2025-2030

Chart on South Africa - Market size and forecast 2025-2030 ($ million)
Data Table on South Africa - Market size and forecast 2025-2030 ($ million)
Chart on South Africa - Year-over-year growth 2025-2030 (%)
Data Table on South Africa - Year-over-year growth 2025-2030 (%)

12.6.3 Egypt - Market size and forecast 2025-2030

Chart on Egypt - Market size and forecast 2025-2030 ($ million)
Data Table on Egypt - Market size and forecast 2025-2030 ($ million)
Chart on Egypt - Year-over-year growth 2025-2030 (%)
Data Table on Egypt - Year-over-year growth 2025-2030 (%)

12.6.4 UAE - Market size and forecast 2025-2030

Chart on UAE - Market size and forecast 2025-2030 ($ million)
Data Table on UAE - Market size and forecast 2025-2030 ($ million)
Chart on UAE - Year-over-year growth 2025-2030 (%)
Data Table on UAE - Year-over-year growth 2025-2030 (%)

12.6.5 Nigeria - Market size and forecast 2025-2030

Chart on Nigeria - Market size and forecast 2025-2030 ($ million)
Data Table on Nigeria - Market size and forecast 2025-2030 ($ million)
Chart on Nigeria - Year-over-year growth 2025-2030 (%)
Data Table on Nigeria - Year-over-year growth 2025-2030 (%)

12.7 South America - Market size and forecast 2025-2030

Chart on South America - Market size and forecast 2025-2030 ($ million)
Data Table on South America - Market size and forecast 2025-2030 ($ million)
Chart on South America - Year-over-year growth 2025-2030 (%)
Data Table on South America - Year-over-year growth 2025-2030 (%)
Chart on Regional Comparison - South America
Data Table on Regional Comparison - South America

12.7.1 Brazil - Market size and forecast 2025-2030

Chart on Brazil - Market size and forecast 2025-2030 ($ million)
Data Table on Brazil - Market size and forecast 2025-2030 ($ million)
Chart on Brazil - Year-over-year growth 2025-2030 (%)
Data Table on Brazil - Year-over-year growth 2025-2030 (%)

12.7.2 Argentina - Market size and forecast 2025-2030

Chart on Argentina - Market size and forecast 2025-2030 ($ million)
Data Table on Argentina - Market size and forecast 2025-2030 ($ million)
Chart on Argentina - Year-over-year growth 2025-2030 (%)
Data Table on Argentina - Year-over-year growth 2025-2030 (%)

12.7.3 Chile - Market size and forecast 2025-2030

Chart on Chile - Market size and forecast 2025-2030 ($ million)
Data Table on Chile - Market size and forecast 2025-2030 ($ million)
Chart on Chile - Year-over-year growth 2025-2030 (%)
Data Table on Chile - Year-over-year growth 2025-2030 (%)

12.8 Market opportunity by geography

Market opportunity by geography ($ million)
Data Tables on Market opportunity by geography ($ million)

13. Drivers, Challenges, and Opportunity

13.1 Market drivers

Rising global demand for bioethanol and renewable fuel mandates
Robust expansion in animal feed and livestock nutrition sector
Growing industrial fermentation and clean-label food applications

13.2 Market challenges

Climatic volatility and raw material insecurity
Regulatory distortions and feedstock diversion
Competition from alternative sweeteners

13.3 Impact of drivers and challenges

Impact of drivers and challenges in 2025 and 2030

13.4 Market opportunities

Integration of precision fermentation and the bio-manufacturing shift
Capital expenditure contraction and long-term supply tightening
Market bifurcation and premiumization of food-grade ingredients

14. Competitive Landscape

14.1 Overview

14.2

Overview on criticality of inputs and factors of differentiation

14.3 Landscape disruption

Overview on factors of disruption

14.4 Industry risks

Impact of key risks on business

15. Competitive Analysis

15.1 Companies profiled

Companies covered

15.2 Company ranking index

15.3 Market positioning of companies

Matrix on companies position and classification

15.4 Archer Daniels Midland Co.

Archer Daniels Midland Co. - Overview
Archer Daniels Midland Co. - Business segments
Archer Daniels Midland Co. - Key news
Archer Daniels Midland Co. - Key offerings
Archer Daniels Midland Co. - Segment focus
SWOT

15.5 Associated British Foods Plc

Associated British Foods Plc - Overview
Associated British Foods Plc - Business segments
Associated British Foods Plc - Key offerings
Associated British Foods Plc - Segment focus
SWOT

15.6 B and G Foods Inc.

B and G Foods Inc. - Overview
B and G Foods Inc. - Product / Service
B and G Foods Inc. - Key offerings
SWOT

15.7 Cargill Inc.

Cargill Inc. - Overview
Cargill Inc. - Product / Service
Cargill Inc. - Key offerings
SWOT

15.8 Cora Texas Manufacturing Co.

Cora Texas Manufacturing Co. - Overview
Cora Texas Manufacturing Co. - Product / Service
Cora Texas Manufacturing Co. - Key offerings
SWOT

15.9 Crosby Molasses Co. Ltd.

Crosby Molasses Co. Ltd. - Overview
Crosby Molasses Co. Ltd. - Product / Service
Crosby Molasses Co. Ltd. - Key offerings
SWOT

15.10 Florida Crystals Corp.

Florida Crystals Corp. - Overview
Florida Crystals Corp. - Product / Service
Florida Crystals Corp. - Key offerings
SWOT

15.11 Imperial Sugar Co.

Imperial Sugar Co. - Overview
Imperial Sugar Co. - Product / Service
Imperial Sugar Co. - Key offerings
SWOT

15.12 Louis Dreyfus Co. BV

Louis Dreyfus Co. BV - Overview
Louis Dreyfus Co. BV - Product / Service
Louis Dreyfus Co. BV - Key offerings
SWOT

15.13 Malt Products Corp.

Malt Products Corp. - Overview
Malt Products Corp. - Product / Service
Malt Products Corp. - Key offerings
SWOT

15.14 Michigan Sugar Co.

Michigan Sugar Co. - Overview
Michigan Sugar Co. - Product / Service
Michigan Sugar Co. - Key offerings
SWOT

15.15 Mitr Phol Group

Mitr Phol Group - Overview
Mitr Phol Group - Product / Service
Mitr Phol Group - Key offerings
SWOT

15.16 Sudzucker AG

Sudzucker AG - Overview
Sudzucker AG - Business segments
Sudzucker AG - Key offerings
Sudzucker AG - Segment focus
SWOT

15.17 Tereos SCA

Tereos SCA - Overview
Tereos SCA - Product / Service
Tereos SCA - Key offerings
SWOT

15.18 Wilmar International Ltd.

Wilmar International Ltd. - Overview
Wilmar International Ltd. - Business segments
Wilmar International Ltd. - Key offerings
Wilmar International Ltd. - Segment focus
SWOT

16. Appendix

16.1 Scope of the report

Market definition
Objectives
Notes and caveats

16.2 Inclusions and exclusions checklist

Inclusions checklist
Exclusions checklist

16.3 Currency conversion rates for US$

16.4 Research methodology

16.5 Data procurement

Information sources

16.6 Data validation

16.7 Validation techniques employed for market sizing

16.8 Data synthesis

16.9 360 degree market analysis

16.10 List of abbreviations

Research Methodology

Technavio presents a detailed picture of the market by way of study, synthesis, and summation of data from multiple sources. The analysts have presented the various facets of the market with a particular focus on identifying the key industry influencers. The data thus presented is comprehensive, reliable, and the result of extensive research, both primary and secondary.

INFORMATION SOURCES

Primary sources

  • Manufacturers and suppliers
  • Channel partners
  • Industry experts
  • Strategic decision makers

Secondary sources

  • Industry journals and periodicals
  • Government data
  • Financial reports of key industry players
  • Historical data
  • Press releases

DATA ANALYSIS

Data Synthesis

  • Collation of data
  • Estimation of key figures
  • Analysis of derived insights

Data Validation

  • Triangulation with data models
  • Reference against proprietary databases
  • Corroboration with industry experts

REPORT WRITING

Qualitative

  • Market drivers
  • Market challenges
  • Market trends
  • Five forces analysis

Quantitative

  • Market size and forecast
  • Market segmentation
  • Geographical insights
  • Competitive landscape

Interested in this report?

Get your sample now to see our research methodology and insights!

Download Now

Frequently Asked Questions

Molasses market growth will increase by USD 5267.3 million during 2026-2030.

The Molasses market is expected to grow at a CAGR of 5.7% during 2026-2030.

Molasses market is segmented by Application (Feed, Food and beverage) Type (Blackstrap molasses, Regular molasses) Source (Sugarcane, Sugar, Others)

Archer Daniels Midland Co., Associated British Foods Plc, B and G Foods Inc., Cargill Inc., Cora Texas Manufacturing Co., Cosan SA, Cosun Beet Co., Crosby Molasses Co. Ltd., Florida Crystals Corp., Imperial Sugar Co., Louis Dreyfus Co. BV, Malt Products Corp., Michigan Sugar Co., Mitr Phol Group, Nordzucker AG, Sudzucker AG, Tereos SCA, Wilmar International Ltd., Zook AG are a few of the key vendors in the Molasses market.

APAC will register the highest growth rate of 63.1% among the other regions. Therefore, the Molasses market in APAC is expected to garner significant business opportunities for the vendors during the forecast period.

India, China, Thailand, Japan, South Korea, Australia, US, Canada, Mexico, Germany, France, UK, Italy, Spain, The Netherlands, Saudi Arabia, South Africa, Egypt, UAE, Nigeria, Brazil, Argentina, Chile

  • Rising global demand for bioethanol and renewable fuel mandates is the driving factor this market.

The Molasses market vendors should focus on grabbing business opportunities from the Application segment as it accounted for the largest market share in the base year.
RIA - Research AI Assistant
Ask RIA