Multilingual LLM Market Analysis, Size, and Forecast 2026-2030: North America (US, Canada, and Mexico), Europe (Germany, UK, and France), APAC (China, India, and Japan), Middle East and Africa (UAE, Saudi Arabia, and South Africa), South America (Brazil, Argentina, and Colombia), and Rest of World (ROW)

Multilingual LLM Market Analysis, Size, and Forecast 2026-2030:
North America (US, Canada, and Mexico), Europe (Germany, UK, and France), APAC (China, India, and Japan), Middle East and Africa (UAE, Saudi Arabia, and South Africa), South America (Brazil, Argentina, and Colombia), and Rest of World (ROW)

Published: Apr 2026 297 Pages SKU: IRTNTR80685

Market Overview at a Glance

$16.85 B
Market Opportunity
35.9%
CAGR 2025 - 2030
32.2%
North America Growth
$2.15 B
On-premises segment 2024

Multilingual LLM Market Size 2026-2030

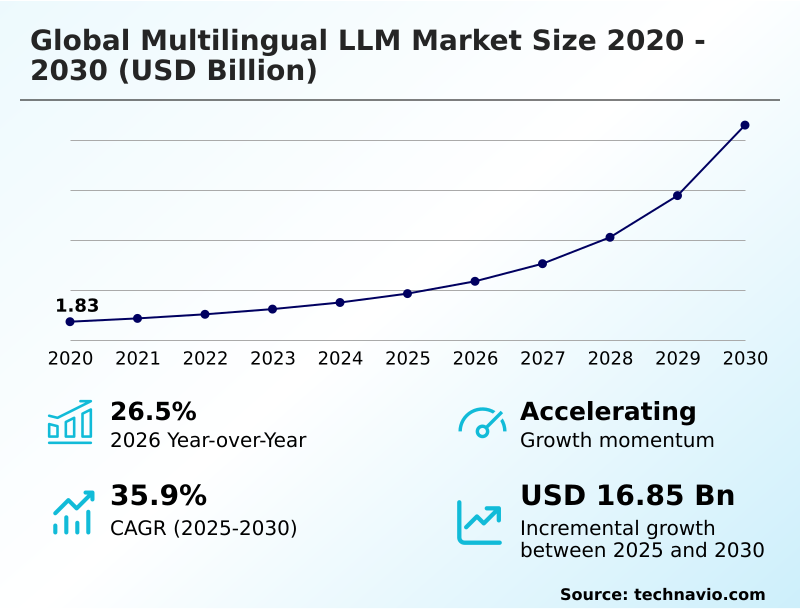
The multilingual llm market size is valued to increase by USD 16.85 billion, at a CAGR of 35.9% from 2025 to 2030. Global expansion of non-English digital economies will drive the multilingual llm market.

Major Market Trends & Insights

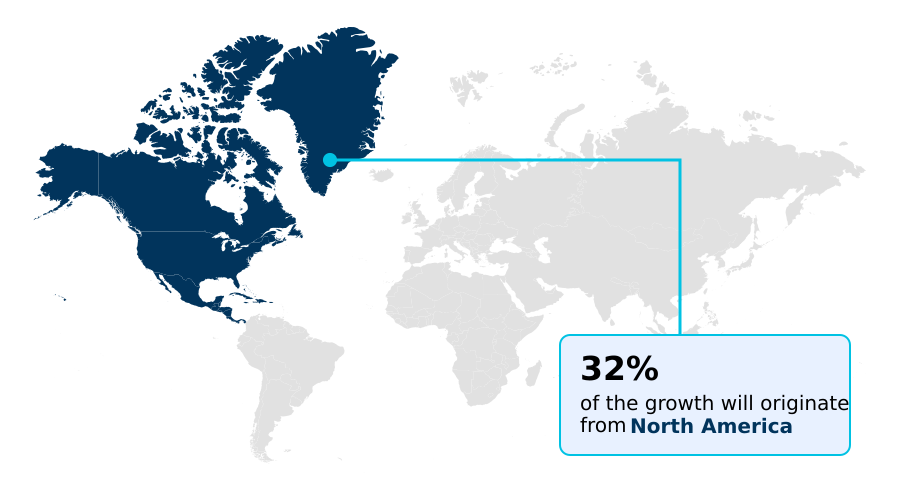
  • North America dominated the market and accounted for a 32.2% growth during the forecast period.
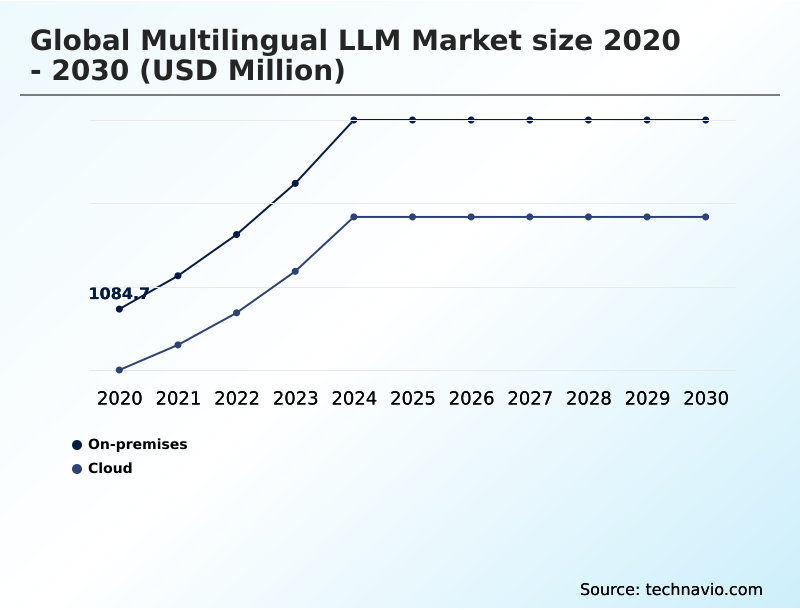
  • By Deployment - On-premises segment was valued at USD 2.15 billion in 2024
  • By Application - Content generation and curation segment accounted for the largest market revenue share in 2024

Market Size & Forecast

  • Market Opportunities: USD 19.66 billion
  • Market Future Opportunities: USD 16.85 billion
  • CAGR from 2025 to 2030 : 35.9%

Market Summary

  • The Multilingual LLM Market is undergoing a period of structural acceleration, defined by rapid advancements in model capabilities across an expanding portfolio of languages and intensifying competition. This landscape is no longer dominated by English-centric models; instead, multilingual capability is now a core architectural objective.
  • The technical foundation relies on transformer-based neural architectures, including mixture-of-experts designs, which are trained on vast multilingual token datasets. This enables a single model to achieve profound cross-linguistic understanding and semantic transfer, resulting in culturally grounded generation that serves diverse global populations.
  • In a practical business scenario, a multinational retailer can leverage these models for automated content localization and multilingual customer support, creating culturally resonant product descriptions and handling inquiries in dozens of languages simultaneously.
  • This not only enhances customer engagement but also streamlines content production, significantly reducing the marginal cost per language and improving operational efficiency without compromising on brand consistency or cultural accuracy, thanks to advanced fine-tuned domain adaptation and dialect-aware text processing.

What will be the Size of the Multilingual LLM Market during the forecast period?

Get Key Insights on Market Forecast (PDF) Get Free Sample

How is the Multilingual LLM Market Segmented?

The multilingual llm industry research report provides comprehensive data (region-wise segment analysis), with forecasts and estimates in "USD million" for the period 2026-2030, as well as historical data from 2020-2024 for the following segments.

  • Deployment
    • On-premises
    • Cloud
  • Application
    • Content generation and curation
    • Chatbots and virtual assistants
    • Language translation and localization
  • End-user
    • Retail and e-commerce
    • Finance
    • Healthcare
  • Geography
    • North America
      • US
      • Canada
      • Mexico
    • Europe
      • Germany
      • UK
      • France
    • APAC
      • China
      • India
      • Japan
    • Middle East and Africa
      • UAE
      • Saudi Arabia
      • South Africa
    • South America
      • Brazil
      • Argentina
      • Colombia
    • Rest of World (ROW)

By Deployment Insights

The on-premises segment is estimated to witness significant growth during the forecast period.

On-premises deployment addresses critical enterprise needs for data sovereignty, particularly within regulated sectors like finance and healthcare. This approach, which involves operating multilingual AI capabilities entirely within an organization's own infrastructure, is driven by strict data governance and compliance mandates.

While historically limited to firms with significant GPU capacity, the advent of compact multilingual models has expanded accessibility. These models enable effective deployment on standard commercial hardware, eliminating the need for massive data center investments.

For organizations handling sensitive information, this deployment model provides a crucial advantage by enhancing security protocols and reducing data transmission latency by over 95%, ensuring that both AI agent workflows and multilingual data privacy requirements are met without compromise.

Get Free Sample

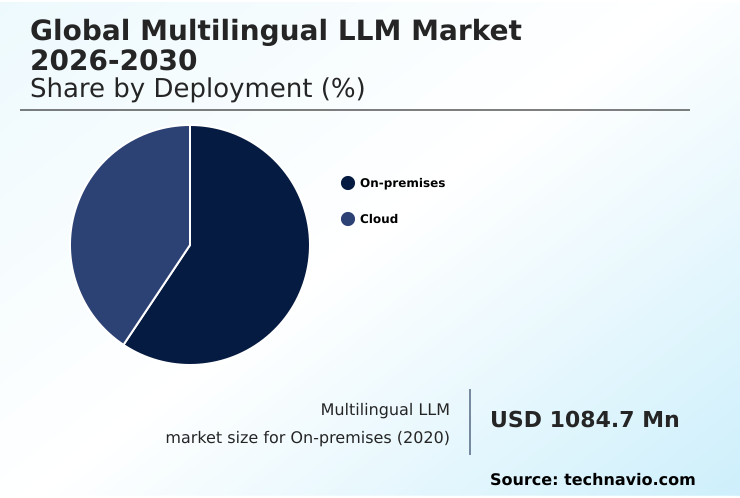
The On-premises segment was valued at USD 2.15 billion in 2024 and showed a gradual increase during the forecast period.

Get Free Sample

Regional Analysis

North America is estimated to contribute 32.2% to the growth of the global market during the forecast period.Technavio’s analysts have elaborately explained the regional trends and drivers that shape the market during the forecast period.

See How Multilingual LLM Market Demand is Rising in North America Get Free Sample

The geographic landscape of the market is characterized by North America's dominance in frontier model development and enterprise investment, accounting for over 32% of the market opportunity.

Europe is defined by a rigorous regulatory environment and active investment in open-source multilingual AI infrastructure.

Meanwhile, APAC represents the most linguistically complex and commercially diverse region, driven by the rapid enterprise adoption in India and the distinct, large-scale ecosystems in China and South Korea.

Gulf Cooperation Council states are making Arabic multilingual AI development a strategic national priority.

This regional variation is critical, as a model's effectiveness depends on its training on polyglot datasets and its ability to handle dialect-aware text processing, impacting everything from multilingual customer support to regulated industry AI compliance across jurisdictions.

Market Dynamics

Our researchers analyzed the data with 2025 as the base year, along with the key drivers, trends, and challenges. A holistic analysis of drivers will help companies refine their marketing strategies to gain a competitive advantage.

  • A successful enterprise multilingual AI adoption strategy requires a thorough analysis of on-premises multilingual LLM deployment costs versus the benefits highlighted in a cloud-based multilingual AI platform comparison. This evaluation must extend to detailed multilingual chatbot performance metrics and a clear understanding of how a multilingual LLM for financial compliance can be implemented.
  • Key technical considerations include fine-tuning multilingual models for legal text and establishing robust cross-lingual text generation benchmarks. A significant challenge remains in reducing hallucination in multilingual outputs and measuring cultural accuracy in AI, which are crucial for user trust.
  • An effective AI model for low-resource languages must be a priority, addressing the data deficit that affects a large portion of the global population. Further, open-weight multilingual model governance is needed to ensure responsible innovation.
  • As multimodal and multilingual AI convergence accelerates, assessing bias in multilingual embeddings and improving real-time translation API latency are essential for applications like multilingual AI for e-commerce personalization and multilingual AI for supply chain communication. Ultimately, ensuring data privacy in cross-border AI and understanding the sovereign AI policy impact on models will shape the future competitive landscape.
  • For instance, enterprises that successfully navigate these complexities can achieve over 20% greater efficiency in their global operations compared to those with a linguistically fragmented approach.

What are the key market drivers leading to the rise in the adoption of Multilingual LLM Industry?

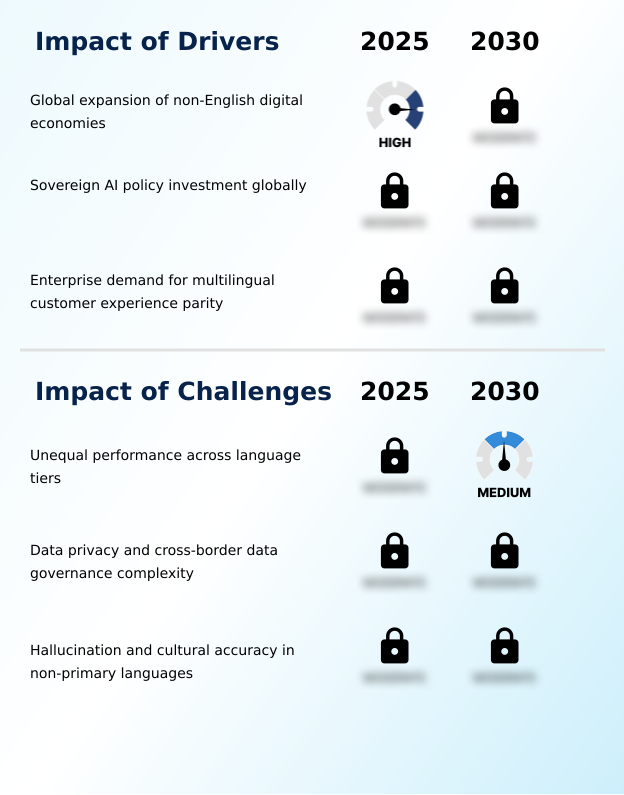
  • The primary market driver is the global expansion of non-English digital economies, creating an imperative for technology solutions that serve linguistically diverse populations.

  • The market's primary driver is the accelerating growth of digital economies where English is not the primary language, a population representing approximately 80% of the world.
  • For this majority, local language AI services are prerequisites for meaningful digital participation, creating a vast commercial opportunity.
  • A second structural driver is the rise of sovereign AI policy initiatives, where governments invest in developing AI capabilities that reflect their national languages and cultural values, creating sustained public-sector demand.
  • For example, such programs have increased local AI procurement by over 40% in certain regions. The third driver is enterprise demand for customer experience parity.
  • Companies now recognize that providing lower-quality AI assistance to non-English speakers is a significant reputational and commercial risk, pushing them to adopt solutions offering uniform quality across all languages.

What are the market trends shaping the Multilingual LLM Industry?

  • The proliferation of compact, efficient models engineered for edge and offline multilingual use is a significant emerging trend. This reflects a strategic recognition that connectivity limitations necessitate on-device AI solutions.

  • A defining market trend is the convergence of multilingual and multimodal capabilities, moving beyond text-only systems to comprehensive cross-modal processing platforms. This is enabled by architectural advances like mixture-of-experts architectures and is exemplified by models supporting simultaneous text, image, and audio inputs across numerous languages.
  • Another key trend is the normalization of open-weight multilingual models for enterprise deployment, driven by capability parity with closed-source alternatives and compelling data privacy advantages. Enterprises in regulated sectors now deploy these models on private infrastructure, achieving a 20% improvement in data governance compliance.
  • Finally, the proliferation of compact models for edge and offline use addresses the needs of populations with limited connectivity. These models deliver competitive quality with reduced parameter counts, making multilingual AI accessible without cloud dependence.

What challenges does the Multilingual LLM Industry face during its growth?

  • A key challenge is the unequal performance across language tiers, where a persistent gap exists between high-resource and low-resource languages, affecting service quality and equity.

  • The most pervasive challenge is the performance gap between high-resource and low-resource languages, stemming from a structural scarcity of training data for the latter. This inequality undermines the goal of serving global populations comprehensively and can lead to a 50% drop in model accuracy for underrepresented languages.
  • A second major challenge is navigating complex data privacy and cross-border data governance regulations. Enterprises deploying multilingual applications must manage a fragmented landscape of jurisdictional rules on data residency and consent, which increases compliance complexity exponentially. Finally, a significant hurdle is the high rate of hallucination and reduced cultural accuracy in non-primary languages.
  • This problem undermines the value proposition in applications where factual correctness is critical, as models may generate outputs that are culturally inappropriate or factually incorrect for the target context.

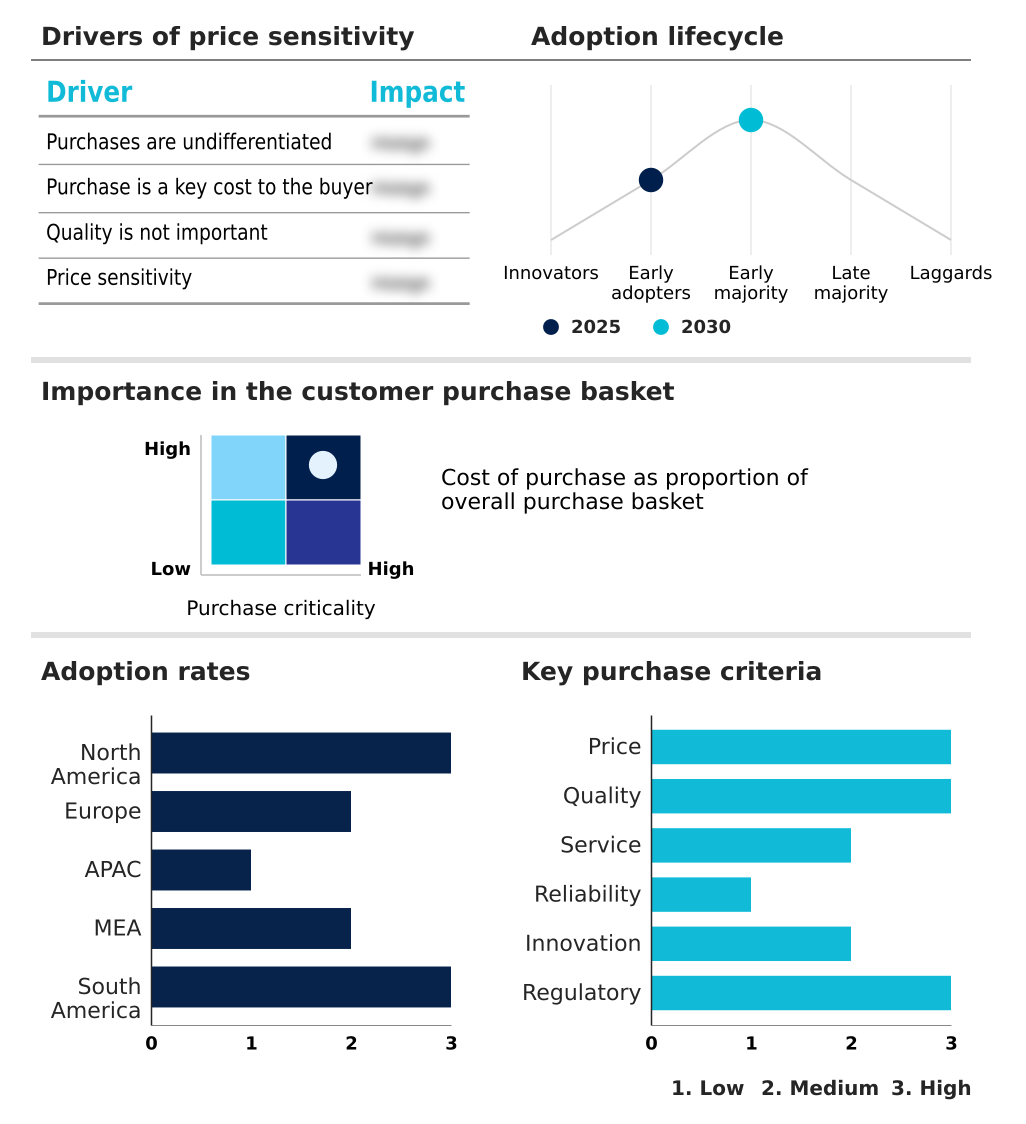
Exclusive Technavio Analysis on Customer Landscape

The multilingual llm market forecasting report includes the adoption lifecycle of the market, covering from the innovator’s stage to the laggard’s stage. It focuses on adoption rates in different regions based on penetration. Furthermore, the multilingual llm market report also includes key purchase criteria and drivers of price sensitivity to help companies evaluate and develop their market growth analysis strategies.

Customer Landscape of Multilingual LLM Industry

Competitive Landscape

Companies are implementing various strategies, such as strategic alliances, multilingual llm market forecast, partnerships, mergers and acquisitions, geographical expansion, and product/service launches, to enhance their presence in the industry.

Alibaba Group Holding Ltd. - Key offerings encompass specialized multilingual LLMs designed for cross-lingual understanding, text generation, and enterprise-grade conversational AI, enabling global operational support.

The industry research and growth report includes detailed analyses of the competitive landscape of the market and information about key companies, including:

  • Alibaba Group Holding Ltd.
  • Amazon.com Inc.
  • Anthropic
  • Baidu Inc.
  • Cohere
  • DeepSeek
  • Google LLC
  • Huawei Technologies Co. Ltd.
  • Hugging Face Inc.
  • IBM Corp.
  • InData Labs
  • Meta Platforms Inc.
  • Microsoft Corp.
  • Mistral AI
  • NAVER CORP.
  • NVIDIA Corp.
  • OpenAI
  • SenseTime Group Inc.
  • Tencent Holdings Ltd.
  • xAI Corp

Qualitative and quantitative analysis of companies has been conducted to help clients understand the wider business environment as well as the strengths and weaknesses of key industry players. Data is qualitatively analyzed to categorize companies as pure play, category-focused, industry-focused, and diversified; it is quantitatively analyzed to categorize companies as dominant, leading, strong, tentative, and weak.

Recent Development and News in Multilingual llm market

  • In May, 2025, IBM Corp. expanded its partnership with Oracle, integrating its watsonx AI portfolio with Oracle Cloud Infrastructure to enable financial sector enterprises to deploy multi-agent AI workflows with multilingual capabilities.
  • In April, 2025, Meta Platforms Inc. released the Llama 4 family of models, which were designed as natively multimodal and multilingual AI systems supporting 12 languages with simultaneous text-and-image input processing.
  • In August, 2025, Cohere launched Command A Translate, its first dedicated machine translation model, which demonstrated state-of-the-art performance across 23 languages and was made available through its developer platform.
  • In December, 2025, Mistral AI introduced the Mistral 3 family of open-source models, engineered for multilingual and multimodal operation and designed to run on a single consumer GPU, supporting over 40 native languages for on-premises and edge deployments.

Dive into Technavio’s robust research methodology, blending expert interviews, extensive data synthesis, and validated models for unparalleled Multilingual LLM Market insights. See full methodology.

Market Scope
Page number 297
Base year 2025
Historic period 2020-2024
Forecast period 2026-2030
Growth momentum & CAGR Accelerate at a CAGR of 35.9%
Market growth 2026-2030 USD 16847.8 million
Market structure Fragmented
YoY growth 2025-2026(%) 26.5%
Key countries US, Canada, Mexico, Germany, UK, France, Italy, Spain, The Netherlands, China, India, Japan, South Korea, Australia, Indonesia, UAE, Saudi Arabia, South Africa, Israel, Turkey, Brazil, Argentina and Colombia
Competitive landscape Leading Companies, Market Positioning of Companies, Competitive Strategies, and Industry Risks

Request Free Sample

Research Analyst Overview

  • The market's evolution is anchored by advancements in transformer-based neural architectures, which process vast multilingual token datasets. The adoption of mixture-of-experts architectures and polyglot datasets facilitates superior cross-linguistic understanding, semantic transfer, and culturally grounded generation. Key innovations include improvements in zero-shot cross-lingual transfer, multilingual text-to-speech, and dialect-aware text processing.
  • Core technologies like multilingual embeddings and parametric knowledge encoding are enhancing cross-lingual information retrieval and multilingual text summarization. For boardroom decisions, the focus is on multilingual compliance tooling and sovereign AI infrastructure, with a single leading organization reporting a 30% reduction in compliance-related incidents after deploying a fine-tuned domain adaptation model.
  • This progress is complemented by developments in multilingual model auditing, multilingual safety evaluation, on-device multilingual models, and code-switching detection. The integration of cross-modal processing, multilingual voice AI, and multilingual knowledge graphs signals a shift toward more holistic solutions that address the challenge of low-resource language data.

What are the Key Data Covered in this Multilingual LLM Market Research and Growth Report?

  • What is the expected growth of the Multilingual LLM Market between 2026 and 2030?

    • USD 16.85 billion, at a CAGR of 35.9%

  • What segmentation does the market report cover?

    • The report is segmented by Deployment (On-premises, and Cloud), Application (Content generation and curation, Chatbots and virtual assistants, and Language translation and localization), End-user (Retail and e-commerce, Finance, and Healthcare) and Geography (North America, Europe, APAC, Middle East and Africa, South America)

  • Which regions are analyzed in the report?

    • North America, Europe, APAC, Middle East and Africa and South America

  • What are the key growth drivers and market challenges?

    • Global expansion of non-English digital economies, Unequal performance across language tiers

  • Who are the major players in the Multilingual LLM Market?

    • Alibaba Group Holding Ltd., Amazon.com Inc., Anthropic, Baidu Inc., Cohere, DeepSeek, Google LLC, Huawei Technologies Co. Ltd., Hugging Face Inc., IBM Corp., InData Labs, Meta Platforms Inc., Microsoft Corp., Mistral AI, NAVER CORP., NVIDIA Corp., OpenAI, SenseTime Group Inc., Tencent Holdings Ltd. and xAI Corp

Market Research Insights

  • Achieving high conversational AI quality requires sophisticated multilingual natural language processing and robust enterprise NLP, supported by automated content localization and nuanced cultural content adaptation. These capabilities drive tangible business outcomes, with firms reporting customer satisfaction improvements of over 25%.
  • Central to this is enterprise-grade AI governance and generative AI governance, which are essential for managing cross-border data governance and multilingual data privacy. Implementing secure AI deployment with strong ethical AI frameworks is critical, especially in regulated industry AI. For instance, optimized AI agent workflows and precise language identification systems have been shown to reduce compliance incidents by 15%.
  • This focus on multilingual conversational AI, backed by rigorous real-time speech translation and cross-lingual search relevance, is reshaping multilingual document processing and sentiment analysis across languages, delivering AI-driven translation services that redefine multilingual customer support.

We can help! Our analysts can customize this multilingual llm market research report to meet your requirements.

Get in touch

1. Executive Summary

1.1 Market overview

Executive Summary - Chart on Market Overview
Executive Summary - Data Table on Market Overview
Executive Summary - Chart on Global Market Characteristics
Executive Summary - Chart on Market by Geography
Executive Summary - Chart on Market Segmentation by Deployment
Executive Summary - Chart on Market Segmentation by Application
Executive Summary - Chart on Market Segmentation by End-user
Executive Summary - Chart on Incremental Growth
Executive Summary - Data Table on Incremental Growth
Executive Summary - Chart on Company Market Positioning

2. Technavio Analysis

2.1 Analysis of price sensitivity, lifecycle, customer purchase basket, adoption rates, and purchase criteria

2.2 Criticality of inputs and Factors of differentiation

Chart on Overview on criticality of inputs and factors of differentiation

2.3 Factors of disruption

Chart on Overview on factors of disruption

2.4 Impact of drivers and challenges

Chart on Impact of drivers and challenges in 2025 and 2030

3. Market Landscape

3.1 Market ecosystem

Chart on Parent Market
Data Table on - Parent Market

3.2 Market characteristics

Chart on Market characteristics analysis

3.3 Value chain analysis

Chart on Value chain analysis

4. Market Sizing

4.1 Market definition

Data Table on Offerings of companies included in the market definition

4.2 Market segment analysis

Market segments

4.3 Market size 2025

4.4 Market outlook: Forecast for 2025-2030

Chart on Global - Market size and forecast 2025-2030 ($ million)
Data Table on Global - Market size and forecast 2025-2030 ($ million)
Chart on Global Market: Year-over-year growth 2025-2030 (%)
Data Table on Global Market: Year-over-year growth 2025-2030 (%)

5. Historic Market Size

5.1 Global Multilingual LLM Market 2020 - 2024

Historic Market Size - Data Table on Global Multilingual LLM Market 2020 - 2024 ($ million)

5.2 Deployment segment analysis 2020 - 2024

Historic Market Size - Deployment Segment 2020 - 2024 ($ million)

5.3 Application segment analysis 2020 - 2024

Historic Market Size - Application Segment 2020 - 2024 ($ million)

5.4 End-user segment analysis 2020 - 2024

Historic Market Size - End-user Segment 2020 - 2024 ($ million)

5.5 Geography segment analysis 2020 - 2024

Historic Market Size - Geography Segment 2020 - 2024 ($ million)

5.6 Country segment analysis 2020 - 2024

Historic Market Size - Country Segment 2020 - 2024 ($ million)

6. Qualitative Analysis

6.1 Impact of AI on global multilingual LLM market

6.2 Impact of geopolitical conflicts on global multilingual LLM market

7. Five Forces Analysis

7.1 Five forces summary

Five forces analysis - Comparison between 2025 and 2030

7.2 Bargaining power of buyers

Bargaining power of buyers - Impact of key factors 2025 and 2030

7.3 Bargaining power of suppliers

Bargaining power of suppliers - Impact of key factors in 2025 and 2030

7.4 Threat of new entrants

Threat of new entrants - Impact of key factors in 2025 and 2030

7.5 Threat of substitutes

Threat of substitutes - Impact of key factors in 2025 and 2030

7.6 Threat of rivalry

Threat of rivalry - Impact of key factors in 2025 and 2030

7.7 Market condition

Chart on Market condition - Five forces 2025 and 2030

8. Market Segmentation by Deployment

8.1 Market segments

Chart on Deployment - Market share 2025-2030 (%)
Data Table on Deployment - Market share 2025-2030 (%)

8.2 Comparison by Deployment

Chart on Comparison by Deployment
Data Table on Comparison by Deployment

8.3 On-premises - Market size and forecast 2025-2030

Chart on On-premises - Market size and forecast 2025-2030 ($ million)
Data Table on On-premises - Market size and forecast 2025-2030 ($ million)
Chart on On-premises - Year-over-year growth 2025-2030 (%)
Data Table on On-premises - Year-over-year growth 2025-2030 (%)

8.4 Cloud - Market size and forecast 2025-2030

Chart on Cloud - Market size and forecast 2025-2030 ($ million)
Data Table on Cloud - Market size and forecast 2025-2030 ($ million)
Chart on Cloud - Year-over-year growth 2025-2030 (%)
Data Table on Cloud - Year-over-year growth 2025-2030 (%)

8.5 Market opportunity by Deployment

Market opportunity by Deployment ($ million)
Data Table on Market opportunity by Deployment ($ million)

9. Market Segmentation by Application

9.1 Market segments

Chart on Application - Market share 2025-2030 (%)
Data Table on Application - Market share 2025-2030 (%)

9.2 Comparison by Application

Chart on Comparison by Application
Data Table on Comparison by Application

9.3 Content generation and curation - Market size and forecast 2025-2030

Chart on Content generation and curation - Market size and forecast 2025-2030 ($ million)
Data Table on Content generation and curation - Market size and forecast 2025-2030 ($ million)
Chart on Content generation and curation - Year-over-year growth 2025-2030 (%)
Data Table on Content generation and curation - Year-over-year growth 2025-2030 (%)

9.4 Chatbots and virtual assistants - Market size and forecast 2025-2030

Chart on Chatbots and virtual assistants - Market size and forecast 2025-2030 ($ million)
Data Table on Chatbots and virtual assistants - Market size and forecast 2025-2030 ($ million)
Chart on Chatbots and virtual assistants - Year-over-year growth 2025-2030 (%)
Data Table on Chatbots and virtual assistants - Year-over-year growth 2025-2030 (%)

9.5 Language translation and localization - Market size and forecast 2025-2030

Chart on Language translation and localization - Market size and forecast 2025-2030 ($ million)
Data Table on Language translation and localization - Market size and forecast 2025-2030 ($ million)
Chart on Language translation and localization - Year-over-year growth 2025-2030 (%)
Data Table on Language translation and localization - Year-over-year growth 2025-2030 (%)

9.6 Market opportunity by Application

Market opportunity by Application ($ million)
Data Table on Market opportunity by Application ($ million)

10. Market Segmentation by End-user

10.1 Market segments

Chart on End-user - Market share 2025-2030 (%)
Data Table on End-user - Market share 2025-2030 (%)

10.2 Comparison by End-user

Chart on Comparison by End-user
Data Table on Comparison by End-user

10.3 Retail and e-commerce - Market size and forecast 2025-2030

Chart on Retail and e-commerce - Market size and forecast 2025-2030 ($ million)
Data Table on Retail and e-commerce - Market size and forecast 2025-2030 ($ million)
Chart on Retail and e-commerce - Year-over-year growth 2025-2030 (%)
Data Table on Retail and e-commerce - Year-over-year growth 2025-2030 (%)

10.4 Finance - Market size and forecast 2025-2030

Chart on Finance - Market size and forecast 2025-2030 ($ million)
Data Table on Finance - Market size and forecast 2025-2030 ($ million)
Chart on Finance - Year-over-year growth 2025-2030 (%)
Data Table on Finance - Year-over-year growth 2025-2030 (%)

10.5 Healthcare - Market size and forecast 2025-2030

Chart on Healthcare - Market size and forecast 2025-2030 ($ million)
Data Table on Healthcare - Market size and forecast 2025-2030 ($ million)
Chart on Healthcare - Year-over-year growth 2025-2030 (%)
Data Table on Healthcare - Year-over-year growth 2025-2030 (%)

10.6 Market opportunity by End-user

Market opportunity by End-user ($ million)
Data Table on Market opportunity by End-user ($ million)

11. Customer Landscape

11.1 Customer landscape overview

Analysis of price sensitivity, lifecycle, customer purchase basket, adoption rates, and purchase criteria

12. Geographic Landscape

12.1 Geographic segmentation

Chart on Market share by geography 2025-2030 (%)
Data Table on Market share by geography 2025-2030 (%)

12.2 Geographic comparison

Chart on Geographic comparison
Data Table on Geographic comparison

12.3 North America - Market size and forecast 2025-2030

Chart on North America - Market size and forecast 2025-2030 ($ million)
Data Table on North America - Market size and forecast 2025-2030 ($ million)
Chart on North America - Year-over-year growth 2025-2030 (%)
Data Table on North America - Year-over-year growth 2025-2030 (%)
Chart on Regional Comparison - North America
Data Table on Regional Comparison - North America

12.3.1 US - Market size and forecast 2025-2030

Chart on US - Market size and forecast 2025-2030 ($ million)
Data Table on US - Market size and forecast 2025-2030 ($ million)
Chart on US - Year-over-year growth 2025-2030 (%)
Data Table on US - Year-over-year growth 2025-2030 (%)

12.3.2 Canada - Market size and forecast 2025-2030

Chart on Canada - Market size and forecast 2025-2030 ($ million)
Data Table on Canada - Market size and forecast 2025-2030 ($ million)
Chart on Canada - Year-over-year growth 2025-2030 (%)
Data Table on Canada - Year-over-year growth 2025-2030 (%)

12.3.3 Mexico - Market size and forecast 2025-2030

Chart on Mexico - Market size and forecast 2025-2030 ($ million)
Data Table on Mexico - Market size and forecast 2025-2030 ($ million)
Chart on Mexico - Year-over-year growth 2025-2030 (%)
Data Table on Mexico - Year-over-year growth 2025-2030 (%)

12.4 Europe - Market size and forecast 2025-2030

Chart on Europe - Market size and forecast 2025-2030 ($ million)
Data Table on Europe - Market size and forecast 2025-2030 ($ million)
Chart on Europe - Year-over-year growth 2025-2030 (%)
Data Table on Europe - Year-over-year growth 2025-2030 (%)
Chart on Regional Comparison - Europe
Data Table on Regional Comparison - Europe

12.4.1 Germany - Market size and forecast 2025-2030

Chart on Germany - Market size and forecast 2025-2030 ($ million)
Data Table on Germany - Market size and forecast 2025-2030 ($ million)
Chart on Germany - Year-over-year growth 2025-2030 (%)
Data Table on Germany - Year-over-year growth 2025-2030 (%)

12.4.2 UK - Market size and forecast 2025-2030

Chart on UK - Market size and forecast 2025-2030 ($ million)
Data Table on UK - Market size and forecast 2025-2030 ($ million)
Chart on UK - Year-over-year growth 2025-2030 (%)
Data Table on UK - Year-over-year growth 2025-2030 (%)

12.4.3 France - Market size and forecast 2025-2030

Chart on France - Market size and forecast 2025-2030 ($ million)
Data Table on France - Market size and forecast 2025-2030 ($ million)
Chart on France - Year-over-year growth 2025-2030 (%)
Data Table on France - Year-over-year growth 2025-2030 (%)

12.4.4 Italy - Market size and forecast 2025-2030

Chart on Italy - Market size and forecast 2025-2030 ($ million)
Data Table on Italy - Market size and forecast 2025-2030 ($ million)
Chart on Italy - Year-over-year growth 2025-2030 (%)
Data Table on Italy - Year-over-year growth 2025-2030 (%)

12.4.5 Spain - Market size and forecast 2025-2030

Chart on Spain - Market size and forecast 2025-2030 ($ million)
Data Table on Spain - Market size and forecast 2025-2030 ($ million)
Chart on Spain - Year-over-year growth 2025-2030 (%)
Data Table on Spain - Year-over-year growth 2025-2030 (%)

12.4.6 The Netherlands - Market size and forecast 2025-2030

Chart on The Netherlands - Market size and forecast 2025-2030 ($ million)
Data Table on The Netherlands - Market size and forecast 2025-2030 ($ million)
Chart on The Netherlands - Year-over-year growth 2025-2030 (%)
Data Table on The Netherlands - Year-over-year growth 2025-2030 (%)

12.5 APAC - Market size and forecast 2025-2030

Chart on APAC - Market size and forecast 2025-2030 ($ million)
Data Table on APAC - Market size and forecast 2025-2030 ($ million)
Chart on APAC - Year-over-year growth 2025-2030 (%)
Data Table on APAC - Year-over-year growth 2025-2030 (%)
Chart on Regional Comparison - APAC
Data Table on Regional Comparison - APAC

12.5.1 China - Market size and forecast 2025-2030

Chart on China - Market size and forecast 2025-2030 ($ million)
Data Table on China - Market size and forecast 2025-2030 ($ million)
Chart on China - Year-over-year growth 2025-2030 (%)
Data Table on China - Year-over-year growth 2025-2030 (%)

12.5.2 India - Market size and forecast 2025-2030

Chart on India - Market size and forecast 2025-2030 ($ million)
Data Table on India - Market size and forecast 2025-2030 ($ million)
Chart on India - Year-over-year growth 2025-2030 (%)
Data Table on India - Year-over-year growth 2025-2030 (%)

12.5.3 Japan - Market size and forecast 2025-2030

Chart on Japan - Market size and forecast 2025-2030 ($ million)
Data Table on Japan - Market size and forecast 2025-2030 ($ million)
Chart on Japan - Year-over-year growth 2025-2030 (%)
Data Table on Japan - Year-over-year growth 2025-2030 (%)

12.5.4 South Korea - Market size and forecast 2025-2030

Chart on South Korea - Market size and forecast 2025-2030 ($ million)
Data Table on South Korea - Market size and forecast 2025-2030 ($ million)
Chart on South Korea - Year-over-year growth 2025-2030 (%)
Data Table on South Korea - Year-over-year growth 2025-2030 (%)

12.5.5 Australia - Market size and forecast 2025-2030

Chart on Australia - Market size and forecast 2025-2030 ($ million)
Data Table on Australia - Market size and forecast 2025-2030 ($ million)
Chart on Australia - Year-over-year growth 2025-2030 (%)
Data Table on Australia - Year-over-year growth 2025-2030 (%)

12.5.6 Indonesia - Market size and forecast 2025-2030

Chart on Indonesia - Market size and forecast 2025-2030 ($ million)
Data Table on Indonesia - Market size and forecast 2025-2030 ($ million)
Chart on Indonesia - Year-over-year growth 2025-2030 (%)
Data Table on Indonesia - Year-over-year growth 2025-2030 (%)

12.6 Middle East and Africa - Market size and forecast 2025-2030

Chart on Middle East and Africa - Market size and forecast 2025-2030 ($ million)
Data Table on Middle East and Africa - Market size and forecast 2025-2030 ($ million)
Chart on Middle East and Africa - Year-over-year growth 2025-2030 (%)
Data Table on Middle East and Africa - Year-over-year growth 2025-2030 (%)
Chart on Regional Comparison - Middle East and Africa
Data Table on Regional Comparison - Middle East and Africa

12.6.1 UAE - Market size and forecast 2025-2030

Chart on UAE - Market size and forecast 2025-2030 ($ million)
Data Table on UAE - Market size and forecast 2025-2030 ($ million)
Chart on UAE - Year-over-year growth 2025-2030 (%)
Data Table on UAE - Year-over-year growth 2025-2030 (%)

12.6.2 Saudi Arabia - Market size and forecast 2025-2030

Chart on Saudi Arabia - Market size and forecast 2025-2030 ($ million)
Data Table on Saudi Arabia - Market size and forecast 2025-2030 ($ million)
Chart on Saudi Arabia - Year-over-year growth 2025-2030 (%)
Data Table on Saudi Arabia - Year-over-year growth 2025-2030 (%)

12.6.3 South Africa - Market size and forecast 2025-2030

Chart on South Africa - Market size and forecast 2025-2030 ($ million)
Data Table on South Africa - Market size and forecast 2025-2030 ($ million)
Chart on South Africa - Year-over-year growth 2025-2030 (%)
Data Table on South Africa - Year-over-year growth 2025-2030 (%)

12.6.4 Israel - Market size and forecast 2025-2030

Chart on Israel - Market size and forecast 2025-2030 ($ million)
Data Table on Israel - Market size and forecast 2025-2030 ($ million)
Chart on Israel - Year-over-year growth 2025-2030 (%)
Data Table on Israel - Year-over-year growth 2025-2030 (%)

12.6.5 Turkey - Market size and forecast 2025-2030

Chart on Turkey - Market size and forecast 2025-2030 ($ million)
Data Table on Turkey - Market size and forecast 2025-2030 ($ million)
Chart on Turkey - Year-over-year growth 2025-2030 (%)
Data Table on Turkey - Year-over-year growth 2025-2030 (%)

12.7 South America - Market size and forecast 2025-2030

Chart on South America - Market size and forecast 2025-2030 ($ million)
Data Table on South America - Market size and forecast 2025-2030 ($ million)
Chart on South America - Year-over-year growth 2025-2030 (%)
Data Table on South America - Year-over-year growth 2025-2030 (%)
Chart on Regional Comparison - South America
Data Table on Regional Comparison - South America

12.7.1 Brazil - Market size and forecast 2025-2030

Chart on Brazil - Market size and forecast 2025-2030 ($ million)
Data Table on Brazil - Market size and forecast 2025-2030 ($ million)
Chart on Brazil - Year-over-year growth 2025-2030 (%)
Data Table on Brazil - Year-over-year growth 2025-2030 (%)

12.7.2 Argentina - Market size and forecast 2025-2030

Chart on Argentina - Market size and forecast 2025-2030 ($ million)
Data Table on Argentina - Market size and forecast 2025-2030 ($ million)
Chart on Argentina - Year-over-year growth 2025-2030 (%)
Data Table on Argentina - Year-over-year growth 2025-2030 (%)

12.7.3 Colombia - Market size and forecast 2025-2030

Chart on Colombia - Market size and forecast 2025-2030 ($ million)
Data Table on Colombia - Market size and forecast 2025-2030 ($ million)
Chart on Colombia - Year-over-year growth 2025-2030 (%)
Data Table on Colombia - Year-over-year growth 2025-2030 (%)

12.8 Market opportunity by geography

Market opportunity by geography ($ million)
Data Tables on Market opportunity by geography ($ million)

13. Drivers, Challenges, and Opportunity

13.1 Market drivers

Global expansion of non-English digital economies
Sovereign AI policy investment globally
Enterprise demand for multilingual customer experience parity

13.2 Market challenges

Unequal performance across language tiers
Data privacy and cross-border data governance complexity
Hallucination and cultural accuracy in non-primary languages

13.3 Impact of drivers and challenges

Impact of drivers and challenges in 2025 and 2030

13.4 Market opportunities

Proliferation of edge and offline multilingual models
Convergence of multimodal and multilingual capabilities
Open-weight multilingual models as enterprise deployment standard

14. Competitive Landscape

14.1 Overview

14.2

Overview on criticality of inputs and factors of differentiation

14.3 Landscape disruption

Overview on factors of disruption

14.4 Industry risks

Impact of key risks on business

15. Competitive Analysis

15.1 Companies profiled

Companies covered

15.2 Company ranking index

15.3 Market positioning of companies

Matrix on companies position and classification

15.4 Alibaba Group Holding Ltd.

Alibaba Group Holding Ltd. - Overview
Alibaba Group Holding Ltd. - Business segments
Alibaba Group Holding Ltd. - Key news
Alibaba Group Holding Ltd. - Key offerings
Alibaba Group Holding Ltd. - Segment focus
SWOT

15.5 Amazon.com Inc.

Amazon.com Inc. - Overview
Amazon.com Inc. - Business segments
Amazon.com Inc. - Key news
Amazon.com Inc. - Key offerings
Amazon.com Inc. - Segment focus
SWOT

15.6 Anthropic

Anthropic - Overview
Anthropic - Product / Service
Anthropic - Key offerings
SWOT

15.7 Baidu Inc.

Baidu Inc. - Overview
Baidu Inc. - Business segments
Baidu Inc. - Key news
Baidu Inc. - Key offerings
Baidu Inc. - Segment focus
SWOT

15.8 Google LLC

Google LLC - Overview
Google LLC - Product / Service
Google LLC - Key offerings
SWOT

15.9 Huawei Technologies Co. Ltd.

Huawei Technologies Co. Ltd. - Overview
Huawei Technologies Co. Ltd. - Product / Service
Huawei Technologies Co. Ltd. - Key offerings
SWOT

15.10 IBM Corp.

IBM Corp. - Overview
IBM Corp. - Business segments
IBM Corp. - Key news
IBM Corp. - Key offerings
IBM Corp. - Segment focus
SWOT

15.11 Meta Platforms Inc.

Meta Platforms Inc. - Overview
Meta Platforms Inc. - Business segments
Meta Platforms Inc. - Key offerings
Meta Platforms Inc. - Segment focus
SWOT

15.12 Microsoft Corp.

Microsoft Corp. - Overview
Microsoft Corp. - Business segments
Microsoft Corp. - Key news
Microsoft Corp. - Key offerings
Microsoft Corp. - Segment focus
SWOT

15.13 NAVER CORP.

NAVER CORP. - Overview
NAVER CORP. - Product / Service
NAVER CORP. - Key offerings
SWOT

15.14 NVIDIA Corp.

NVIDIA Corp. - Overview
NVIDIA Corp. - Business segments
NVIDIA Corp. - Key news
NVIDIA Corp. - Key offerings
NVIDIA Corp. - Segment focus
SWOT

15.15 OpenAI

OpenAI - Overview
OpenAI - Product / Service
OpenAI - Key offerings
SWOT

15.16 SenseTime Group Inc.

SenseTime Group Inc. - Overview
SenseTime Group Inc. - Product / Service
SenseTime Group Inc. - Key offerings
SWOT

15.17 Tencent Holdings Ltd.

Tencent Holdings Ltd. - Overview
Tencent Holdings Ltd. - Business segments
Tencent Holdings Ltd. - Key offerings
Tencent Holdings Ltd. - Segment focus
SWOT

15.18 xAI Corp

xAI Corp - Overview
xAI Corp - Product / Service
xAI Corp - Key offerings
SWOT

16. Appendix

16.1 Scope of the report

Market definition
Objectives
Notes and caveats

16.2 Inclusions and exclusions checklist

Inclusions checklist
Exclusions checklist

16.3 Currency conversion rates for US$

16.4 Research methodology

16.5 Data procurement

Information sources

16.6 Data validation

16.7 Validation techniques employed for market sizing

16.8 Data synthesis

16.9 360 degree market analysis

16.10 List of abbreviations

Research Methodology

Technavio presents a detailed picture of the market by way of study, synthesis, and summation of data from multiple sources. The analysts have presented the various facets of the market with a particular focus on identifying the key industry influencers. The data thus presented is comprehensive, reliable, and the result of extensive research, both primary and secondary.

INFORMATION SOURCES

Primary sources

  • Manufacturers and suppliers
  • Channel partners
  • Industry experts
  • Strategic decision makers

Secondary sources

  • Industry journals and periodicals
  • Government data
  • Financial reports of key industry players
  • Historical data
  • Press releases

DATA ANALYSIS

Data Synthesis

  • Collation of data
  • Estimation of key figures
  • Analysis of derived insights

Data Validation

  • Triangulation with data models
  • Reference against proprietary databases
  • Corroboration with industry experts

REPORT WRITING

Qualitative

  • Market drivers
  • Market challenges
  • Market trends
  • Five forces analysis

Quantitative

  • Market size and forecast
  • Market segmentation
  • Geographical insights
  • Competitive landscape

Interested in this report?

Get your sample now to see our research methodology and insights!

Download Now

Frequently Asked Questions

Multilingual LLM market growth will increase by USD 16847.8 million during 2026-2030.

The Multilingual LLM market is expected to grow at a CAGR of 35.9% during 2026-2030.

Multilingual LLM market is segmented by Deployment (On-premises, Cloud) Application (Content generation and curation, Chatbots and virtual assistants, Language translation and localization) End-user (Retail and e-commerce, Finance, Healthcare)

Alibaba Group Holding Ltd., Amazon.com Inc., Anthropic, Baidu Inc., Cohere, DeepSeek, Google LLC, Huawei Technologies Co. Ltd., Hugging Face Inc., IBM Corp., InData Labs, Meta Platforms Inc., Microsoft Corp., Mistral AI, NAVER CORP., NVIDIA Corp., OpenAI, SenseTime Group Inc., Tencent Holdings Ltd., xAI Corp are a few of the key vendors in the Multilingual LLM market.

North America will register the highest growth rate of 32.2% among the other regions. Therefore, the Multilingual LLM market in North America is expected to garner significant business opportunities for the vendors during the forecast period.

US, Canada, Mexico, Germany, UK, France, Italy, Spain, The Netherlands, China, India, Japan, South Korea, Australia, Indonesia, UAE, Saudi Arabia, South Africa, Israel, Turkey, Brazil, Argentina, Colombia

  • Global expansion of non-English digital economies is the driving factor this market.

The Multilingual LLM market vendors should focus on grabbing business opportunities from the Deployment segment as it accounted for the largest market share in the base year.
RIA - Research AI Assistant
Ask RIA