
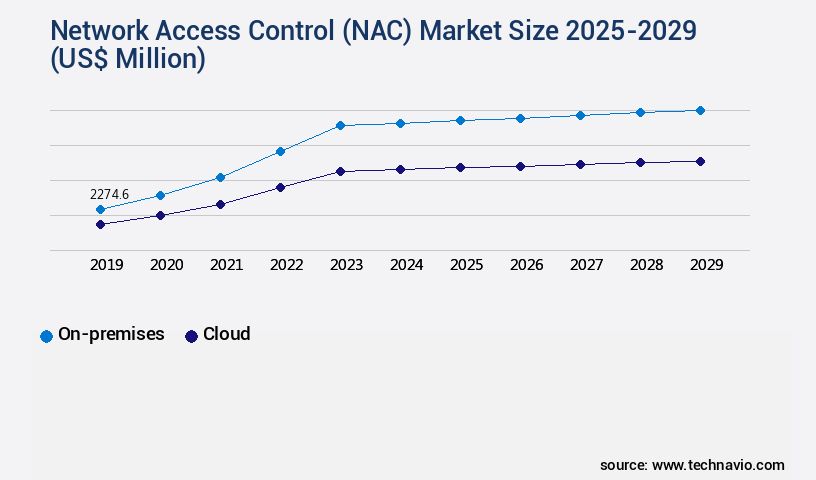
Network Access Control (NAC) Market Size 2025-2029
The network access control (nac) market size is forecast to increase by USD 81.75 billion, at a CAGR of 45.9% between 2024 and 2029.
Major Market Trends & Insights
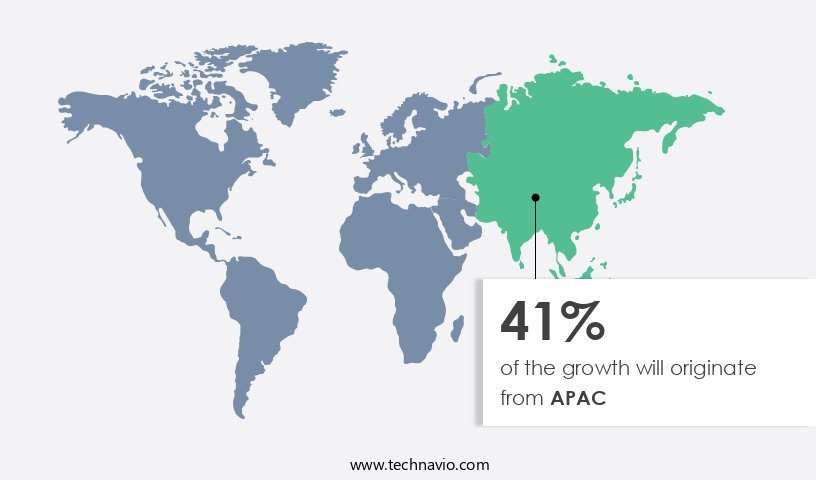
- APAC dominated the market and accounted for a 41% growth during the forecast period.
- By the Deployment - On-premises segment was valued at USD 2.27 billion in 2023
- By the Product - Hardware segment accounted for the largest market revenue share in 2023
Market Size & Forecast
- Market Opportunities: USD 2.00 billion
- Market Future Opportunities: USD USD 81.75 billion
- CAGR : 45.9%
- APAC: Largest market in 2023
Market Summary
- The market is experiencing significant evolution, with organizations increasingly recognizing the importance of securing their networks against unauthorized access and potential cyber threats. According to recent research, the global NAC market is projected to grow at a steady pace, with a focus on advanced solutions that offer granular policy control, real-time threat detection, and seamless user experience. Compared to traditional NAC solutions, modern offerings are more dynamic and adaptive, addressing the challenges of managing access across diverse devices, networks, and applications. For instance, cloud-based NAC solutions have gained traction due to their ease of deployment and scalability, enabling organizations to secure their networks from anywhere.
- Moreover, the integration of machine learning and artificial intelligence technologies in NAC solutions is driving innovation, allowing for more accurate threat identification and automated response. This shift towards advanced NAC solutions is expected to continue, as businesses seek to strengthen their cybersecurity posture and mitigate the risks associated with the increasing complexity of modern networks. Despite these advancements, challenges remain, including the need for seamless integration with existing infrastructure and ensuring user-friendliness to encourage widespread adoption. Nevertheless, the ongoing evolution of NAC solutions promises to deliver significant benefits, making network security a top priority for organizations across industries.
What will be the Size of the Network Access Control (NAC) Market during the forecast period?

Explore market size, adoption trends, and growth potential for network access control (nac) market Request Free Sample
- The market encompasses a range of solutions designed to enhance security by controlling access to networks based on predefined policies. Two significant aspects of this market are the growing importance of centralized management and the increasing integration of security analytics. According to recent estimates, the global NAC market size is projected to reach USD15.4 billion by 2025, exhibiting a compound annual growth rate (CAGR) of 12.3% during the forecast period. In contrast, the NAC agent market, which focuses on endpoint compliance, is expected to reach USD3.5 billion by 2026, growing at a CAGR of 11.5% during the same period.
- These figures underscore the increasing demand for advanced NAC capabilities, including user provisioning, identity federation, authentication protocols, and authorization mechanisms. As organizations continue to grapple with the complexities of network security, NAC solutions are becoming essential components of their security posture, offering real-time monitoring, risk management, and policy-based access control.
How is this Network Access Control (NAC) Industry segmented?
The network access control (nac) industry research report provides comprehensive data (region-wise segment analysis), with forecasts and estimates in "USD million" for the period 2025-2029, as well as historical data from 2019-2023 for the following segments.
- Deployment
- On-premises
- Cloud
- Product
- Hardware
- Software
- Services
- End-user
- BFSI
- Healthcare
- IT and telecom
- Government
- Others
- Organization Size
- Small & Medium-sized Enterprises (SMEs)
- Large Enterprises
- Geography
- North America
- US
- Canada
- Europe
- France
- Germany
- Italy
- UK
- Middle East and Africa
- Egypt
- KSA
- Oman
- UAE
- APAC
- China
- India
- Japan
- South America
- Argentina
- Brazil
- Rest of World (ROW)
- North America
By Deployment Insights
The on-premises segment is estimated to witness significant growth during the forecast period.
In the dynamic and ever-evolving the market, several key trends are shaping its landscape. Threat prevention and malware detection remain top priorities, driving the demand for advanced security policies and device posture assessments. Guest access management and RADIUS server integration are essential for network policy enforcement and role-based access control. Multi-factor authentication (MFA) and single sign-on (SSO) are increasingly adopted for enhanced user authentication. Network segmentation, compliance auditing, and secure remote access are crucial components of NAC solutions, ensuring regulatory compliance and robust security. Firewall integration, intrusion detection, and network monitoring offer additional layers of protection.
IP address management, audit logs, endpoint security, VPN access, and virtual LANs (VLANs) further strengthen network security. The market for NAC solutions is experiencing significant growth, with the cloud segment expanding at a rapid pace. In 2024, the cloud deployment of NAC accounted for 35% of the total market share. This growth can be attributed to the flexibility, scalability, and cost savings offered by cloud-based solutions. Moreover, the increasing adoption of bring-your-own-device (BYOD) policies in organizations is fueling the demand for cloud NAC. Furthermore, the market is expected to grow at a steady pace in the coming years, with a projected increase of 25% in terms of new implementations.
The ongoing digital transformation in various industries, including healthcare, finance, and education, is driving the market growth. In summary, the NAC market is witnessing continuous evolution, with a focus on advanced security features, flexible deployment options, and regulatory compliance. The market's growth is fueled by the increasing adoption of cloud solutions and the digital transformation trend across industries.
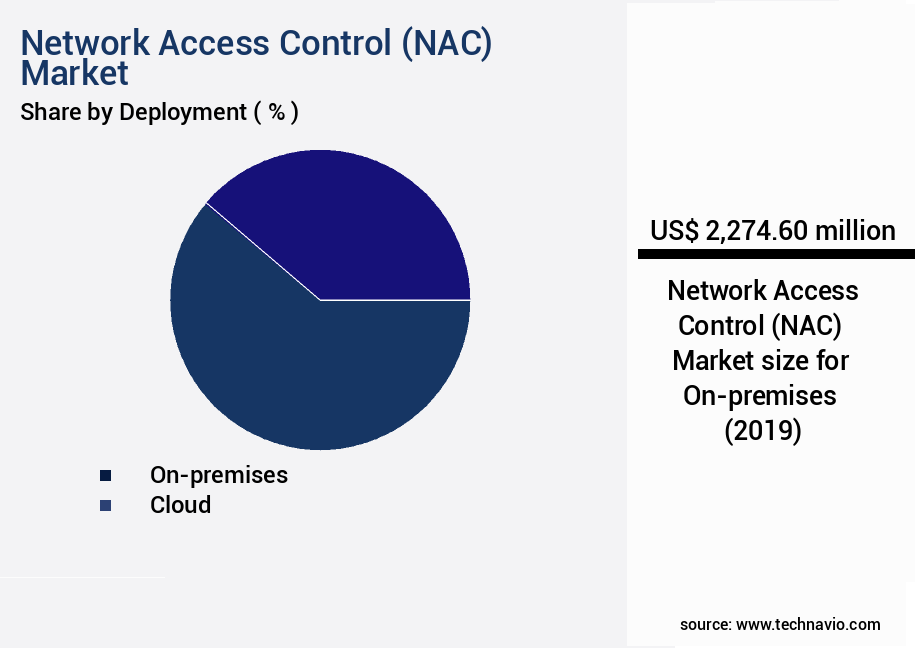
The On-premises segment was valued at USD 2.27 billion in 2019 and showed a gradual increase during the forecast period.
Regional Analysis
APAC is estimated to contribute 41% to the growth of the global market during the forecast period.Technavio’s analysts have elaborately explained the regional trends and drivers that shape the market during the forecast period.
See How Network Access Control (NAC) Market Demand is Rising in APAC Request Free Sample
The North American the market encompasses the US and Canada and is poised for substantial expansion during the forecasted period. Currently, the US holds the largest market share in North America, contributing significantly to the region's revenue. Major players offering cybersecurity solutions in the US, such as Auconet, Check Point Software Technologies Ltd, and Cisco Systems Inc., are driving the regional market growth. The increasing demand for robust cybersecurity solutions and the widespread adoption of bring-your-own-device (BYOD) policies and IoT-based devices are primary growth factors for the NAC market in North America. According to recent studies, the market is projected to expand by approximately 15% in the next three years.
Furthermore, the market is expected to grow at a similar pace during the forecast period, reaching a value of around 5 billion USD. Comparatively, the Canadian market for NAC solutions is anticipated to experience a growth rate of roughly 12% during the same period. This growth can be attributed to the increasing awareness of cybersecurity threats and the government's initiatives to enhance network security. Despite the smaller market size, Canada's growth rate is expected to remain consistent with the overall market trend. In conclusion, the North American NAC market is experiencing steady growth due to the increasing demand for advanced cybersecurity solutions and the widespread adoption of BYOD policies and IoT devices.
The US continues to dominate the regional market, with major players like Auconet, Check Point Software Technologies Ltd, and Cisco Systems Inc., leading the charge. The Canadian market is also expected to grow at a significant pace, driven by government initiatives and increasing awareness of cybersecurity threats.
Market Dynamics
Our researchers analyzed the data with 2024 as the base year, along with the key drivers, trends, and challenges. A holistic analysis of drivers will help companies refine their marketing strategies to gain a competitive advantage.
Enhancing US Businesses' Network Security with Network Access Control (NAC) Solutions Network Access Control (NAC) is a vital component of US businesses' cybersecurity arsenal, providing performance improvements, efficiency gains, and robust compliance features. NAC solutions enable 802.1x authentication radius integration, ensuring secure network access for authorized devices only. Device posture assessment for endpoint security is another essential aspect of NAC, allowing businesses to identify and remediate vulnerabilities in real-time. NAC agentless deployment strategies offer flexibility and ease of implementation, while network segmentation using VLANs and ACLs ensures granular control over access. Secure remote access VPN integration with NAC offers a seamless user experience, maintaining network security even for remote workers. Centralized management of network access policies streamlines administration and enhances consistency. Policy enforcement point and policy decision point interaction optimizes security decisions, reducing potential errors. Compliance auditing and reporting for NAC systems provide valuable insights, ensuring regulatory requirements are met. Real-time threat detection and response with NAC safeguards against emerging cyber threats, while integration with SIEM systems offers enhanced threat intelligence. User authentication and authorization using multi-factor authentication (MFA) adds an extra layer of security. Wireless security enhancements with NAC protect against unauthorized access and rogue access points. Risk management and mitigation using NAC enables proactive security measures. Network visibility and monitoring with NAC offers valuable insights into network activity. Data loss prevention strategies using NAC protect sensitive information, while improving network security posture. DHCP server integration for dynamic IP allocation simplifies network management, and malware detection and prevention in NAC deployment safeguards against malicious software. Incident response and remediation with NAC ensures swift action against security breaches, and network performance monitoring with NAC maintains optimal network performance. Embrace innovation and strengthen your business's cybersecurity posture with NAC solutions.
What are the key market drivers leading to the rise in the adoption of Network Access Control (NAC) Industry?
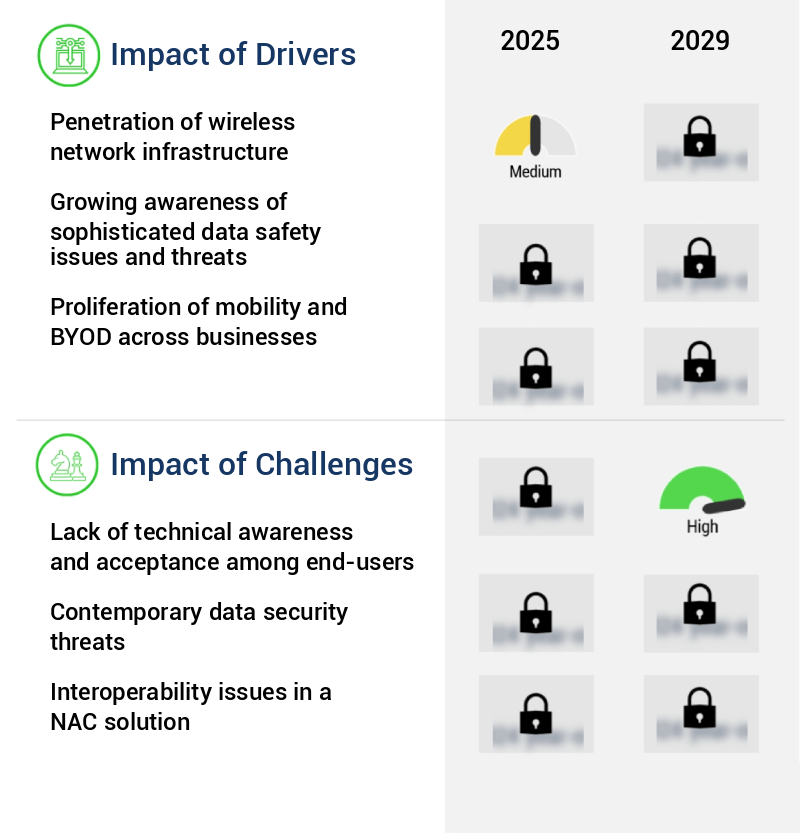
- The penetration of wireless network infrastructure serves as the primary catalyst for market growth.
- The market is experiencing significant expansion due to the widespread adoption of wireless technologies and the increasing use of Internet and broadband connectivity across various industries. The proliferation of 4G/5G and wireless broadband infrastructure has made wireless Internet more accessible and affordable, leading to its rapid dissemination and amplifying software consumerization. This trend is driving the growth of the NAC market as enterprises seek to secure their networks against potential security threats. The NAC market's expansion is also influenced by the growing number of Internet of Things (IoT) devices being integrated into business operations. With the increasing use of IoT devices, the need to ensure secure network access has become more critical than ever.
- NAC solutions offer a centralized approach to managing network access, enabling organizations to enforce security policies and control access to their networks. Moreover, the adoption of cloud computing and the shift towards remote work have further accelerated the growth of the NAC market. With the increasing use of cloud services and remote work arrangements, organizations need to ensure that their networks are secure and that access to sensitive data is controlled. NAC solutions offer a cost-effective and efficient way to address these challenges, enabling organizations to secure their networks and protect their data from unauthorized access. The NAC market is a dynamic and evolving space, with new technologies and innovations continually emerging.
- For instance, the integration of artificial intelligence and machine learning into NAC solutions is enabling more advanced threat detection and response capabilities. Additionally, the increasing use of blockchain technology in NAC solutions is enhancing security and data privacy. In terms of market size, the global NAC market is expected to reach significant growth in the coming years, with the market value projected to increase at a steady pace. This growth can be attributed to the increasing adoption of NAC solutions across various industries, including healthcare, finance, education, and retail, among others. The market's growth is also driven by the increasing awareness of the importance of network security and the need to protect against cyber threats.
- In conclusion, The market is experiencing significant growth due to the increasing use of wireless technologies, IoT devices, cloud computing, and remote work arrangements. The market's expansion is driven by the need to secure networks and protect against cyber threats, with new technologies and innovations continually emerging to address the evolving security landscape. The market's size is projected to increase steadily in the coming years, reflecting the growing importance of network security and the increasing adoption of NAC solutions across various industries.
What are the market trends shaping the Network Access Control (NAC) Industry?
- The commoditization of Network Access Control (NAC) solutions is an emerging market trend. This trend signifies the increasing standardization and decreasing differentiation of NAC offerings, leading to price competition and cost reduction.
- The market is experiencing continuous growth and transformation, driven by the increasing importance of network security in the era of hyper-connectivity and heightened network threats. NAC solutions, which traditionally focused on controlling access to networks based on specific security policies, are now evolving to offer more comprehensive network management capabilities. The integration of NAC with other network solutions is becoming a trend, with companies bundling NAC as part of an end-to-end network management suite. This shift is expected to moderate the commoditization of NAC in the coming years, as the market adapts to changing consumer demands and technological advancements.
- Despite the evolving nature of the market, the core function of NAC - securing network access - remains a critical concern for businesses across various sectors. The global NAC market is anticipated to expand significantly, with an increasing number of organizations recognizing the importance of securing their networks against unauthorized access and potential cyber threats. Comparatively, the Asia Pacific region is projected to exhibit the highest growth rate in the NAC market, driven by the rapid digitalization and increasing internet penetration in countries like China and India. This trend is expected to continue, as organizations in the region invest in advanced network security solutions to protect their digital assets and maintain regulatory compliance.
- In conclusion, the NAC market is undergoing significant changes, with a focus on integration and bundling with other network solutions. This evolution is expected to alter the scope of NAC and its role in network security, making it a crucial component of comprehensive network management strategies for businesses worldwide.
What challenges does the Network Access Control (NAC) Industry face during its growth?
- The absence of technical proficiency and acceptance among end-users represents a significant obstacle to industry expansion.
- The market faces a significant challenge due to the lack of technological awareness and misconceptions regarding implementation and management costs. Despite its potential benefits, the adoption and implementation rate of NAC solutions remain low, particularly in emerging economies. However, as technological advancements continue to unfold, this trend is expected to shift positively over the forecast period. NAC solutions offer robust security measures by controlling and managing access to networks based on specific security policies. They help mitigate risks associated with unsecured devices and unauthorized access, ensuring only authorized users and devices can connect to the network.
- This is crucial in today's digital landscape, where data security and privacy are paramount. Despite these advantages, the high initial investment and ongoing maintenance costs often deter businesses from implementing NAC solutions. However, the long-term benefits, such as improved network security, enhanced compliance, and reduced helpdesk calls, can far outweigh the costs. Moreover, the evolving threat landscape and increasing regulatory requirements necessitate the adoption of advanced security solutions like NAC. In comparison, the global spending on network security is projected to reach USD 170.4 billion by 2022, growing at a steady pace. This growth is driven by the increasing adoption of cloud services, the proliferation of IoT devices, and the rise in cyber attacks.
- As businesses prioritize network security, the demand for NAC solutions is expected to increase, offering significant growth opportunities for market participants. In conclusion, the global NAC market presents both challenges and opportunities. The lack of awareness and misconceptions regarding costs are barriers to entry, but the growing need for advanced network security solutions and the increasing spending on network security are catalysts for growth. As businesses become more aware of the benefits of NAC, the market is expected to expand and evolve, offering significant opportunities for innovation and growth.
Exclusive Customer Landscape
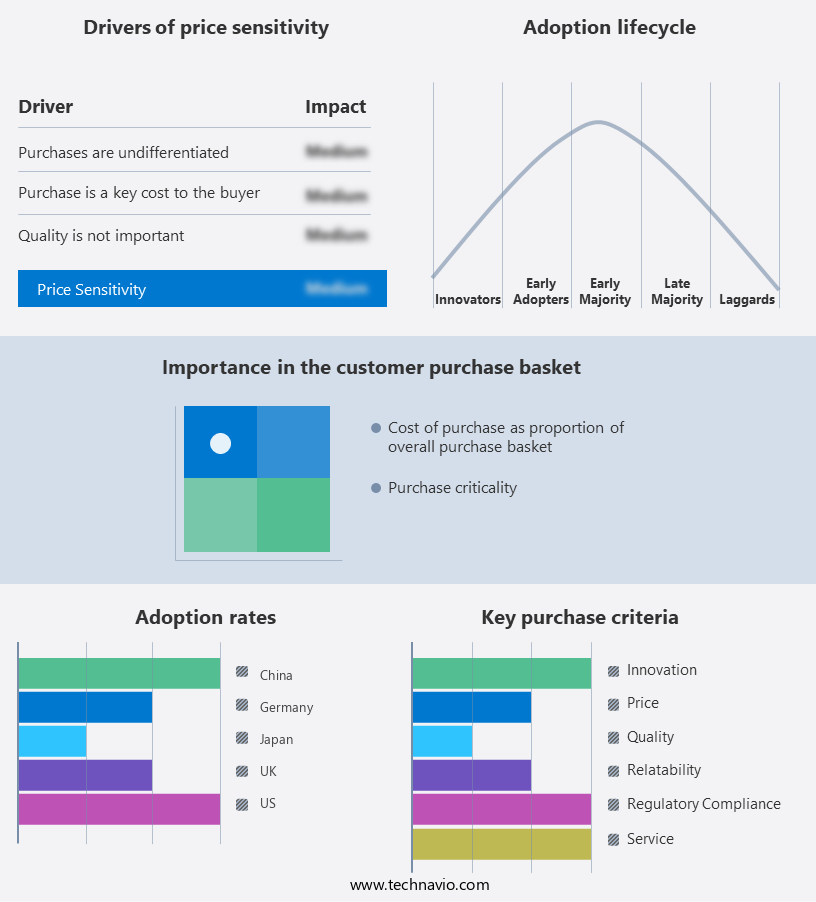
The network access control (nac) market forecasting report includes the adoption lifecycle of the market, covering from the innovator’s stage to the laggard’s stage. It focuses on adoption rates in different regions based on penetration. Furthermore, the network access control (nac) market report also includes key purchase criteria and drivers of price sensitivity to help companies evaluate and develop their market growth analysis strategies.
Customer Landscape of Network Access Control (NAC) Industry
Key Companies & Market Insights
Companies are implementing various strategies, such as strategic alliances, network access control (nac) market forecast, partnerships, mergers and acquisitions, geographical expansion, and product/service launches, to enhance their presence in the industry.
Auconet Inc. - This company delivers network access control via its business infrastructure solution, enabling organizations to manage their entire infrastructure from a central, graphical user interface with granular control.
The industry research and growth report includes detailed analyses of the competitive landscape of the market and information about key companies, including:
- Auconet Inc.
- Belden Inc.
- Beyon Cyber
- Check Point Software Technologies Ltd.
- Cisco Systems Inc.
- Extreme Networks Inc.
- Forescout Technologies Inc.
- Fortinet Inc.
- Hewlett Packard Enterprise Co.
- InfoExpress
- Ivanti Software Inc.
- Juniper Networks Inc.
- Nevis Networks Pvt. Ltd.
- Nomios USA Inc.
- OPSWAT Inc.
- Palo Alto Networks Inc.
- Portnox Security LLC
- SCAN IT Sp. z o. o.
- Singapore Telecommunications Ltd.
- Sophos Ltd.
Qualitative and quantitative analysis of companies has been conducted to help clients understand the wider business environment as well as the strengths and weaknesses of key industry players. Data is qualitatively analyzed to categorize companies as pure play, category-focused, industry-focused, and diversified; it is quantitatively analyzed to categorize companies as dominant, leading, strong, tentative, and weak.
Recent Development and News in Network Access Control (NAC) Market
- In January 2024, Cisco Systems, a leading network technology company, announced the launch of its newest NAC solution, Cisco ISE 3.0, which introduced advanced AI capabilities to automatically identify and secure IoT devices on enterprise networks (Cisco Press Release).
- In March 2024, Juniper Networks and Fortinet, two major NAC companies, announced a strategic partnership to integrate their solutions and offer a unified security approach for their customers (Juniper Networks Press Release).
- In May 2024, Aruba, a Hewlett Packard Enterprise company, secured a significant investment of USD100 million in its NAC business from Goldman Sachs, further strengthening its position in the market (Bloomberg).
- In April 2025, the European Union passed the new Network and Information Systems Security Directive (NIS 2), mandating network access control for critical infrastructure organizations (European Parliament). This regulatory approval is expected to boost the demand for NAC solutions in Europe.
Research Analyst Overview
- The market encompasses a range of technologies designed to secure and manage access to computer networks. A key focus of NAC solutions is wireless security, ensuring secure connectivity for devices joining wireless networks. User authentication is a fundamental aspect of NAC, with 802.1x authentication being a widely adopted standard for securing wired and wireless network access. Virtual LANs (VLANs) play a crucial role in NAC by segmenting networks and isolating traffic, enhancing security and performance. Dynamic Host Configuration Protocol (DHCP) servers are integrated into NAC systems to manage IP address assignments and maintain network security. Port security is another essential component of NAC, controlling access to specific ports on network devices.
- Performance metrics are closely monitored to ensure NAC solutions maintain optimal network performance. Identity management, including multi-factor authentication (MFA) and single sign-on (SSO), is increasingly integrated into NAC solutions to streamline user access and improve security. Network policy enforcement, role-based access control, and compliance auditing are other critical features of NAC systems. The NAC market continues to evolve, with ongoing developments in threat prevention, malware detection, device posture assessment, guest access management, and firewall integration. According to recent market research, the NAC market is projected to grow by over 15% annually, reflecting the increasing demand for robust network security solutions.
- Network segmentation, compliance regulations, secure remote access, intrusion detection, network monitoring, and endpoint security are additional areas where NAC solutions offer significant value. These technologies work together to provide comprehensive network security and ensure network access is granted only to authorized users and devices.
Dive into Technavio’s robust research methodology, blending expert interviews, extensive data synthesis, and validated models for unparalleled Network Access Control (NAC) Market insights. See full methodology.
|
Market Scope |
|
|
Report Coverage |
Details |
|
Page number |
222 |
|
Base year |
2024 |
|
Historic period |
2019-2023 |
|
Forecast period |
2025-2029 |
|
Growth momentum & CAGR |
Accelerate at a CAGR of 45.9% |
|
Market growth 2025-2029 |
USD 81749.7 million |
|
Market structure |
Fragmented |
|
YoY growth 2024-2025(%) |
32.8 |
|
Key countries |
US, Canada, Germany, UK, Italy, France, China, India, Japan, Brazil, Egypt, UAE, Oman, Argentina, KSA, UAE, Brazil, and Rest of World (ROW) |
|
Competitive landscape |
Leading Companies, Market Positioning of Companies, Competitive Strategies, and Industry Risks |
What are the Key Data Covered in this Network Access Control (NAC) Market Research and Growth Report?
- CAGR of the Network Access Control (NAC) industry during the forecast period
- Detailed information on factors that will drive the growth and forecasting between 2025 and 2029
- Precise estimation of the size of the market and its contribution of the industry in focus to the parent market
- Accurate predictions about upcoming growth and trends and changes in consumer behaviour
- Growth of the market across North America, Europe, APAC, Middle East and Africa, and South America
- Thorough analysis of the market’s competitive landscape and detailed information about companies
- Comprehensive analysis of factors that will challenge the network access control (nac) market growth of industry companies
We can help! Our analysts can customize this network access control (nac) market research report to meet your requirements.
 RIA -
RIA - 
