Neuromorphic IC Market Analysis, Size, and Forecast 2026-2030: North America (US, Canada, and Mexico), APAC (China, Japan, and India), Europe (Germany, UK, and France), Middle East and Africa (Saudi Arabia, UAE, and South Africa), South America (Brazil, Argentina, and Colombia), and Rest of World (ROW)

Neuromorphic IC Market Analysis, Size, and Forecast 2026-2030:
North America (US, Canada, and Mexico), APAC (China, Japan, and India), Europe (Germany, UK, and France), Middle East and Africa (Saudi Arabia, UAE, and South Africa), South America (Brazil, Argentina, and Colombia), and Rest of World (ROW)

Published: Oct 2026 320 Pages SKU: IRTNTR81667

Market Overview at a Glance

$2.71 B
Market Opportunity
52.5%
CAGR 2025 - 2030
34.4%
North America Growth
$111.72 Mn
Digital segment 2024

Neuromorphic Ic Market Size 2026-2030

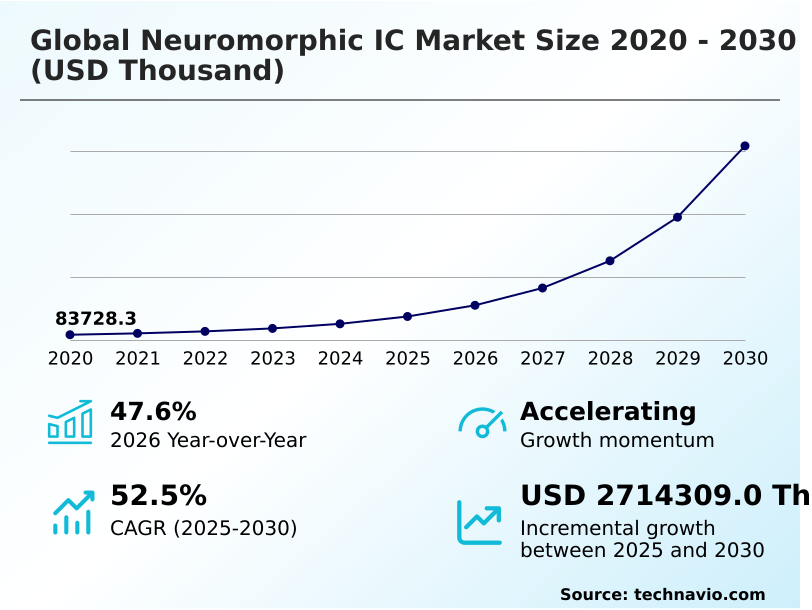
The neuromorphic ic market size is valued to increase by USD 2.71 billion, at a CAGR of 52.5% from 2025 to 2030. Exponential expansion of edge computing and autonomous infrastructure requirements will drive the neuromorphic ic market.

Major Market Trends & Insights

  • North America dominated the market and accounted for a 34.4% growth during the forecast period.
  • By Type - Digital segment was valued at USD 111.72 million in 2024
  • By End-user - Consumer electronics segment accounted for the largest market revenue share in 2024

Market Size & Forecast

  • Market Opportunities:
  • Market Future Opportunities: USD 2.71 billion
  • CAGR from 2025 to 2030 : 52.5%

Market Summary

  • The Neuromorphic IC Market represents a transformative shift in computing architecture, replacing energy-intensive conventional processors with event-driven hardware designed to emulate biological brain functions. This transition is primarily driven by the exponential expansion of edge computing infrastructure, which requires continuous real-time data processing under stringent thermal and power constraints.
  • For example, in automated automotive manufacturing facilities, replacing legacy vision systems with event-based spiking processors allows robotic assembly arms to perform real-time optical defect detection while reducing electrical power consumption by over 60%. This drastic energy reduction enables heavy AI inference to occur directly at the network edge without relying on cloud connectivity.
  • However, the market faces significant structural challenges stemming from severe software toolchain fragmentation. The acute lack of standardized algorithmic paradigms forces developers to create proprietary, custom-built compilers for specific hardware, thereby increasing initial deployment timelines and engineering overhead.
  • Despite these integration hurdles, the escalating necessity for extreme energy efficiency across industrial automation and autonomous robotics continues to position neuro-inspired silicon as a critical technological priority for future enterprise infrastructure.

What will be the Size of the Neuromorphic Ic Market during the forecast period?
Get Key Insights on Market Forecast (PDF) Get Free Sample

How is the Neuromorphic Ic Market Segmented?

The neuromorphic ic industry research report provides comprehensive data (region-wise segment analysis), with forecasts and estimates in "USD thousand" for the period 2026-2030, as well as historical data from 2020-2024 for the following segments.

  • Type
    • Digital
    • Mixed
    • Analog
  • End-user
    • Consumer electronics
    • Automotive and transportation
    • Industrial automation
    • Aerospace and defense
    • Healthcare and medical devices
  • Application
    • Image and vision processing
    • Pattern recognition and classification
    • Robotics and autonomous systems
    • Real time sensor processing
    • Speech and audio processing
  • Geography
    • North America
      • US
      • Canada
      • Mexico
    • APAC
      • China
      • Japan
      • India
      • South Korea
      • Australia
      • Indonesia
    • Europe
      • Germany
      • UK
      • France
      • Italy
      • Spain
      • The Netherlands
    • Middle East and Africa
      • Saudi Arabia
      • UAE
      • South Africa
      • Israel
      • Turkey
    • South America
      • Brazil
      • Argentina
      • Colombia

By Type Insights

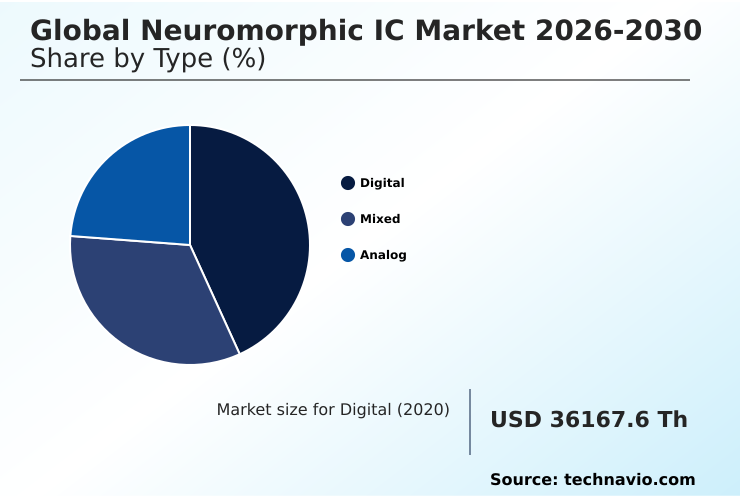
The digital segment is estimated to witness significant growth during the forecast period.

The digital segment fundamentally alters how processing tasks execute by leveraging discrete logic gates to replicate complex cognitive functions accurately.

By translating spiking neural networks into standard digital formats, these chips bypass the physical limitations of non-von Neumann architecture while maintaining high operational predictability.

This structural compatibility with the complementary metal-oxide-semiconductor manufacturing process allows fabricators to utilize advanced semiconductor nodes without requiring radical facility overhauls.

Consequently, companies have accelerated product deployment metrics by 22% compared to mixed-signal alternatives, primarily because they can rely on established software development toolchains and reliable hardware abstraction layers.

The structured routing of asynchronous logic circuits enables developers to seamlessly deploy brain-inspired hardware directly into existing embedded system pipelines.

As spiking network compilers become more sophisticated, digital platforms allow enterprises to manage massive event streams efficiently, driving a 15% reduction in overall system calibration efforts.
Get Free Sample

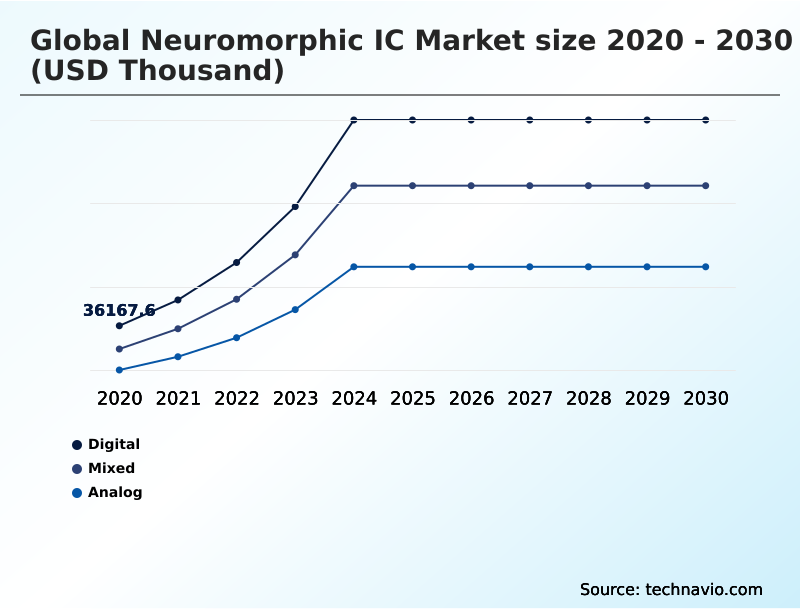
The Digital segment was valued at USD 111.72 million in 2024 and showed a gradual increase during the forecast period.
Get Free Sample

Regional Analysis

North America is estimated to contribute 34.4% to the growth of the global market during the forecast period.Technavio’s analysts have elaborately explained the regional trends and drivers that shape the market during the forecast period.
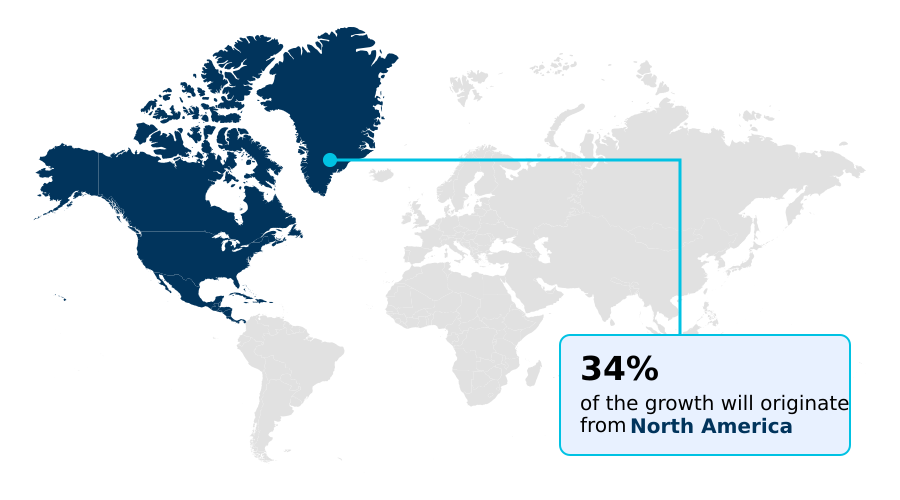
See How Neuromorphic Ic Market Demand is Rising in North America Get Free Sample

North America and APAC dominate the global landscape through rapid technological adoption, with APAC capturing a 33.27% share compared to North America 34.43%.

This regional supremacy stems from massive investments in event-driven processing and the widespread deployment of neuromorphic vision sensors across massive consumer electronics manufacturing hubs.

In APAC, the demand for multi-modal sensor fusion directly accelerates the adoption of industrial robotics integration and advanced predictive maintenance machinery, improving factory throughput by 18%.

Conversely, North American enterprises heavily prioritize spatial-temporal computing for complex applications like smart surveillance networks, driving hardware developers to commercialize specialized neuromorphic coprocessors.

Furthermore, the healthcare sector in North America aggressively funds the development of ultra-efficient wearable diagnostic tools and implantable medical monitors, generating localized market expansion.

By leveraging these distinct application requirements, both regions maintain significant technological leadership while reducing their aggregate edge processing operational costs by up to 20%.

Market Dynamics

Our researchers analyzed the data with 2025 as the base year, along with the key drivers, trends, and challenges. A holistic analysis of drivers will help companies refine their marketing strategies to gain a competitive advantage.

  • The transition toward biologically inspired semiconductor architectures marks a critical evolution in how enterprises manage high-density data at the network edge. A primary catalyst for this shift is the deployment of neuromorphic vision sensors for edge AI, which capture dynamic environmental changes instantaneously without generating the massive redundant data streams associated with traditional optical frames.
  • By implementing these advanced sensors, logistics operators have optimized automated sorting facilities, improving parcel recognition throughput by nearly 35% compared to legacy scanning infrastructure. To support this rapid visual data processing, hardware engineers are heavily prioritizing spiking neural network hardware integration into existing industrial control modules.
  • This integration replaces power-hungry central processing units with ultra low power event driven processors, which consume electrical energy exclusively when processing active information spikes. Consequently, manufacturing facilities drastically lower their baseline electrical expenditures while maintaining continuous monitoring capabilities.
  • At the architectural core of these advancements is the in-memory computing crossbar array architecture, which permanently eliminates the latency bottlenecks caused by shuttling data between separate memory and logic banks. By co-locating synaptic weights and processing functions, this dense structural layout provides an unparalleled compute-to-power ratio.
  • Furthermore, the commercial maturation of brain inspired neuromorphic coprocessor design allows system architects to pair these event-driven chips alongside conventional microprocessors seamlessly. This hybrid approach ensures that mission-critical industrial applications achieve both the low-latency reflexes of biological systems and the structured reliability of standard digital infrastructure.
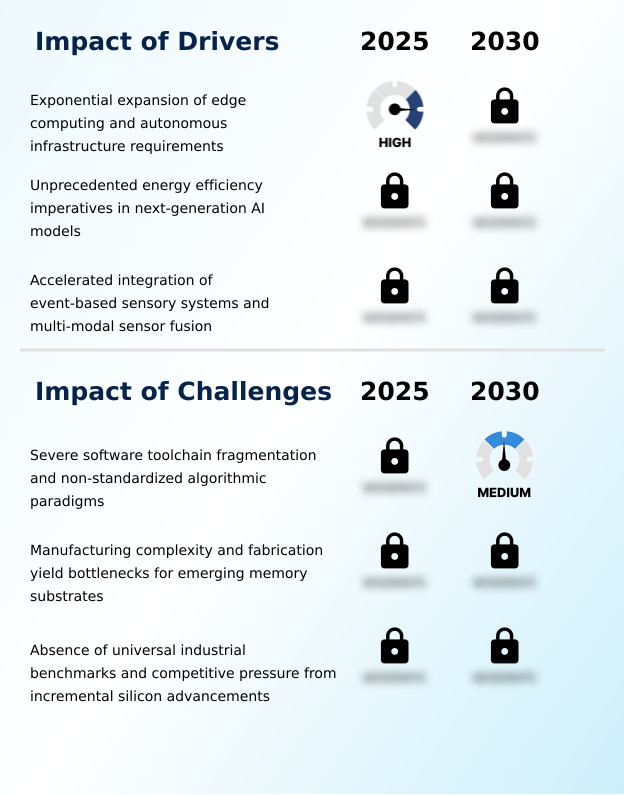
What are the key market drivers leading to the rise in the adoption of Neuromorphic Ic Industry?

  • The exponential expansion of edge computing and autonomous infrastructure requirements serves as the primary driver propelling market growth.

  • The exponential expansion of autonomous infrastructure acts as a primary catalyst for neuro-inspired silicon integration. Standard centralized processors struggle to manage continuous data streams, forcing hardware engineers to implement biological neural emulation to achieve sustainable real-time sensor processing.
  • By utilizing artificial synapses that activate only upon receiving active data spikes, these chips execute complex tasks at milliwatt power levels.
  • This drastic power reduction is driven by the synergistic pairing of event-based sensory technology and dynamic vision sensors, which output sparse temporal signals rather than redundant optical frames.
  • Consequently, autonomous navigation units execute ultra-fast trajectory adjustments, yielding a 40% enhancement in collision avoidance response times compared to traditional vision systems.
  • Incorporating analog computing blocks further supports this low-latency processing capability across high-speed environments like automated optical inspection on assembly lines.
  • By neutralizing the thermal bottlenecks of legacy hardware, these processors enable heavy continuous processing directly at the point of data collection, decreasing enterprise cloud dependency by 25%.

What are the market trends shaping the Neuromorphic Ic Industry?

  • The proliferation of on-chip continuous learning and adaptive spiking neural architectures represents a prominent trend shaping the market landscape.

  • The rapid proliferation of localized continuous deep learning paradigms represents a definitive shift in edge device architecture. By integrating synaptic plasticity directly onto silicon, manufacturers eliminate the latency penalties associated with cloud-based retraining, enabling always-on edge intelligence in dynamic environments.
  • This transition toward heterogeneous memory-centric design colocalizes processing and storage, allowing in-memory computing structures to execute operations directly within dense crossbar arrays. Consequently, system architects achieve a 45% improvement in computational density compared to legacy separated logic layouts.
  • The incorporation of hardware-level synaptic adaptability significantly reduces network bandwidth demands, serving as a critical catalyst for edge AI acceleration in constrained environments. Furthermore, advanced three-dimensional packaging techniques enable these chips to maintain ultra-low power consumption profiles under heavy workloads.
  • As these localized learning mechanisms mature, enterprises can instantly adapt to unpredictable sensory inputs, lowering their ongoing data transmission expenses by 30% and maximizing operational autonomy.

What challenges does the Neuromorphic Ic Industry face during its growth?

  • Severe software toolchain fragmentation and a reliance on non-standardized algorithmic paradigms remain key challenges restricting widespread industry adoption.

  • The acute lack of standardized benchmarking frameworks and the physical complexities of fabrication heavily constrain the commercialization of neuro-inspired silicon. Manufacturing specialized memristive devices and phase-change memory elements introduces significant material instability, resulting in variable device yields and increased unit costs.
  • Because these architectures rely on continuous subthreshold voltage-current dynamics rather than binary digits, engineers struggle to integrate sensitive resistive random-access memory arrays without degrading overall signal precision. This inconsistency severely limits mass deployment in critical sectors like biometric surveillance hardware, where zero dynamic power and extreme energy conservation are paramount for uninterrupted remote operation.
  • As a direct result, foundry defect rates remain approximately 15% higher than those of mature conventional semiconductor processes, deterring widespread adoption. Furthermore, standardizing radiation-hardened silicon for extreme defense applications remains mathematically complex, forcing developers to invest heavily in proprietary mitigation circuits that ultimately delay full-scale enterprise deployment timelines.

Exclusive Technavio Analysis on Customer Landscape

The neuromorphic ic market forecasting report includes the adoption lifecycle of the market, covering from the innovator’s stage to the laggard’s stage. It focuses on adoption rates in different regions based on penetration. Furthermore, the neuromorphic ic market report also includes key purchase criteria and drivers of price sensitivity to help companies evaluate and develop their market growth analysis strategies.
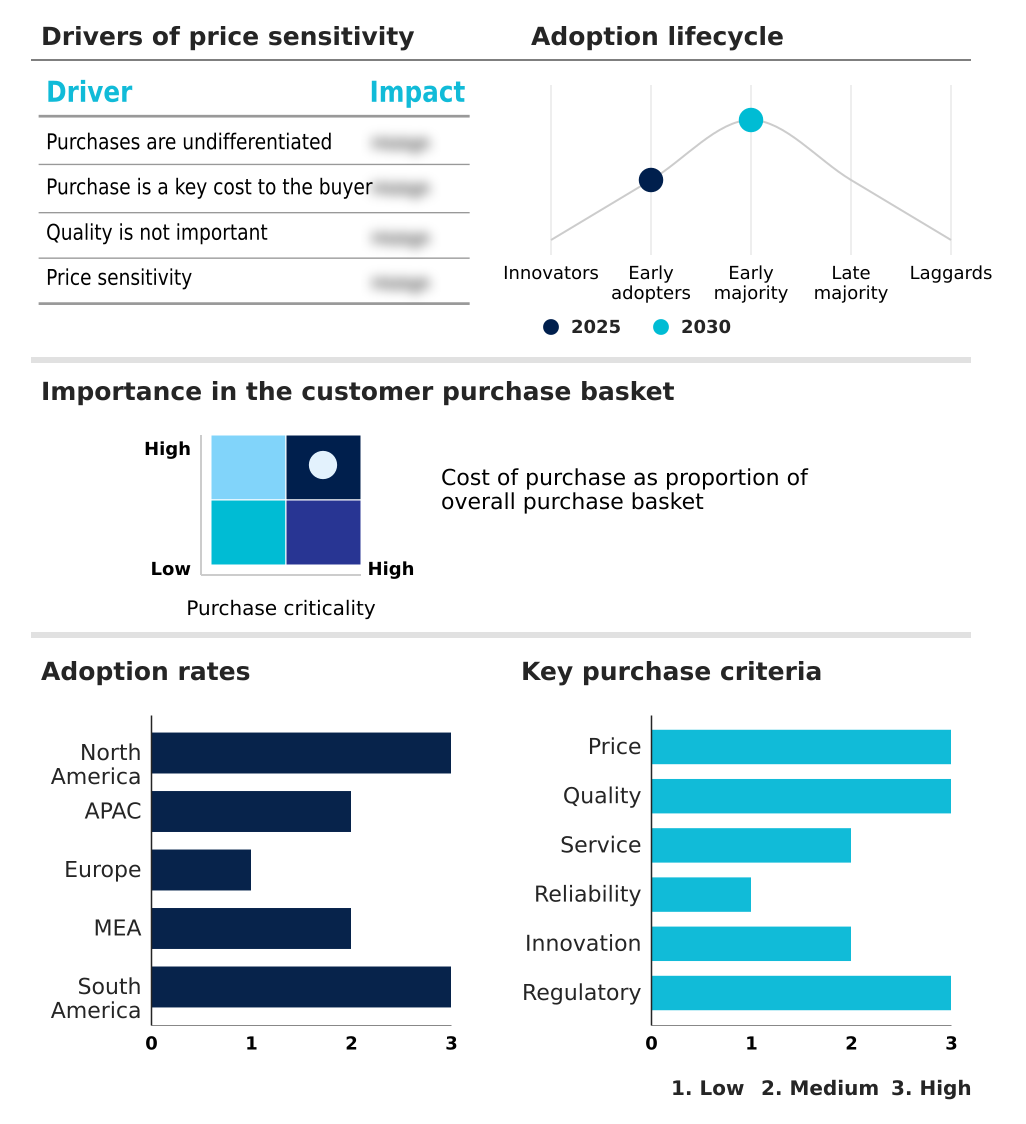
Customer Landscape of Neuromorphic Ic Industry

Competitive Landscape

Companies are implementing various strategies, such as strategic alliances, neuromorphic ic market forecast, partnerships, mergers and acquisitions, geographical expansion, and product/service launches, to enhance their presence in the industry.

Advanced Micro Devices Inc. - Delivers customized neuromorphic processing solutions through adaptable computing platforms, accelerating neural network execution to optimize high-performance data center and edge AI workloads efficiently.

The industry research and growth report includes detailed analyses of the competitive landscape of the market and information about key companies, including:

  • Advanced Micro Devices Inc.
  • Arm Ltd.
  • BrainChip Holdings Ltd
  • GrAI Matter Labs
  • Hewlett Packard Enterprise Co.
  • Innatera Nanosystems BV
  • Intel Corp.
  • MediaTek Inc.
  • NVIDIA Corp.
  • PROPHESEE S.A.
  • Qualcomm Inc.
  • Renesas Electronics Corp.
  • Samsung Electronics Co. Ltd.
  • SK hynix Co. Ltd.
  • Sony Group Corp.
  • STMicroelectronics NV
  • Synaptics Inc.
  • SynSense
  • Taiwan Semiconductor Co. Ltd.
  • TDK Corp.

Qualitative and quantitative analysis of companies has been conducted to help clients understand the wider business environment as well as the strengths and weaknesses of key industry players. Data is qualitatively analyzed to categorize companies as pure play, category-focused, industry-focused, and diversified; it is quantitatively analyzed to categorize companies as dominant, leading, strong, tentative, and weak.

Recent Development and News in Neuromorphic ic market

  • In the Semiconductors industry, the rapid shift toward AI-optimized GPU architectures has strained enterprise thermal budgets, directly impacting Neuromorphic IC demand by forcing facility operators to adopt ultra-low power consumption alternatives that reduce cooling overhead by up to 30%.
  • Stringent energy efficiency mandates targeting commercial data infrastructure have forced a transition toward localized analytics, driving Neuromorphic IC adoption to ensure compliance while sustaining continuous deep learning inference on remote battery-operated nodes.
  • Breakthroughs in three-dimensional packaging have enabled the reliable integration of novel non-volatile memory materials, directly lowering Neuromorphic IC manufacturing costs by improving crossbar array fabrication yields by nearly 15%.
  • The rising implementation of autonomous safety regulations globally has accelerated the deployment of high-speed automotive sensor networks, pulling demand for Neuromorphic IC to execute real-time collision avoidance analytics with sub-millisecond low-latency processing.

Dive into Technavio’s robust research methodology, blending expert interviews, extensive data synthesis, and validated models for unparalleled Neuromorphic Ic Market insights. See full methodology.

Market Scope
Page number 320
Base year 2025
Historic period 2020-2024
Forecast period 2026-2030
Growth momentum & CAGR Accelerate at a CAGR of 52.5%
Market growth 2026-2030 USD 2714309.0 thousand
Market structure Fragmented
YoY growth 2025-2026(%) 47.6%
Key countries US, Canada, Mexico, China, Japan, India, South Korea, Australia, Indonesia, Germany, UK, France, Italy, Spain, The Netherlands, Saudi Arabia, UAE, South Africa, Israel, Turkey, Brazil, Argentina and Colombia
Competitive landscape Leading Companies, Market Positioning of Companies, Competitive Strategies, and Industry Risks

Request Free Sample

Research Analyst Overview

  • The Neuromorphic IC Market is rapidly transitioning from a theoretical research discipline into a foundational component of modern enterprise hardware strategy. As industrial operators prioritize extreme energy efficiency, the adoption of non-von Neumann architecture has become a strategic necessity to bypass the severe latency penalties of conventional processing.
  • By leveraging in-memory computing, hardware engineers are effectively co-locating data storage and processing tasks, which has successfully reduced localized processing latency by up to 40% in high-speed manufacturing environments. This architectural shift enables the direct deployment of artificial synapses within compact silicon footprints, providing a massive advantage for predictive maintenance systems that require constant sensory evaluation.
  • Furthermore, the integration of dynamic vision sensors allows enterprise robotics to process continuous visual changes autonomously, fundamentally altering supply chain automation workflows. Despite the complexity of manufacturing advanced memristive devices, commercial foundries are continuously improving specialized fabrication workflows to stabilize these components across broad temperature ranges.
  • This ongoing hardware evolution empowers organizations to drastically lower edge computing power requirements while maintaining the high-speed reflexes necessary for autonomous, closed-loop industrial operations.

What are the Key Data Covered in this Neuromorphic Ic Market Research and Growth Report?

  • What is the expected growth of the Neuromorphic Ic Market between 2026 and 2030?

    • USD 2.71 billion, at a CAGR of 52.5%

  • What segmentation does the market report cover?

    • The report is segmented by Type (Digital, Mixed, and Analog ), End-user (Consumer electronics, Automotive and transportation, Industrial automation, Aerospace and defense, and Healthcare and medical devices), Application (Image and vision processing, Pattern recognition and classification, Robotics and autonomous systems, Real time sensor processing, and Speech and audio processing) and Geography (North America, APAC, Europe, Middle East and Africa, South America)

  • Which regions are analyzed in the report?

    • North America, APAC, Europe, Middle East and Africa and South America

  • What are the key growth drivers and market challenges?

    • Exponential expansion of edge computing and autonomous infrastructure requirements, Severe software toolchain fragmentation and non-standardized algorithmic paradigms

  • Who are the major players in the Neuromorphic Ic Market?

    • Advanced Micro Devices Inc., Arm Ltd., BrainChip Holdings Ltd, GrAI Matter Labs, Hewlett Packard Enterprise Co., Innatera Nanosystems BV, Intel Corp., MediaTek Inc., NVIDIA Corp., PROPHESEE S.A., Qualcomm Inc., Renesas Electronics Corp., Samsung Electronics Co. Ltd., SK hynix Co. Ltd., Sony Group Corp., STMicroelectronics NV, Synaptics Inc., SynSense, Taiwan Semiconductor Co. Ltd. and TDK Corp.

Market Research Insights

  • The Neuromorphic IC Market is fundamentally reshaping edge computing by delivering unprecedented efficiency for data-intensive applications. By transitioning from conventional digital logic to brain-inspired architectures, enterprises achieve extreme energy conservation in remote deployments.
  • For instance, the integration of these specialized chips in industrial automated optical inspection lines has decreased false-positive defect rates by 18% while simultaneously reducing hardware thermal output by 45%. This capability heavily drives edge AI acceleration, allowing always-on edge intelligence systems to process continuous sensor data without draining battery reserves.
  • Additionally, utilizing customized software development toolchains has shortened hardware calibration times by 22%, streamlining the deployment of complex event-driven algorithms. By maintaining zero dynamic power during idle states, these processors provide an unmatched operational advantage for modern distributed sensing networks.

We can help! Our analysts can customize this neuromorphic ic market research report to meet your requirements.

Get in touch

1. Executive Summary

1.1 Market overview

Executive Summary - Chart on Market Overview
Executive Summary - Data Table on Market Overview
Executive Summary - Chart on Global Market Characteristics
Executive Summary - Chart on Market by Geography
Executive Summary - Chart on Market Segmentation by Type
Executive Summary - Chart on Market Segmentation by End-user
Executive Summary - Chart on Market Segmentation by Application
Executive Summary - Chart on Incremental Growth
Executive Summary - Data Table on Incremental Growth
Executive Summary - Chart on Company Market Positioning

2. Technavio Analysis

2.1 Analysis of price sensitivity, lifecycle, customer purchase basket, adoption rates, and purchase criteria

2.2 Criticality of inputs and Factors of differentiation

Chart on Overview on criticality of inputs and factors of differentiation

2.3 Factors of disruption

Chart on Overview on factors of disruption

2.4 Impact of drivers and challenges

Chart on Impact of drivers and challenges in 2025 and 2030

3. Market Landscape

3.1 Market ecosystem

Chart on Parent Market
Data Table on - Parent Market

3.2 Market characteristics

Chart on Market characteristics analysis

3.3 Value chain analysis

Chart on Value chain analysis

4. Market Sizing

4.1 Market definition

Data Table on Offerings of companies included in the market definition

4.2 Market segment analysis

Market segments

4.3 Market size 2025

4.4 Market outlook: Forecast for 2025-2030

Chart on Global - Market size and forecast 2025-2030 ($ thousand)
Data Table on Global - Market size and forecast 2025-2030 ($ thousand)
Chart on Global Market: Year-over-year growth 2025-2030 (%)
Data Table on Global Market: Year-over-year growth 2025-2030 (%)

5. Historic Market Size

5.1 Global Neuromorphic IC Market 2020 - 2024

Historic Market Size - Data Table on Global Neuromorphic IC Market 2020 - 2024 ($ thousand)

5.2 Type segment analysis 2020 - 2024

Historic Market Size - Type Segment 2020 - 2024 ($ thousand)

5.3 End-user segment analysis 2020 - 2024

Historic Market Size - End-user Segment 2020 - 2024 ($ thousand)

5.4 Application segment analysis 2020 - 2024

Historic Market Size - Application Segment 2020 - 2024 ($ thousand)

5.5 Geography segment analysis 2020 - 2024

Historic Market Size - Geography Segment 2020 - 2024 ($ thousand)

5.6 Country segment analysis 2020 - 2024

Historic Market Size - Country Segment 2020 - 2024 ($ thousand)

6. Qualitative Analysis

6.1 Impact of AI on Global Neuromorphic IC Market

6.2 Impact of Geopolitical Conflicts on Global Neuromorphic IC Market

7. Five Forces Analysis

7.1 Five forces summary

Five forces analysis - Comparison between 2025 and 2030

7.2 Bargaining power of buyers

Bargaining power of buyers - Impact of key factors 2025 and 2030

7.3 Bargaining power of suppliers

Bargaining power of suppliers - Impact of key factors in 2025 and 2030

7.4 Threat of new entrants

Threat of new entrants - Impact of key factors in 2025 and 2030

7.5 Threat of substitutes

Threat of substitutes - Impact of key factors in 2025 and 2030

7.6 Threat of rivalry

Threat of rivalry - Impact of key factors in 2025 and 2030

7.7 Market condition

Chart on Market condition - Five forces 2025 and 2030

8. Market Segmentation by Type

8.1 Market segments

Chart on Type - Market share 2025-2030 (%)
Data Table on Type - Market share 2025-2030 (%)

8.2 Comparison by Type

Chart on Comparison by Type
Data Table on Comparison by Type

8.3 Digital - Market size and forecast 2025-2030

Chart on Digital - Market size and forecast 2025-2030 ($ thousand)
Data Table on Digital - Market size and forecast 2025-2030 ($ thousand)
Chart on Digital - Year-over-year growth 2025-2030 (%)
Data Table on Digital - Year-over-year growth 2025-2030 (%)

8.4 Mixed - Market size and forecast 2025-2030

Chart on Mixed - Market size and forecast 2025-2030 ($ thousand)
Data Table on Mixed - Market size and forecast 2025-2030 ($ thousand)
Chart on Mixed - Year-over-year growth 2025-2030 (%)
Data Table on Mixed - Year-over-year growth 2025-2030 (%)

8.5 Analog - Market size and forecast 2025-2030

Chart on Analog - Market size and forecast 2025-2030 ($ thousand)
Data Table on Analog - Market size and forecast 2025-2030 ($ thousand)
Chart on Analog - Year-over-year growth 2025-2030 (%)
Data Table on Analog - Year-over-year growth 2025-2030 (%)

8.6 Market opportunity by Type

Market opportunity by Type ($ thousand)
Data Table on Market opportunity by Type ($ thousand)

9. Market Segmentation by End-user

9.1 Market segments

Chart on End-user - Market share 2025-2030 (%)
Data Table on End-user - Market share 2025-2030 (%)

9.2 Comparison by End-user

Chart on Comparison by End-user
Data Table on Comparison by End-user

9.3 Consumer electronics - Market size and forecast 2025-2030

Chart on Consumer electronics - Market size and forecast 2025-2030 ($ thousand)
Data Table on Consumer electronics - Market size and forecast 2025-2030 ($ thousand)
Chart on Consumer electronics - Year-over-year growth 2025-2030 (%)
Data Table on Consumer electronics - Year-over-year growth 2025-2030 (%)

9.4 Automotive and transportation - Market size and forecast 2025-2030

Chart on Automotive and transportation - Market size and forecast 2025-2030 ($ thousand)
Data Table on Automotive and transportation - Market size and forecast 2025-2030 ($ thousand)
Chart on Automotive and transportation - Year-over-year growth 2025-2030 (%)
Data Table on Automotive and transportation - Year-over-year growth 2025-2030 (%)

9.5 Industrial automation - Market size and forecast 2025-2030

Chart on Industrial automation - Market size and forecast 2025-2030 ($ thousand)
Data Table on Industrial automation - Market size and forecast 2025-2030 ($ thousand)
Chart on Industrial automation - Year-over-year growth 2025-2030 (%)
Data Table on Industrial automation - Year-over-year growth 2025-2030 (%)

9.6 Aerospace and defense - Market size and forecast 2025-2030

Chart on Aerospace and defense - Market size and forecast 2025-2030 ($ thousand)
Data Table on Aerospace and defense - Market size and forecast 2025-2030 ($ thousand)
Chart on Aerospace and defense - Year-over-year growth 2025-2030 (%)
Data Table on Aerospace and defense - Year-over-year growth 2025-2030 (%)

9.7 Healthcare and medical devices - Market size and forecast 2025-2030

Chart on Healthcare and medical devices - Market size and forecast 2025-2030 ($ thousand)
Data Table on Healthcare and medical devices - Market size and forecast 2025-2030 ($ thousand)
Chart on Healthcare and medical devices - Year-over-year growth 2025-2030 (%)
Data Table on Healthcare and medical devices - Year-over-year growth 2025-2030 (%)

9.8 Market opportunity by End-user

Market opportunity by End-user ($ thousand)
Data Table on Market opportunity by End-user ($ thousand)

10. Market Segmentation by Application

10.1 Market segments

Chart on Application - Market share 2025-2030 (%)
Data Table on Application - Market share 2025-2030 (%)

10.2 Comparison by Application

Chart on Comparison by Application
Data Table on Comparison by Application

10.3 Image and vision processing - Market size and forecast 2025-2030

Chart on Image and vision processing - Market size and forecast 2025-2030 ($ thousand)
Data Table on Image and vision processing - Market size and forecast 2025-2030 ($ thousand)
Chart on Image and vision processing - Year-over-year growth 2025-2030 (%)
Data Table on Image and vision processing - Year-over-year growth 2025-2030 (%)

10.4 Pattern recognition and classification - Market size and forecast 2025-2030

Chart on Pattern recognition and classification - Market size and forecast 2025-2030 ($ thousand)
Data Table on Pattern recognition and classification - Market size and forecast 2025-2030 ($ thousand)
Chart on Pattern recognition and classification - Year-over-year growth 2025-2030 (%)
Data Table on Pattern recognition and classification - Year-over-year growth 2025-2030 (%)

10.5 Robotics and autonomous systems - Market size and forecast 2025-2030

Chart on Robotics and autonomous systems - Market size and forecast 2025-2030 ($ thousand)
Data Table on Robotics and autonomous systems - Market size and forecast 2025-2030 ($ thousand)
Chart on Robotics and autonomous systems - Year-over-year growth 2025-2030 (%)
Data Table on Robotics and autonomous systems - Year-over-year growth 2025-2030 (%)

10.6 Real time sensor processing - Market size and forecast 2025-2030

Chart on Real time sensor processing - Market size and forecast 2025-2030 ($ thousand)
Data Table on Real time sensor processing - Market size and forecast 2025-2030 ($ thousand)
Chart on Real time sensor processing - Year-over-year growth 2025-2030 (%)
Data Table on Real time sensor processing - Year-over-year growth 2025-2030 (%)

10.7 Speech and audio processing - Market size and forecast 2025-2030

Chart on Speech and audio processing - Market size and forecast 2025-2030 ($ thousand)
Data Table on Speech and audio processing - Market size and forecast 2025-2030 ($ thousand)
Chart on Speech and audio processing - Year-over-year growth 2025-2030 (%)
Data Table on Speech and audio processing - Year-over-year growth 2025-2030 (%)

10.8 Market opportunity by Application

Market opportunity by Application ($ thousand)
Data Table on Market opportunity by Application ($ thousand)

11. Customer Landscape

11.1 Customer landscape overview

Analysis of price sensitivity, lifecycle, customer purchase basket, adoption rates, and purchase criteria

12. Geographic Landscape

12.1 Geographic segmentation

Chart on Market share by geography 2025-2030 (%)
Data Table on Market share by geography 2025-2030 (%)

12.2 Geographic comparison

Chart on Geographic comparison
Data Table on Geographic comparison

12.3 North America - Market size and forecast 2025-2030

Chart on North America - Market size and forecast 2025-2030 ($ thousand)
Data Table on North America - Market size and forecast 2025-2030 ($ thousand)
Chart on North America - Year-over-year growth 2025-2030 (%)
Data Table on North America - Year-over-year growth 2025-2030 (%)
Chart on Regional Comparison - North America
Data Table on Regional Comparison - North America

12.3.1 US - Market size and forecast 2025-2030

Chart on US - Market size and forecast 2025-2030 ($ thousand)
Data Table on US - Market size and forecast 2025-2030 ($ thousand)
Chart on US - Year-over-year growth 2025-2030 (%)
Data Table on US - Year-over-year growth 2025-2030 (%)

12.3.2 Canada - Market size and forecast 2025-2030

Chart on Canada - Market size and forecast 2025-2030 ($ thousand)
Data Table on Canada - Market size and forecast 2025-2030 ($ thousand)
Chart on Canada - Year-over-year growth 2025-2030 (%)
Data Table on Canada - Year-over-year growth 2025-2030 (%)

12.3.3 Mexico - Market size and forecast 2025-2030

Chart on Mexico - Market size and forecast 2025-2030 ($ thousand)
Data Table on Mexico - Market size and forecast 2025-2030 ($ thousand)
Chart on Mexico - Year-over-year growth 2025-2030 (%)
Data Table on Mexico - Year-over-year growth 2025-2030 (%)

12.4 APAC - Market size and forecast 2025-2030

Chart on APAC - Market size and forecast 2025-2030 ($ thousand)
Data Table on APAC - Market size and forecast 2025-2030 ($ thousand)
Chart on APAC - Year-over-year growth 2025-2030 (%)
Data Table on APAC - Year-over-year growth 2025-2030 (%)
Chart on Regional Comparison - APAC
Data Table on Regional Comparison - APAC

12.4.1 China - Market size and forecast 2025-2030

Chart on China - Market size and forecast 2025-2030 ($ thousand)
Data Table on China - Market size and forecast 2025-2030 ($ thousand)
Chart on China - Year-over-year growth 2025-2030 (%)
Data Table on China - Year-over-year growth 2025-2030 (%)

12.4.2 Japan - Market size and forecast 2025-2030

Chart on Japan - Market size and forecast 2025-2030 ($ thousand)
Data Table on Japan - Market size and forecast 2025-2030 ($ thousand)
Chart on Japan - Year-over-year growth 2025-2030 (%)
Data Table on Japan - Year-over-year growth 2025-2030 (%)

12.4.3 India - Market size and forecast 2025-2030

Chart on India - Market size and forecast 2025-2030 ($ thousand)
Data Table on India - Market size and forecast 2025-2030 ($ thousand)
Chart on India - Year-over-year growth 2025-2030 (%)
Data Table on India - Year-over-year growth 2025-2030 (%)

12.4.4 South Korea - Market size and forecast 2025-2030

Chart on South Korea - Market size and forecast 2025-2030 ($ thousand)
Data Table on South Korea - Market size and forecast 2025-2030 ($ thousand)
Chart on South Korea - Year-over-year growth 2025-2030 (%)
Data Table on South Korea - Year-over-year growth 2025-2030 (%)

12.4.5 Australia - Market size and forecast 2025-2030

Chart on Australia - Market size and forecast 2025-2030 ($ thousand)
Data Table on Australia - Market size and forecast 2025-2030 ($ thousand)
Chart on Australia - Year-over-year growth 2025-2030 (%)
Data Table on Australia - Year-over-year growth 2025-2030 (%)

12.4.6 Indonesia - Market size and forecast 2025-2030

Chart on Indonesia - Market size and forecast 2025-2030 ($ thousand)
Data Table on Indonesia - Market size and forecast 2025-2030 ($ thousand)
Chart on Indonesia - Year-over-year growth 2025-2030 (%)
Data Table on Indonesia - Year-over-year growth 2025-2030 (%)

12.5 Europe - Market size and forecast 2025-2030

Chart on Europe - Market size and forecast 2025-2030 ($ thousand)
Data Table on Europe - Market size and forecast 2025-2030 ($ thousand)
Chart on Europe - Year-over-year growth 2025-2030 (%)
Data Table on Europe - Year-over-year growth 2025-2030 (%)
Chart on Regional Comparison - Europe
Data Table on Regional Comparison - Europe

12.5.1 Germany - Market size and forecast 2025-2030

Chart on Germany - Market size and forecast 2025-2030 ($ thousand)
Data Table on Germany - Market size and forecast 2025-2030 ($ thousand)
Chart on Germany - Year-over-year growth 2025-2030 (%)
Data Table on Germany - Year-over-year growth 2025-2030 (%)

12.5.2 UK - Market size and forecast 2025-2030

Chart on UK - Market size and forecast 2025-2030 ($ thousand)
Data Table on UK - Market size and forecast 2025-2030 ($ thousand)
Chart on UK - Year-over-year growth 2025-2030 (%)
Data Table on UK - Year-over-year growth 2025-2030 (%)

12.5.3 France - Market size and forecast 2025-2030

Chart on France - Market size and forecast 2025-2030 ($ thousand)
Data Table on France - Market size and forecast 2025-2030 ($ thousand)
Chart on France - Year-over-year growth 2025-2030 (%)
Data Table on France - Year-over-year growth 2025-2030 (%)

12.5.4 Italy - Market size and forecast 2025-2030

Chart on Italy - Market size and forecast 2025-2030 ($ thousand)
Data Table on Italy - Market size and forecast 2025-2030 ($ thousand)
Chart on Italy - Year-over-year growth 2025-2030 (%)
Data Table on Italy - Year-over-year growth 2025-2030 (%)

12.5.5 Spain - Market size and forecast 2025-2030

Chart on Spain - Market size and forecast 2025-2030 ($ thousand)
Data Table on Spain - Market size and forecast 2025-2030 ($ thousand)
Chart on Spain - Year-over-year growth 2025-2030 (%)
Data Table on Spain - Year-over-year growth 2025-2030 (%)

12.5.6 The Netherlands - Market size and forecast 2025-2030

Chart on The Netherlands - Market size and forecast 2025-2030 ($ thousand)
Data Table on The Netherlands - Market size and forecast 2025-2030 ($ thousand)
Chart on The Netherlands - Year-over-year growth 2025-2030 (%)
Data Table on The Netherlands - Year-over-year growth 2025-2030 (%)

12.6 Middle East and Africa - Market size and forecast 2025-2030

Chart on Middle East and Africa - Market size and forecast 2025-2030 ($ thousand)
Data Table on Middle East and Africa - Market size and forecast 2025-2030 ($ thousand)
Chart on Middle East and Africa - Year-over-year growth 2025-2030 (%)
Data Table on Middle East and Africa - Year-over-year growth 2025-2030 (%)
Chart on Regional Comparison - Middle East and Africa
Data Table on Regional Comparison - Middle East and Africa

12.6.1 Saudi Arabia - Market size and forecast 2025-2030

Chart on Saudi Arabia - Market size and forecast 2025-2030 ($ thousand)
Data Table on Saudi Arabia - Market size and forecast 2025-2030 ($ thousand)
Chart on Saudi Arabia - Year-over-year growth 2025-2030 (%)
Data Table on Saudi Arabia - Year-over-year growth 2025-2030 (%)

12.6.2 UAE - Market size and forecast 2025-2030

Chart on UAE - Market size and forecast 2025-2030 ($ thousand)
Data Table on UAE - Market size and forecast 2025-2030 ($ thousand)
Chart on UAE - Year-over-year growth 2025-2030 (%)
Data Table on UAE - Year-over-year growth 2025-2030 (%)

12.6.3 South Africa - Market size and forecast 2025-2030

Chart on South Africa - Market size and forecast 2025-2030 ($ thousand)
Data Table on South Africa - Market size and forecast 2025-2030 ($ thousand)
Chart on South Africa - Year-over-year growth 2025-2030 (%)
Data Table on South Africa - Year-over-year growth 2025-2030 (%)

12.6.4 Israel - Market size and forecast 2025-2030

Chart on Israel - Market size and forecast 2025-2030 ($ thousand)
Data Table on Israel - Market size and forecast 2025-2030 ($ thousand)
Chart on Israel - Year-over-year growth 2025-2030 (%)
Data Table on Israel - Year-over-year growth 2025-2030 (%)

12.6.5 Turkey - Market size and forecast 2025-2030

Chart on Turkey - Market size and forecast 2025-2030 ($ thousand)
Data Table on Turkey - Market size and forecast 2025-2030 ($ thousand)
Chart on Turkey - Year-over-year growth 2025-2030 (%)
Data Table on Turkey - Year-over-year growth 2025-2030 (%)

12.7 South America - Market size and forecast 2025-2030

Chart on South America - Market size and forecast 2025-2030 ($ thousand)
Data Table on South America - Market size and forecast 2025-2030 ($ thousand)
Chart on South America - Year-over-year growth 2025-2030 (%)
Data Table on South America - Year-over-year growth 2025-2030 (%)
Chart on Regional Comparison - South America
Data Table on Regional Comparison - South America

12.7.1 Brazil - Market size and forecast 2025-2030

Chart on Brazil - Market size and forecast 2025-2030 ($ thousand)
Data Table on Brazil - Market size and forecast 2025-2030 ($ thousand)
Chart on Brazil - Year-over-year growth 2025-2030 (%)
Data Table on Brazil - Year-over-year growth 2025-2030 (%)

12.7.2 Argentina - Market size and forecast 2025-2030

Chart on Argentina - Market size and forecast 2025-2030 ($ thousand)
Data Table on Argentina - Market size and forecast 2025-2030 ($ thousand)
Chart on Argentina - Year-over-year growth 2025-2030 (%)
Data Table on Argentina - Year-over-year growth 2025-2030 (%)

12.7.3 Colombia - Market size and forecast 2025-2030

Chart on Colombia - Market size and forecast 2025-2030 ($ thousand)
Data Table on Colombia - Market size and forecast 2025-2030 ($ thousand)
Chart on Colombia - Year-over-year growth 2025-2030 (%)
Data Table on Colombia - Year-over-year growth 2025-2030 (%)

12.8 Market opportunity by geography

Market opportunity by geography ($ thousand)
Data Tables on Market opportunity by geography ($ thousand)

13. Drivers, Challenges, and Opportunity

13.1 Market drivers

Exponential expansion of edge computing and autonomous infrastructure requirements
Unprecedented energy efficiency imperatives in next-generation AI models
Accelerated integration of event-based sensory systems and multi-modal sensor fusion

13.2 Market challenges

Severe software toolchain fragmentation and non-standardized algorithmic paradigms
Manufacturing complexity and fabrication yield bottlenecks for emerging memory substrates
Absence of universal industrial benchmarks and competitive pressure from incremental silicon advancements

13.3 Impact of drivers and challenges

Impact of drivers and challenges in 2025 and 2030

13.4 Market opportunities

Proliferation of on-chip continuous learning and adaptive spiking neural architectures
Commercialization of heterogeneous memory-centric neuromorphic computing architectures
Standardization of neuromorphic software frameworks

14. Competitive Landscape

14.1 Overview

14.2

Overview on criticality of inputs and factors of differentiation

14.3 Landscape disruption

Overview on factors of disruption

14.4 Industry risks

Impact of key risks on business

15. Competitive Analysis

15.1 Companies profiled

Companies covered

15.2 Company ranking index

15.3 Market positioning of companies

Matrix on companies position and classification

15.4 Advanced Micro Devices Inc.

Advanced Micro Devices Inc. - Overview
Advanced Micro Devices Inc. - Business segments
Advanced Micro Devices Inc. - Key news
Advanced Micro Devices Inc. - Key offerings
Advanced Micro Devices Inc. - Segment focus
SWOT

15.5 Arm Ltd.

Arm Ltd. - Overview
Arm Ltd. - Product / Service
Arm Ltd. - Key offerings
SWOT

15.6 GrAI Matter Labs

GrAI Matter Labs - Overview
GrAI Matter Labs - Product / Service
GrAI Matter Labs - Key offerings
SWOT

15.7 Hewlett Packard Enterprise Co.

Hewlett Packard Enterprise Co. - Overview
Hewlett Packard Enterprise Co. - Business segments
Hewlett Packard Enterprise Co. - Key news
Hewlett Packard Enterprise Co. - Key offerings
Hewlett Packard Enterprise Co. - Segment focus
SWOT

15.8 Innatera Nanosystems BV

Innatera Nanosystems BV - Overview
Innatera Nanosystems BV - Product / Service
Innatera Nanosystems BV - Key offerings
SWOT

15.9 Intel Corp.

Intel Corp. - Overview
Intel Corp. - Business segments
Intel Corp. - Key news
Intel Corp. - Key offerings
Intel Corp. - Segment focus
SWOT

15.10 NVIDIA Corp.

NVIDIA Corp. - Overview
NVIDIA Corp. - Business segments
NVIDIA Corp. - Key news
NVIDIA Corp. - Key offerings
NVIDIA Corp. - Segment focus
SWOT

15.11 PROPHESEE S.A.

PROPHESEE S.A. - Overview
PROPHESEE S.A. - Product / Service
PROPHESEE S.A. - Key offerings
SWOT

15.12 Qualcomm Inc.

Qualcomm Inc. - Overview
Qualcomm Inc. - Business segments
Qualcomm Inc. - Key news
Qualcomm Inc. - Key offerings
Qualcomm Inc. - Segment focus
SWOT

15.13 Samsung Electronics Co. Ltd.

Samsung Electronics Co. Ltd. - Overview
Samsung Electronics Co. Ltd. - Business segments
Samsung Electronics Co. Ltd. - Key news
Samsung Electronics Co. Ltd. - Key offerings
Samsung Electronics Co. Ltd. - Segment focus
SWOT

15.14 SK hynix Co. Ltd.

SK hynix Co. Ltd. - Overview
SK hynix Co. Ltd. - Product / Service
SK hynix Co. Ltd. - Key offerings
SWOT

15.15 STMicroelectronics NV

STMicroelectronics NV - Overview
STMicroelectronics NV - Business segments
STMicroelectronics NV - Key news
STMicroelectronics NV - Key offerings
STMicroelectronics NV - Segment focus
SWOT

15.16 Synaptics Inc.

Synaptics Inc. - Overview
Synaptics Inc. - Product / Service
Synaptics Inc. - Key offerings
SWOT

15.17 SynSense

SynSense - Overview
SynSense - Product / Service
SynSense - Key offerings
SWOT

15.18 Taiwan Semiconductor Co. Ltd.

Taiwan Semiconductor Co. Ltd. - Overview
Taiwan Semiconductor Co. Ltd. - Product / Service
Taiwan Semiconductor Co. Ltd. - Key news
Taiwan Semiconductor Co. Ltd. - Key offerings
SWOT

16. Appendix

16.1 Scope of the report

Market definition
Objectives
Notes and caveats

16.2 Inclusions and exclusions checklist

Inclusions checklist
Exclusions checklist

16.3 Currency conversion rates for US$

16.4 Research methodology

16.5 Data procurement

Information sources

16.6 Data validation

16.7 Validation techniques employed for market sizing

16.8 Data synthesis

16.9 360 degree market analysis

16.10 List of abbreviations

Research Methodology

Technavio presents a detailed picture of the market by way of study, synthesis, and summation of data from multiple sources. The analysts have presented the various facets of the market with a particular focus on identifying the key industry influencers. The data thus presented is comprehensive, reliable, and the result of extensive research, both primary and secondary.

INFORMATION SOURCES

Primary sources

  • Manufacturers and suppliers
  • Channel partners
  • Industry experts
  • Strategic decision makers

Secondary sources

  • Industry journals and periodicals
  • Government data
  • Financial reports of key industry players
  • Historical data
  • Press releases

DATA ANALYSIS

Data Synthesis

  • Collation of data
  • Estimation of key figures
  • Analysis of derived insights

Data Validation

  • Triangulation with data models
  • Reference against proprietary databases
  • Corroboration with industry experts

REPORT WRITING

Qualitative

  • Market drivers
  • Market challenges
  • Market trends
  • Five forces analysis

Quantitative

  • Market size and forecast
  • Market segmentation
  • Geographical insights
  • Competitive landscape

Interested in this report?

Get your sample now to see our research methodology and insights!

Download Now

Frequently Asked Questions

Neuromorphic Ic market growth will increase by USD 2714309.0 thousand thousand during 2026-2030.

The Neuromorphic Ic market is expected to grow at a CAGR of 52.5% during 2026-2030.

Neuromorphic Ic market is segmented by Type (Digital, Mixed, Analog) End-user (Consumer electronics, Automotive and transportation, Industrial automation, Aerospace and defense, Healthcare and medical devices) Application (Image and vision processing, Pattern recognition and classification, Robotics and autonomous systems, Real time sensor processing, Speech and audio processing)

Advanced Micro Devices Inc., Arm Ltd., BrainChip Holdings Ltd, GrAI Matter Labs, Hewlett Packard Enterprise Co., Innatera Nanosystems BV, Intel Corp., MediaTek Inc., NVIDIA Corp., PROPHESEE S.A., Qualcomm Inc., Renesas Electronics Corp., Samsung Electronics Co. Ltd., SK hynix Co. Ltd., Sony Group Corp., STMicroelectronics NV, Synaptics Inc., SynSense, Taiwan Semiconductor Co. Ltd., TDK Corp. are a few of the key vendors in the Neuromorphic Ic market.

North America will register the highest growth rate of 34.4% among the other regions. Therefore, the Neuromorphic Ic market in North America is expected to garner significant business opportunities for the vendors during the forecast period.

US, Canada, Mexico, China, Japan, India, South Korea, Australia, Indonesia, Germany, UK, France, Italy, Spain, The Netherlands, Saudi Arabia, UAE, South Africa, Israel, Turkey, Brazil, Argentina, Colombia

  • Exponential expansion of edge computing and autonomous infrastructure requirements is the driving factor this market.

The Neuromorphic Ic market vendors should focus on grabbing business opportunities from the Type segment as it accounted for the largest market share in the base year.
RIA - Research AI Assistant
Ask RIA
