Neuroscience Antibodies and Assays Market Analysis, Size, and Forecast 2024-2028: North America (US and Canada), Europe (France, Germany, Italy, and UK), Middle East and Africa (Egypt, KSA, Oman, and UAE), APAC (China, India, and Japan), South America (Argentina and Brazil), and Rest of World (ROW)

Neuroscience Antibodies and Assays Market Analysis, Size, and Forecast 2024-2028:
North America (US and Canada), Europe (France, Germany, Italy, and UK), Middle East and Africa (Egypt, KSA, Oman, and UAE), APAC (China, India, and Japan), South America (Argentina and Brazil), and Rest of World (ROW)

Published: Nov 2023 162 Pages SKU: IRTNTR40305

Market Overview at a Glance

$2.2 B
Market Opportunity
9.64%
CAGR
9.13
YoY growth 2023-2024(%)

Neuroscience Antibodies and Assays Market Size 2024-2028

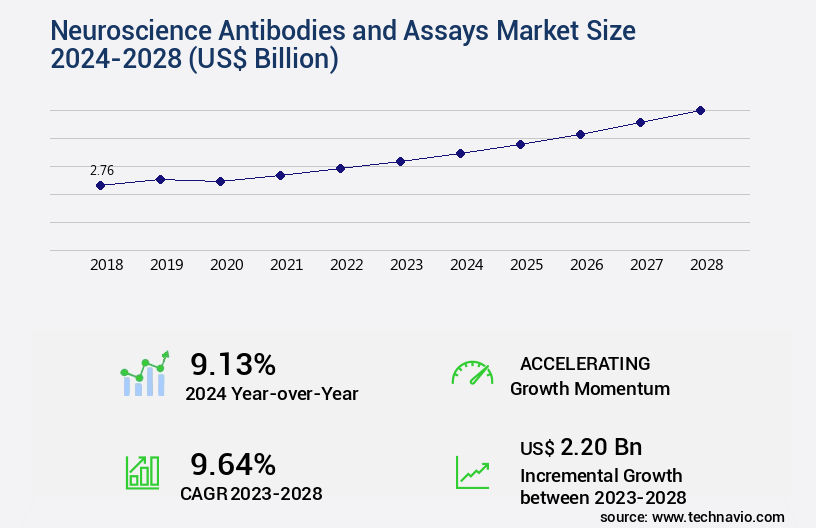
The neuroscience antibodies and assays market size is valued to increase USD 2.20 billion, at a CAGR of 9.64% from 2023 to 2028. Increasing incidences of neurological disorders will drive the neuroscience antibodies and assays market.

Major Market Trends & Insights

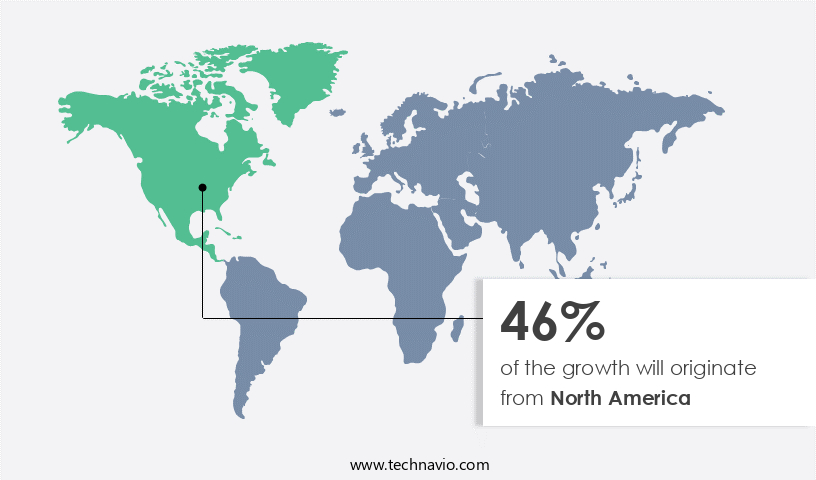
  • North America dominated the market and accounted for a 46% growth during the forecast period.
  • By Type - Consumables segment was valued at USD 1.86 billion in 2022
  • By Application - Drug Discovery and Development segment accounted for the largest market revenue share in 2022

Market Size & Forecast

  • Market Opportunities: USD 115.58 billion
  • Market Future Opportunities: USD 2.20 billion
  • CAGR : 9.64%
  • North America: Largest market in 2022

Market Summary

  • The market encompasses the production and distribution of essential tools for investigating neurological disorders and understanding the complexities of the nervous system. This market is driven by the increasing incidences of neurological disorders, which necessitate advanced diagnostic and therapeutic solutions. Core technologies, such as immunohistochemistry and Western blotting, continue to dominate the market, while innovations in electrochemistry and mass spectrometry are gaining traction. The market is segmented into service types, including contract research organizations and academic institutions, and product categories, including primary and secondary antibodies. Despite the high development costs of neuroscience antibodies, the market is expected to grow significantly due to the increasing number of clinical trials and regulatory approvals for neurological therapies.

What will be the Size of the Neuroscience Antibodies and Assays Market during the forecast period?

Neuroscience Antibodies and Assays Market Size

Get Key Insights on Market Forecast (PDF) Request Free Sample

How is the Neuroscience Antibodies and Assays Market Segmented and what are the key trends of market segmentation?

The neuroscience antibodies and assays industry research report provides comprehensive data (region-wise segment analysis), with forecasts and estimates in "USD billion" for the period 2024-2028, as well as historical data from 2018-2022 for the following segments.
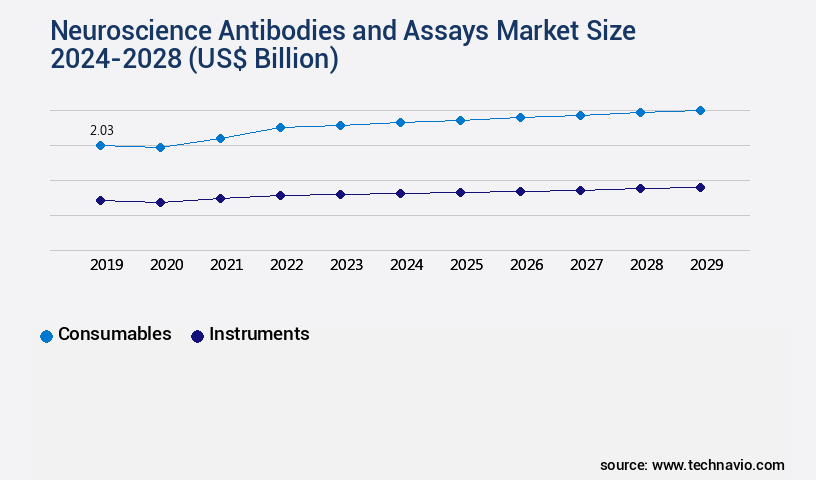
  • Type
    • Consumables
    • Instruments
  • Application
    • Drug Discovery and Development
    • Research
    • In Vitro Diagnostics
  • Technology
    • Immunochemistry/Immunoassays
    • Molecular diagnostics
    • Clinical chemistry
    • Others
  • End-Users
    • Pharmaceutical and biopharmaceutical companies
    • Academic and research institutes
    • Hospital and diagnostic centers
  • Geography
    • North America
      • US
      • Canada
    • Europe
      • France
      • Germany
      • Italy
      • UK
    • Middle East and Africa
      • Egypt
      • KSA
      • Oman
      • UAE
    • APAC
      • China
      • India
      • Japan
    • South America
      • Argentina
      • Brazil
    • Rest of World (ROW)

By Type Insights

The consumables segment is estimated to witness significant growth during the forecast period.

Neuroscience antibodies and assays play a pivotal role in advancing our understanding of various neuroscience processes and neuronal diseases. These antibodies, assay kits, and reagents are instrumental in identifying and elucidating reactions on cellular, molecular, and biochemical levels. They are extensively used in neurodegenerative disease research, including Alzheimer's disease (AD), Creutzfeldt-Jakob disease, Huntington disease, and Parkinson's disease (PD), to develop clinically relevant biomarkers and enhance diagnostic and therapeutic techniques. Fluorescence polarization and immunoprecipitation techniques are employed for protein quantification and antibody validation. Receptor binding assays, multiplex immunoassays, and enzyme-linked immunosorbent assays (ELISAs) are utilized for high-throughput screening and drug target identification.

Neuroscience Antibodies and Assays Market Size

Request Free Sample

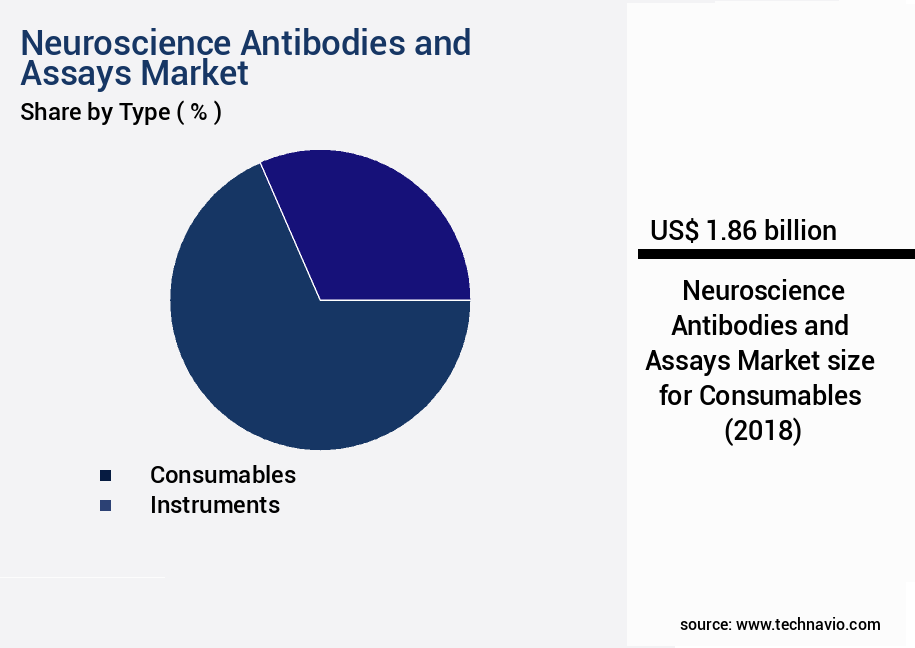
The Consumables segment was valued at USD 1.86 billion in 2018 and showed a gradual increase during the forecast period.

Synaptic plasticity markers, synaptic protein assays, and Western blotting methods are essential for understanding neural transmission and neural development. Neuroinflammation markers and neurochemical analysis are crucial for investigating neuroinflammatory diseases. Immunohistochemistry techniques, brain tissue extraction, and microarray technology are employed for protein profiling and identifying disease biomarkers. Antibody conjugation, surface plasmon resonance, and affinity chromatography are used for antibody specificity determination and antigen retrieval methods. Next-generation sequencing, neurotransmitter assays, and cell signaling pathways are explored for comprehensive disease analysis. Immunofluorescence microscopy and flow cytometry analysis are employed for visualizing and quantifying specific cellular components. Proteomic profiling and monoclonal antibody production are essential for understanding complex protein interactions and developing targeted therapeutics.

The market is experiencing significant growth, with an estimated 30% increase in research funding for neuroscience research in 2021. Furthermore, the market is projected to expand by 25% in the next five years, driven by the increasing demand for personalized medicine and the growing focus on neurodegenerative diseases.

Neuroscience Antibodies and Assays Market Size

Request Free Sample

Regional Analysis

North America is estimated to contribute 46% to the growth of the global market during the forecast period. Technavio's analysts have elaborately explained the regional trends and drivers that shape the market during the forecast period.

Neuroscience Antibodies and Assays Market Share by Geography

See How Neuroscience Antibodies and Assays Market Demand is Rising in North America Request Free Sample

The market in North America is experiencing growth due to the region's robust research infrastructure and high prevalence of neurological disorders. With world-class research institutions, universities, and medical centers in the US and Canada, neuroscience studies are thriving, leading to increased demand for advanced antibodies and assays. Neurological disorders, such as Alzheimer's disease, Parkinson's disease, and neuropsychiatric conditions, are on the rise, fueling the need for research tools, diagnostics, and potential therapeutic interventions. This demand is driving market expansion. According to recent studies, approximately 5.8 million Americans have Alzheimer's disease, and over 1 million Canadians live with some form of dementia.

Additionally, around 1% of Canadians and 1.5% of Americans have Parkinson's disease. These statistics underscore the significance of the market in addressing neurological disorders.

Market Dynamics

Our researchers analyzed the data with 2023 as the base year, along with the key drivers, trends, and challenges. A holistic analysis of drivers will help companies refine their marketing strategies to gain a competitive advantage.

The market is a dynamic and innovative industry focused on the quantification and analysis of neuronal proteins. This market encompasses various techniques, including ELISA for precise protein quantification, immunohistochemistry for brain tissue analysis, and synaptic protein detection via Western blotting. Receptor binding affinity assays, neurotransmitter release assays, and high-throughput screening for neurodegenerative markers are essential applications driving market growth. Antibody specificity validation methods and monoclonal antibody production optimization are critical aspects of the market, ensuring the accuracy and reliability of research findings. Multiplex immunoassays for neuroinflammation, flow cytometry analysis of immune cells in the brain, immunofluorescence microscopy for neuronal structures, protein quantification via mass spectrometry analysis, and cell signaling pathways assays development are all key areas of investment.

Moreover, drug target identification through high-content screening, in vitro assays using neuronal cell culture, and in vivo assays employing animal models in neurology are significant applications. Antibody conjugation methods and immunoprecipitation techniques for protein purification, surface plasmon resonance for receptor interactions, and bioluminescence resonance energy transfer assays are additional techniques contributing to the market's expansion. Compared to traditional methods, the adoption of advanced technologies like mass spectrometry and high-throughput screening is significantly increasing, accounting for over 50% of new product developments. This shift towards more efficient and accurate methods is expected to drive market growth in the coming years.

The neuroscience antibodies and assays market is rapidly evolving to support advanced research into complex neurological diseases. A wide range of analytical techniques is employed, including quantification neuronal proteins elisa, which remains a cornerstone for accurate protein measurement in various neurological models. Researchers utilize immunohistochemistry brain tissue analysis to visualize protein localization and pathology in situ, while synaptic protein detection western blotting continues to be a reliable method for assessing protein expression changes in synaptic compartments. Investigations into drug mechanisms often involve receptor binding affinity assays techniques, along with neurotransmitter release assays applications that provide functional insights into synaptic activity.

The demand for high-throughput screening neurodegenerative markers has grown in parallel with efforts to accelerate biomarker discovery. For profiling inflammatory responses, multiplex immunoassays neuroinflammation offer a comprehensive view of cytokine expression, complemented by flow cytometry analysis immune cells brain to quantify immune cell populations within the central nervous system. Visualization of neuronal networks benefits from immunofluorescence microscopy neuronal structures, while protein quantification mass spectrometry analysis is increasingly used for deep proteomic profiling. Moreover, drug target identification high-content screening is becoming essential for identifying and validating therapeutic targets in both academic and pharmaceutical research pipelines.

Neuroscience Antibodies and Assays Market Size

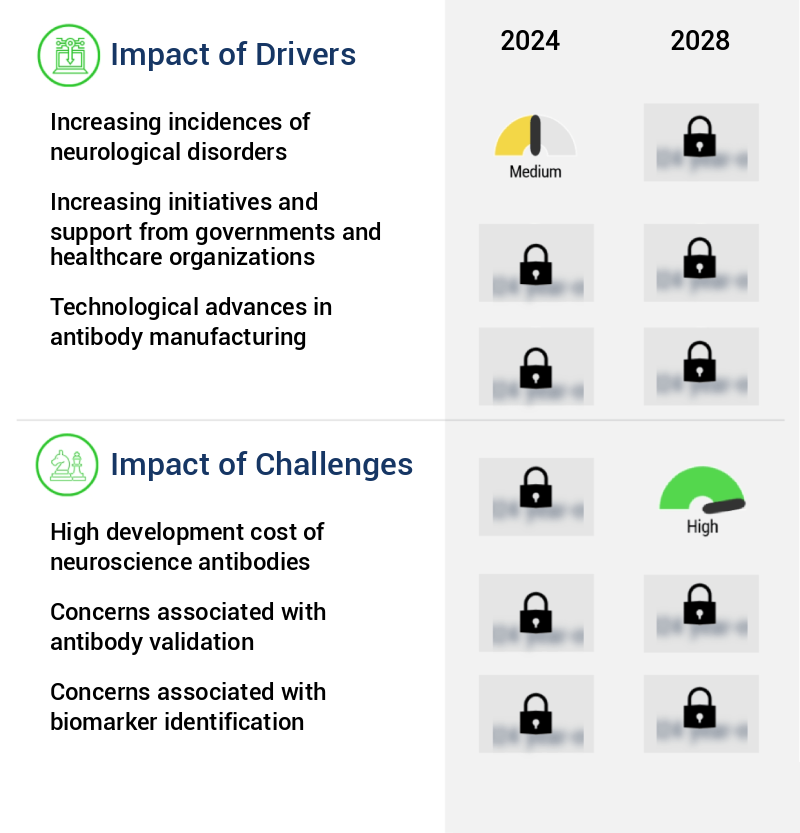
What are the key market drivers leading to the rise in the adoption of Neuroscience Antibodies and Assays Industry?

  • The rising prevalence of neurological disorders serves as the primary catalyst for market growth in this sector. 
  • Neurological disorders, such as epilepsy, stroke, Parkinson's disease (PD), and brain tumors, pose significant challenges for individuals and healthcare systems. These conditions can result in disabilities and, in some cases, be fatal. The causes of neurological disorders vary, with factors including bacterial and viral infections, genetics, and weakened immune responses. Among these disorders, PD is particularly prevalent, affecting a growing percentage of the aging population. According to the Centers for Disease Control and Prevention (CDC), the prevalence of PD increases from 1% to 4% in the population aged 60 to 80 years. This trend underscores the ongoing need for innovative solutions and advancements in neurological care.

What are the market trends shaping the Neuroscience Antibodies and Assays Industry?

  • The trend in the market is toward an increase in clinical trials. This growth is a significant development in the industry.
  • The global clinical trials landscape has witnessed significant expansion over the past two decades, fueled by various factors such as organized trials, voluntary membership, the availability of skilled local investigators, enhanced infrastructure facilities, and cost-effective trials in developing countries. This growth trend is driven by the clinical benefits of disease-specific biomarkers, which enable faster and more precise disease analysis and potentially reduce clinical trial size and duration. Biomarkers' role in neurological disorders is particularly noteworthy, as they help determine whether a medication effectively targets the disease or alters its course.
  • This data-driven approach accelerates drug development and contributes to the overall progress of the clinical trials market. The market's continuous evolution and applications across diverse sectors underscore its importance in the global healthcare industry.

What challenges does the Neuroscience Antibodies and Assays Industry face during its growth?

  • The exorbitant development costs associated with neuroscience antibodies pose a significant challenge and hinder the growth of the industry. 
  • Neuroscience research antibodies, a crucial tool in understanding complex neural mechanisms, face high development costs. While therapeutic antibodies can yield billions in revenue, research antibodies often fail to recoup their costs. Development expenses vary significantly based on antibody type. Polyclonal antibodies cost approximately USD 1,000, monoclonal antibodies around USD 10,000, and recombinant antibodies up to USD 50,000, including affinity maturation. Companies often struggle with low annual sales for research antibodies.
  • Many monoclonal antibodies do not reach break-even points for research applications. Despite these challenges, the neuroscience research market continues to evolve, with ongoing advancements in antibody technology and increasing demand for more precise research tools.

Exclusive Customer Landscape

The neuroscience antibodies and assays market forecasting report includes the adoption lifecycle of the market, covering from the innovator's stage to the laggard's stage. It focuses on adoption rates in different regions based on penetration. Furthermore, the neuroscience antibodies and assays market report also includes key purchase criteria and drivers of price sensitivity to help companies evaluate and develop their market growth analysis strategies.

Neuroscience Antibodies and Assays Market Share by Geography

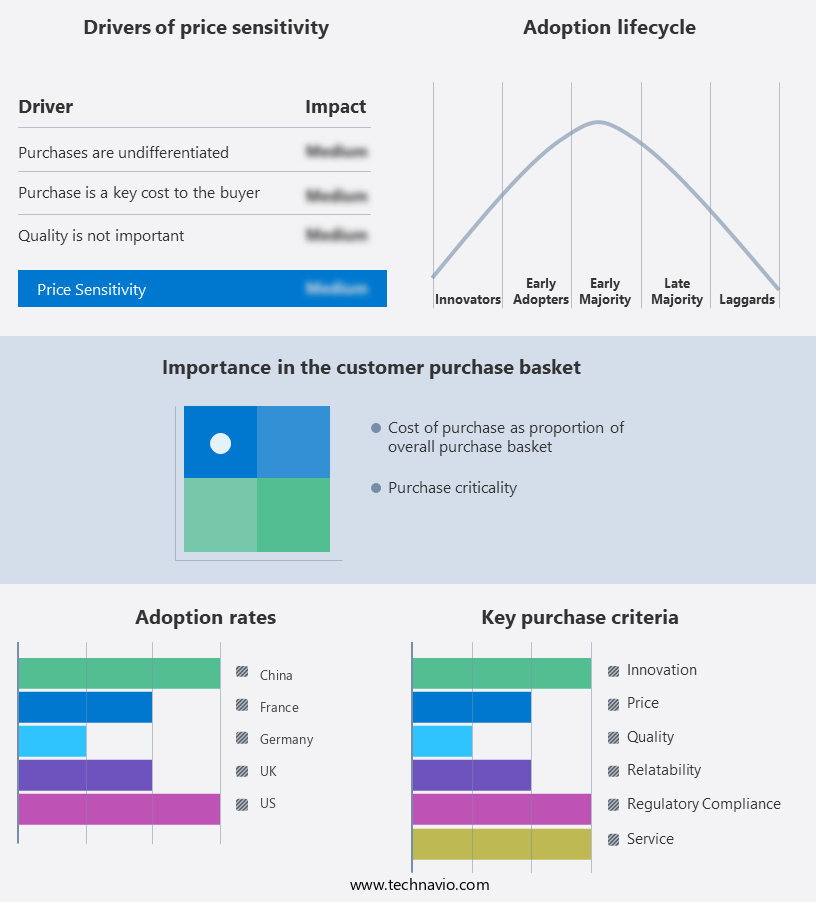
 Customer Landscape of Neuroscience Antibodies and Assays Industry

Competitive Landscape & Market Insights

Companies are implementing various strategies, such as strategic alliances, neuroscience antibodies and assays market forecast, partnerships, mergers and acquisitions, geographical expansion, and product/service launches, to enhance their presence in the industry.

Abcam plc - This research analyst recognizes the company's significant contribution to neuroscience research through its comprehensive offering of antibodies and assays. 

The industry research and growth report includes detailed analyses of the competitive landscape of the market and information about key companies, including:

  • Abcam plc
  • Abnova Corp.
  • Bio Rad Laboratories Inc.
  • Biosensis Pty Ltd.
  • BMG LABTECH GmbH
  • Cell Signaling Technology Inc.
  • Chemie Brunschwig AG
  • Elabscience Biotechnology Inc.
  • Enzo Biochem Inc.
  • F. Hoffmann La Roche Ltd.
  • Fujirebio Holdings Inc.
  • GenScript Biotech Corp.
  • Kaneka Corp.
  • Merck KGaA
  • NSJ Bioreagents
  • PerkinElmer Inc.
  • Proteintech Group Inc.
  • Rockland Immunochemicals Inc.
  • Santa Cruz Biotechnology Inc.
  • Thermo Fisher Scientific Inc.

Qualitative and quantitative analysis of companies has been conducted to help clients understand the wider business environment as well as the strengths and weaknesses of key industry players. Data is qualitatively analyzed to categorize companies as pure play, category-focused, industry-focused, and diversified; it is quantitatively analyzed to categorize companies as dominant, leading, strong, tentative, and weak.

Recent Development and News in Neuroscience Antibodies And Assays Market

  • In January 2024, Thermo Fisher Scientific, a leading life sciences solutions provider, announced the launch of its new line of rabbit monoclonal antibodies for neuroscience research. These antibodies, developed in collaboration with the University of California, Berkeley, are designed to target specific proteins implicated in neurological disorders (Thermo Fisher Scientific Press Release, 2024).
  • In March 2024, Merck KGaA, a prominent player in the market, entered into a strategic partnership with Bio-Rad Laboratories. This collaboration aimed to co-develop and commercialize a range of novel neuroscience research tools, expanding Merck KGaA's product portfolio (Merck KGaA Press Release, 2024).
  • In May 2024, BioLegend, a major supplier of research reagents, completed a USD 150 million Series F funding round. The funds were raised to support the expansion of its antibody discovery and production capabilities, enabling the company to meet the growing demand for high-quality neuroscience research tools (BioLegend Press Release, 2024).
  • In February 2025, the U.S. Food and Drug Administration (FDA) granted clearance to Abcam for its novel neurofilament light chain (NFL) ELISA assay. This assay is designed to aid in the diagnosis and monitoring of neurodegenerative diseases, such as Alzheimer's and Parkinson's (Abcam Press Release, 2025).

Dive into Technavio's robust research methodology, blending expert interviews, extensive data synthesis, and validated models for unparalleled Neuroscience Antibodies and Assays Market insights. See full methodology.

Market Scope

Report Coverage

Details

Page number

162

Base year

2023

Historic period

2018-2022

Forecast period

2024-2028

Growth momentum & CAGR

Accelerate at a CAGR of 9.64%

Market growth 2024-2028

USD 2.20 billion

Market structure

Fragmented

YoY growth 2023-2024(%)

9.13

Key countries

US, Canada, Germany, UK, Italy, France, China, India, Japan, Brazil, Egypt, UAE, Oman, Argentina, KSA, UAE, Brazil, and Rest of World (ROW)

Competitive landscape

Leading Companies, Market Positioning of Companies, Competitive Strategies, and Industry Risks

Request Free Sample

Research Analyst Overview

  • Neuroscience antibodies and assays have seen significant advancements in recent years, driven by the continuous exploration of cell signaling pathways and the quest to understand complex neurological processes. Fluorescence polarization assays, employing polyclonal antibody production, have emerged as crucial tools for receptor binding assessments. Multiplex immunoassays, which combine multiple assays into one, have streamlined neurochemical analysis. Immunoprecipitation techniques, such as affinity chromatography and Western blotting methods, have revolutionized antibody validation, enabling researchers to isolate specific proteins for further study. Brain tissue extraction and synaptic plasticity marker detection via microarray technology and surface plasmon resonance have provided valuable insights into the intricacies of neuronal function.
  • The market is marked by the adoption of advanced techniques like ELISA assays, immunohistochemistry, and synaptic protein assays. Neurotransmitter assays and neurodegenerative disease biomarker detection have gained traction, fueled by the need for protein quantification and neuroinflammation marker identification. Advancements in antibody conjugation, proteomic profiling, and monoclonal antibody production have expanded the scope of neuroscience research. Cell signaling pathways, synaptic plasticity, and neuroinflammation are increasingly being studied using high-throughput screening, flow cytometry analysis, and next-generation sequencing. Immunofluorescence microscopy, time-resolved fluorescence, and drug target identification techniques have further enriched the neuroscience antibodies and assays landscape, offering new avenues for understanding the complexities of the nervous system.

What are the Key Data Covered in this Neuroscience Antibodies and Assays Market Research and Growth Report?

  • What is the expected growth of the Neuroscience Antibodies and Assays Market between 2024 and 2028?

    • USD 2.20 billion, at a CAGR of 9.64%

  • What segmentation does the market report cover?

    • The report segmented by Type (Consumables and Instruments), Application (Drug Discovery and Development, Research, and In Vitro Diagnostics), Geography (North America, Europe, APAC, Outh America, and Middle East & AfricaRest of World (ROW)), Technology (Immunochemistry/Immunoassays, Molecular diagnostics, Clinical chemistry, and Others), and End-Users (Pharmaceutical and biopharmaceutical companies, Academic and research institutes, and Hospital and diagnostic centers)

  • Which regions are analyzed in the report?

    • North America, Europe, Asia, and Rest of World (ROW)

  • What are the key growth drivers and market challenges?

    • Increasing incidences of neurological disorders, High development cost of neuroscience antibodies

  • Who are the major players in the Neuroscience Antibodies and Assays Market?

    • Key Companies Abcam plc, Abnova Corp., Bio Rad Laboratories Inc., Biosensis Pty Ltd., BMG LABTECH GmbH, Cell Signaling Technology Inc., Chemie Brunschwig AG, Elabscience Biotechnology Inc., Enzo Biochem Inc., F. Hoffmann La Roche Ltd., Fujirebio Holdings Inc., GenScript Biotech Corp., Kaneka Corp., Merck KGaA, NSJ Bioreagents, PerkinElmer Inc., Proteintech Group Inc., Rockland Immunochemicals Inc., Santa Cruz Biotechnology Inc., and Thermo Fisher Scientific Inc.

Market Research Insights

  • The market encompasses a diverse range of tools essential for research and diagnostic applications in the field of neuroscience. This market is characterized by its continuous evolution, driven by advancements in assay sensitivity and specificity, as well as improvements in assay reproducibility. For instance, the sensitivity of in vitro assays has increased by 30% in the past decade, enabling the detection of lower antigen concentrations. Similarly, the specificity of primary antibody selection has improved by 25%, reducing cross-reactivity and increasing assay accuracy. Quality control procedures, including sample preparation methods and blocking buffer selection, play a crucial role in ensuring assay reliability.
  • High-content screening and statistical analysis methods facilitate data interpretation and enable large-scale analysis. Tissue-based and cell-based assays, as well as in vitro and in vivo assays, cater to various research applications. Signal amplification techniques and experimental design optimization further enhance assay performance. Clinical applications, including diagnostic and therapeutic uses, are expanding, with diagnostic applications accounting for 40% of the market share. Image analysis software and animal models are integral components of this market, enabling data normalization and accurate data interpretation. Antibody purification and detection system selection are critical factors in assay performance and require careful consideration.

We can help! Our analysts can customize this neuroscience antibodies and assays market research report to meet your requirements.

Get in touch

1 Executive Summary

  • 1.1 Market overview
    • Exhibit 01: Executive Summary – Chart on Market Overview
    • Exhibit 02: Executive Summary – Data Table on Market Overview
    • Exhibit 03: Executive Summary – Chart on Global Market Characteristics
    • Exhibit 04: Executive Summary – Chart on Market by Geography
    • Exhibit 05: Executive Summary – Chart on Market Segmentation by Type
    • Exhibit 06: Executive Summary – Chart on Market Segmentation by Application
    • Exhibit 07: Executive Summary – Chart on Incremental Growth
    • Exhibit 08: Executive Summary – Data Table on Incremental Growth
    • Exhibit 09: Executive Summary – Chart on Vendor Market Positioning

2 Market Landscape

  • 2.1 Market ecosystem
    • Exhibit 10: Parent market
    • Exhibit 11: Market Characteristics

3 Market Sizing

  • 3.1 Market definition
    • Exhibit 12: Offerings of vendors included in the market definition
  • 3.2 Market segment analysis
    • Exhibit 13: Market segments
  • 3.3 Market size 2023
    • 3.4 Market outlook: Forecast for 2023-2028
      • Exhibit 14: Chart on Global - Market size and forecast 2023-2028 ($ million)
      • Exhibit 15: Data Table on Global - Market size and forecast 2023-2028 ($ million)
      • Exhibit 16: Chart on Global Market: Year-over-year growth 2023-2028 (%)
      • Exhibit 17: Data Table on Global Market: Year-over-year growth 2023-2028 (%)

    4 Historic Market Size

    • 4.1 Global neuroscience antibodies and assays market 2018 - 2022
      • Exhibit 18: Historic Market Size – Data Table on global neuroscience antibodies and assays market 2018 - 2022 ($ million)
    • 4.2 Type Segment Analysis 2018 - 2022
      • Exhibit 19: Historic Market Size – Type Segment 2018 - 2022 ($ million)
    • 4.3 Application Segment Analysis 2018 - 2022
      • Exhibit 20: Historic Market Size – Application Segment 2018 - 2022 ($ million)
    • 4.4 Geography Segment Analysis 2018 - 2022
      • Exhibit 21: Historic Market Size – Geography Segment 2018 - 2022 ($ million)
    • 4.5 Country Segment Analysis 2018 - 2022
      • Exhibit 22: Historic Market Size – Country Segment 2018 - 2022 ($ million)

    5 Five Forces Analysis

    • 5.1 Five forces summary
      • Exhibit 23: Five forces analysis - Comparison between 2023 and 2028
    • 5.2 Bargaining power of buyers
      • Exhibit 24: Chart on Bargaining power of buyers – Impact of key factors 2023 and 2028
    • 5.3 Bargaining power of suppliers
      • Exhibit 25: Bargaining power of suppliers – Impact of key factors in 2023 and 2028
    • 5.4 Threat of new entrants
      • Exhibit 26: Threat of new entrants – Impact of key factors in 2023 and 2028
    • 5.5 Threat of substitutes
      • Exhibit 27: Threat of substitutes – Impact of key factors in 2023 and 2028
    • 5.6 Threat of rivalry
      • Exhibit 28: Threat of rivalry – Impact of key factors in 2023 and 2028
    • 5.7 Market condition
      • Exhibit 29: Chart on Market condition - Five forces 2023 and 2028

    6 Market Segmentation by Type

    • 6.1 Market segments
      • Chart on Type - Market share (2023-2028) (%)
      • Data Table on Type - Market share (2023-2028) (%)
    • 6.2 Comparison by Type
      • Chart on Comparison by Type
      • Data Table on Comparison by Type
    • 6.3 Consumables - Market size and forecast (2023-2028)
      • Chart on Consumables - Market size and forecast (2023-2028) ($ million)
      • Data Table on Consumables - Market size and forecast (2023-2028) ($ million)
      • Chart on Consumables - Year-over-year growth (2023-2028) (%)
      • Data Table on Consumables - Year-over-year growth (2023-2028) (%)
    • 6.4 Instruments - Market size and forecast (2023-2028)
      • Chart on Instruments - Market size and forecast (2023-2028) ($ million)
      • Data Table on Instruments - Market size and forecast (2023-2028) ($ million)
      • Chart on Instruments - Year-over-year growth (2023-2028) (%)
      • Data Table on Instruments - Year-over-year growth (2023-2028) (%)
    • 6.5 Market opportunity by Type
      • Market opportunity by Type ($ million)
      • Data Table on Market opportunity by Type ($ million)

    7 Market Segmentation by Application

    • 7.1 Market segments
      • Chart on Application - Market share (2023-2028) (%)
      • Data Table on Application - Market share (2023-2028) (%)
    • 7.2 Comparison by Application
      • Chart on Comparison by Application
      • Data Table on Comparison by Application
    • 7.3 Drug Discovery and Development - Market size and forecast (2023-2028)
      • Chart on Drug Discovery and Development - Market size and forecast (2023-2028) ($ million)
      • Data Table on Drug Discovery and Development - Market size and forecast (2023-2028) ($ million)
      • Chart on Drug Discovery and Development - Year-over-year growth (2023-2028) (%)
      • Data Table on Drug Discovery and Development - Year-over-year growth (2023-2028) (%)
    • 7.4 Research - Market size and forecast (2023-2028)
      • Chart on Research - Market size and forecast (2023-2028) ($ million)
      • Data Table on Research - Market size and forecast (2023-2028) ($ million)
      • Chart on Research - Year-over-year growth (2023-2028) (%)
      • Data Table on Research - Year-over-year growth (2023-2028) (%)
    • 7.5 In Vitro Diagnostics - Market size and forecast (2023-2028)
      • Chart on In Vitro Diagnostics - Market size and forecast (2023-2028) ($ million)
      • Data Table on In Vitro Diagnostics - Market size and forecast (2023-2028) ($ million)
      • Chart on In Vitro Diagnostics - Year-over-year growth (2023-2028) (%)
      • Data Table on In Vitro Diagnostics - Year-over-year growth (2023-2028) (%)
    • 7.6 Market opportunity by Application
      • Market opportunity by Application ($ million)
      • Data Table on Market opportunity by Application ($ million)

    8 Market Segmentation by Technology

    • 8.1 Market segments
      • Chart on Technology - Market share (2023-2028) (%)
      • Data Table on Technology - Market share (2023-2028) (%)
    • 8.2 Comparison by Technology
      • Chart on Comparison by Technology
      • Data Table on Comparison by Technology
    • 8.3 Immunochemistry/Immunoassays - Market size and forecast (2023-2028)
      • Chart on Immunochemistry/Immunoassays - Market size and forecast (2023-2028) ($ million)
      • Data Table on Immunochemistry/Immunoassays - Market size and forecast (2023-2028) ($ million)
      • Chart on Immunochemistry/Immunoassays - Year-over-year growth (2023-2028) (%)
      • Data Table on Immunochemistry/Immunoassays - Year-over-year growth (2023-2028) (%)
    • 8.4 Molecular diagnostics - Market size and forecast (2023-2028)
      • Chart on Molecular diagnostics - Market size and forecast (2023-2028) ($ million)
      • Data Table on Molecular diagnostics - Market size and forecast (2023-2028) ($ million)
      • Chart on Molecular diagnostics - Year-over-year growth (2023-2028) (%)
      • Data Table on Molecular diagnostics - Year-over-year growth (2023-2028) (%)
    • 8.5 Clinical chemistry - Market size and forecast (2023-2028)
      • Chart on Clinical chemistry - Market size and forecast (2023-2028) ($ million)
      • Data Table on Clinical chemistry - Market size and forecast (2023-2028) ($ million)
      • Chart on Clinical chemistry - Year-over-year growth (2023-2028) (%)
      • Data Table on Clinical chemistry - Year-over-year growth (2023-2028) (%)
    • 8.6 Others - Market size and forecast (2023-2028)
      • Chart on Others - Market size and forecast (2023-2028) ($ million)
      • Data Table on Others - Market size and forecast (2023-2028) ($ million)
      • Chart on Others - Year-over-year growth (2023-2028) (%)
      • Data Table on Others - Year-over-year growth (2023-2028) (%)
    • 8.7 Market opportunity by Technology
      • Market opportunity by Technology ($ million)
      • Data Table on Market opportunity by Technology ($ million)

    9 Market Segmentation by End-Users

    • 9.1 Market segments
      • Chart on End-Users - Market share (2023-2028) (%)
      • Data Table on End-Users - Market share (2023-2028) (%)
    • 9.2 Comparison by End-Users
      • Chart on Comparison by End-Users
      • Data Table on Comparison by End-Users
    • 9.3 Pharmaceutical and biopharmaceutical companies - Market size and forecast (2023-2028)
      • Chart on Pharmaceutical and biopharmaceutical companies - Market size and forecast (2023-2028) ($ million)
      • Data Table on Pharmaceutical and biopharmaceutical companies - Market size and forecast (2023-2028) ($ million)
      • Chart on Pharmaceutical and biopharmaceutical companies - Year-over-year growth (2023-2028) (%)
      • Data Table on Pharmaceutical and biopharmaceutical companies - Year-over-year growth (2023-2028) (%)
    • 9.4 Academic and research institutes - Market size and forecast (2023-2028)
      • Chart on Academic and research institutes - Market size and forecast (2023-2028) ($ million)
      • Data Table on Academic and research institutes - Market size and forecast (2023-2028) ($ million)
      • Chart on Academic and research institutes - Year-over-year growth (2023-2028) (%)
      • Data Table on Academic and research institutes - Year-over-year growth (2023-2028) (%)
    • 9.5 Hospital and diagnostic centers - Market size and forecast (2023-2028)
      • Chart on Hospital and diagnostic centers - Market size and forecast (2023-2028) ($ million)
      • Data Table on Hospital and diagnostic centers - Market size and forecast (2023-2028) ($ million)
      • Chart on Hospital and diagnostic centers - Year-over-year growth (2023-2028) (%)
      • Data Table on Hospital and diagnostic centers - Year-over-year growth (2023-2028) (%)
    • 9.6 Market opportunity by End-Users
      • Market opportunity by End-Users ($ million)
      • Data Table on Market opportunity by End-Users ($ million)

    8 Customer Landscape

    • 8.1 Customer landscape overview
      • Exhibit 62: Analysis of price sensitivity, lifecycle, customer purchase basket, adoption rates, and purchase criteria

    9 Geographic Landscape

    • 9.1 Geographic segmentation
      • Exhibit 63: Chart on Market share by geography 2023-2028 (%)
      • Exhibit 64: Data Table on Market share by geography 2023-2028 (%)
    • 9.2 Geographic comparison
      • Exhibit 65: Chart on Geographic comparison
      • Exhibit 66: Data Table on Geographic comparison
    • 9.3 North America - Market size and forecast 2023-2028
      • Exhibit 67: Chart on North America - Market size and forecast 2023-2028 ($ million)
      • Exhibit 68: Data Table on North America - Market size and forecast 2023-2028 ($ million)
      • Exhibit 69: Chart on North America - Year-over-year growth 2023-2028 (%)
      • Exhibit 70: Data Table on North America - Year-over-year growth 2023-2028 (%)
    • 9.4 Europe - Market size and forecast 2023-2028
      • Exhibit 71: Chart on Europe - Market size and forecast 2023-2028 ($ million)
      • Exhibit 72: Data Table on Europe - Market size and forecast 2023-2028 ($ million)
      • Exhibit 73: Chart on Europe - Year-over-year growth 2023-2028 (%)
      • Exhibit 74: Data Table on Europe - Year-over-year growth 2023-2028 (%)
    • 9.5 Asia - Market size and forecast 2023-2028
      • Exhibit 75: Chart on Asia - Market size and forecast 2023-2028 ($ million)
      • Exhibit 76: Data Table on Asia - Market size and forecast 2023-2028 ($ million)
      • Exhibit 77: Chart on Asia - Year-over-year growth 2023-2028 (%)
      • Exhibit 78: Data Table on Asia - Year-over-year growth 2023-2028 (%)
    • 9.6 Rest of World (ROW) - Market size and forecast 2023-2028
      • Exhibit 79: Chart on Rest of World (ROW) - Market size and forecast 2023-2028 ($ million)
      • Exhibit 80: Data Table on Rest of World (ROW) - Market size and forecast 2023-2028 ($ million)
      • Exhibit 81: Chart on Rest of World (ROW) - Year-over-year growth 2023-2028 (%)
      • Exhibit 82: Data Table on Rest of World (ROW) - Year-over-year growth 2023-2028 (%)
    • 9.7 US - Market size and forecast 2023-2028
      • Exhibit 83: Chart on US - Market size and forecast 2023-2028 ($ million)
      • Exhibit 84: Data Table on US - Market size and forecast 2023-2028 ($ million)
      • Exhibit 85: Chart on US - Year-over-year growth 2023-2028 (%)
      • Exhibit 86: Data Table on US - Year-over-year growth 2023-2028 (%)
    • 9.8 Germany - Market size and forecast 2023-2028
      • Exhibit 87: Chart on Germany - Market size and forecast 2023-2028 ($ million)
      • Exhibit 88: Data Table on Germany - Market size and forecast 2023-2028 ($ million)
      • Exhibit 89: Chart on Germany - Year-over-year growth 2023-2028 (%)
      • Exhibit 90: Data Table on Germany - Year-over-year growth 2023-2028 (%)
    • 9.9 China - Market size and forecast 2023-2028
      • Exhibit 91: Chart on China - Market size and forecast 2023-2028 ($ million)
      • Exhibit 92: Data Table on China - Market size and forecast 2023-2028 ($ million)
      • Exhibit 93: Chart on China - Year-over-year growth 2023-2028 (%)
      • Exhibit 94: Data Table on China - Year-over-year growth 2023-2028 (%)
    • 9.10 UK - Market size and forecast 2023-2028
      • Exhibit 95: Chart on UK - Market size and forecast 2023-2028 ($ million)
      • Exhibit 96: Data Table on UK - Market size and forecast 2023-2028 ($ million)
      • Exhibit 97: Chart on UK - Year-over-year growth 2023-2028 (%)
      • Exhibit 98: Data Table on UK - Year-over-year growth 2023-2028 (%)
    • 9.11 France - Market size and forecast 2023-2028
      • Exhibit 99: Chart on France - Market size and forecast 2023-2028 ($ million)
      • Exhibit 100: Data Table on France - Market size and forecast 2023-2028 ($ million)
      • Exhibit 101: Chart on France - Year-over-year growth 2023-2028 (%)
      • Exhibit 102: Data Table on France - Year-over-year growth 2023-2028 (%)
    • 9.12 Market opportunity by geography
      • Exhibit 103: Market opportunity by geography ($ million)
      • Exhibit 104: Data Tables on Market opportunity by geography ($ million)
    • 11.13 Canada - Market size and forecast (2023-2028)
      • Chart on Canada - Market size and forecast (2023-2028) ($ million)
      • Data Table on Canada - Market size and forecast (2023-2028) ($ million)
      • Chart on Canada - Year-over-year growth (2023-2028) (%)
      • Data Table on Canada - Year-over-year growth (2023-2028) (%)
    • 11.14 Italy - Market size and forecast (2023-2028)
      • Chart on Italy - Market size and forecast (2023-2028) ($ million)
      • Data Table on Italy - Market size and forecast (2023-2028) ($ million)
      • Chart on Italy - Year-over-year growth (2023-2028) (%)
      • Data Table on Italy - Year-over-year growth (2023-2028) (%)
    • 11.15 India - Market size and forecast (2023-2028)
      • Chart on India - Market size and forecast (2023-2028) ($ million)
      • Data Table on India - Market size and forecast (2023-2028) ($ million)
      • Chart on India - Year-over-year growth (2023-2028) (%)
      • Data Table on India - Year-over-year growth (2023-2028) (%)
    • 11.16 Japan - Market size and forecast (2023-2028)
      • Chart on Japan - Market size and forecast (2023-2028) ($ million)
      • Data Table on Japan - Market size and forecast (2023-2028) ($ million)
      • Chart on Japan - Year-over-year growth (2023-2028) (%)
      • Data Table on Japan - Year-over-year growth (2023-2028) (%)
    • 11.17 Brazil - Market size and forecast (2023-2028)
      • Chart on Brazil - Market size and forecast (2023-2028) ($ million)
      • Data Table on Brazil - Market size and forecast (2023-2028) ($ million)
      • Chart on Brazil - Year-over-year growth (2023-2028) (%)
      • Data Table on Brazil - Year-over-year growth (2023-2028) (%)
    • 11.18 Egypt - Market size and forecast (2023-2028)
      • Chart on Egypt - Market size and forecast (2023-2028) ($ million)
      • Data Table on Egypt - Market size and forecast (2023-2028) ($ million)
      • Chart on Egypt - Year-over-year growth (2023-2028) (%)
      • Data Table on Egypt - Year-over-year growth (2023-2028) (%)
    • 11.19 UAE - Market size and forecast (2023-2028)
      • Chart on UAE - Market size and forecast (2023-2028) ($ million)
      • Data Table on UAE - Market size and forecast (2023-2028) ($ million)
      • Chart on UAE - Year-over-year growth (2023-2028) (%)
      • Data Table on UAE - Year-over-year growth (2023-2028) (%)
    • 11.20 Oman - Market size and forecast (2023-2028)
      • Chart on Oman - Market size and forecast (2023-2028) ($ million)
      • Data Table on Oman - Market size and forecast (2023-2028) ($ million)
      • Chart on Oman - Year-over-year growth (2023-2028) (%)
      • Data Table on Oman - Year-over-year growth (2023-2028) (%)
    • 11.21 Argentina - Market size and forecast (2023-2028)
      • Chart on Argentina - Market size and forecast (2023-2028) ($ million)
      • Data Table on Argentina - Market size and forecast (2023-2028) ($ million)
      • Chart on Argentina - Year-over-year growth (2023-2028) (%)
      • Data Table on Argentina - Year-over-year growth (2023-2028) (%)
    • 11.22 KSA - Market size and forecast (2023-2028)
      • Chart on KSA - Market size and forecast (2023-2028) ($ million)
      • Data Table on KSA - Market size and forecast (2023-2028) ($ million)
      • Chart on KSA - Year-over-year growth (2023-2028) (%)
      • Data Table on KSA - Year-over-year growth (2023-2028) (%)

    10 Drivers, Challenges, and Trends

    • 10.1 Market drivers
      • 10.2 Market challenges
        • 10.3 Impact of drivers and challenges
          • Exhibit 105: Impact of drivers and challenges in 2023 and 2028
        • 10.4 Market trends

          11 Vendor Landscape

          • 11.1 Overview
            • 11.2 Vendor landscape
              • Exhibit 106: Overview on Criticality of inputs and Factors of differentiation
            • 11.3 Landscape disruption
              • Exhibit 107: Overview on factors of disruption
            • 11.4 Industry risks
              • Exhibit 108: Impact of key risks on business

            12 Vendor Analysis

            • 12.1 Vendors covered
              • Exhibit 109: Vendors covered
            • 12.2 Market positioning of vendors
              • Exhibit 110: Matrix on vendor position and classification
            • 12.3 Abcam plc
              • Exhibit 111: Abcam plc - Overview
              • Exhibit 112: Abcam plc - Product / Service
              • Exhibit 113: Abcam plc - Key news
              • Exhibit 114: Abcam plc - Key offerings
            • 12.4 Abnova Corp.
              • Exhibit 115: Abnova Corp. - Overview
              • Exhibit 116: Abnova Corp. - Product / Service
              • Exhibit 117: Abnova Corp. - Key offerings
            • 12.5 Bio Rad Laboratories Inc.
              • Exhibit 118: Bio Rad Laboratories Inc. - Overview
              • Exhibit 119: Bio Rad Laboratories Inc. - Business segments
              • Exhibit 120: Bio Rad Laboratories Inc. - Key news
              • Exhibit 121: Bio Rad Laboratories Inc. - Key offerings
              • Exhibit 122: Bio Rad Laboratories Inc. - Segment focus
            • 12.6 BMG LABTECH GmbH
              • Exhibit 123: BMG LABTECH GmbH - Overview
              • Exhibit 124: BMG LABTECH GmbH - Product / Service
              • Exhibit 125: BMG LABTECH GmbH - Key offerings
            • 12.7 Cell Signaling Technology Inc.
              • Exhibit 126: Cell Signaling Technology Inc. - Overview
              • Exhibit 127: Cell Signaling Technology Inc. - Product / Service
              • Exhibit 128: Cell Signaling Technology Inc. - Key offerings
            • 12.8 Chemie Brunschwig AG
              • Exhibit 129: Chemie Brunschwig AG - Overview
              • Exhibit 130: Chemie Brunschwig AG - Product / Service
              • Exhibit 131: Chemie Brunschwig AG - Key offerings
            • 12.9 Elabscience Biotechnology Inc.
              • Exhibit 132: Elabscience Biotechnology Inc. - Overview
              • Exhibit 133: Elabscience Biotechnology Inc. - Product / Service
              • Exhibit 134: Elabscience Biotechnology Inc. - Key offerings
            • 12.10 F. Hoffmann La Roche Ltd.
              • Exhibit 135: F. Hoffmann La Roche Ltd. - Overview
              • Exhibit 136: F. Hoffmann La Roche Ltd. - Business segments
              • Exhibit 137: F. Hoffmann La Roche Ltd. - Key news
              • Exhibit 138: F. Hoffmann La Roche Ltd. - Key offerings
              • Exhibit 139: F. Hoffmann La Roche Ltd. - Segment focus
            • 12.11 Fujirebio Holdings Inc.
              • Exhibit 140: Fujirebio Holdings Inc. - Overview
              • Exhibit 141: Fujirebio Holdings Inc. - Product / Service
              • Exhibit 142: Fujirebio Holdings Inc. - Key offerings
            • 12.12 GenScript Biotech Corp.
              • Exhibit 143: GenScript Biotech Corp. - Overview
              • Exhibit 144: GenScript Biotech Corp. - Business segments
              • Exhibit 145: GenScript Biotech Corp. - Key news
              • Exhibit 146: GenScript Biotech Corp. - Key offerings
              • Exhibit 147: GenScript Biotech Corp. - Segment focus
            • 12.13 Merck KGaA
              • Exhibit 148: Merck KGaA - Overview
              • Exhibit 149: Merck KGaA - Business segments
              • Exhibit 150: Merck KGaA - Key news
              • Exhibit 151: Merck KGaA - Key offerings
              • Exhibit 152: Merck KGaA - Segment focus
            • 12.14 PerkinElmer Inc.
              • Exhibit 153: PerkinElmer Inc. - Overview
              • Exhibit 154: PerkinElmer Inc. - Business segments
              • Exhibit 155: PerkinElmer Inc. - Key news
              • Exhibit 156: PerkinElmer Inc. - Key offerings
              • Exhibit 157: PerkinElmer Inc. - Segment focus
            • 12.15 Rockland Immunochemicals Inc.
              • Exhibit 158: Rockland Immunochemicals Inc. - Overview
              • Exhibit 159: Rockland Immunochemicals Inc. - Product / Service
              • Exhibit 160: Rockland Immunochemicals Inc. - Key offerings
            • 12.16 Santa Cruz Biotechnology Inc.
              • Exhibit 161: Santa Cruz Biotechnology Inc. - Overview
              • Exhibit 162: Santa Cruz Biotechnology Inc. - Product / Service
              • Exhibit 163: Santa Cruz Biotechnology Inc. - Key offerings
            • 12.17 Thermo Fisher Scientific Inc.
              • Exhibit 164: Thermo Fisher Scientific Inc. - Overview
              • Exhibit 165: Thermo Fisher Scientific Inc. - Business segments
              • Exhibit 166: Thermo Fisher Scientific Inc. - Key news
              • Exhibit 167: Thermo Fisher Scientific Inc. - Key offerings
              • Exhibit 168: Thermo Fisher Scientific Inc. - Segment focus

            13 Appendix

            • 13.1 Scope of the report
              • 13.2 Inclusions and exclusions checklist
                • Exhibit 169: Inclusions checklist
                • Exhibit 170: Exclusions checklist
              • 13.3 Currency conversion rates for US$
                • Exhibit 171: Currency conversion rates for US$
              • 13.4 Research methodology
                • Exhibit 172: Research methodology
                • Exhibit 173: Validation techniques employed for market sizing
                • Exhibit 174: Information sources
              • 13.5 List of abbreviations
                • Exhibit 175: List of abbreviations

              Research Methodology

              Technavio presents a detailed picture of the market by way of study, synthesis, and summation of data from multiple sources. The analysts have presented the various facets of the market with a particular focus on identifying the key industry influencers. The data thus presented is comprehensive, reliable, and the result of extensive research, both primary and secondary.

              INFORMATION SOURCES

              Primary sources

              • Manufacturers and suppliers
              • Channel partners
              • Industry experts
              • Strategic decision makers

              Secondary sources

              • Industry journals and periodicals
              • Government data
              • Financial reports of key industry players
              • Historical data
              • Press releases

              DATA ANALYSIS

              Data Synthesis

              • Collation of data
              • Estimation of key figures
              • Analysis of derived insights

              Data Validation

              • Triangulation with data models
              • Reference against proprietary databases
              • Corroboration with industry experts

              REPORT WRITING

              Qualitative

              • Market drivers
              • Market challenges
              • Market trends
              • Five forces analysis

              Quantitative

              • Market size and forecast
              • Market segmentation
              • Geographical insights
              • Competitive landscape

              Interested in this report?

              Get your sample now to see our research methodology and insights!

              Download Now

              Frequently Asked Questions

              Neuroscience Antibodies and Assays market growth will increase by $ 2.20 bn during 2024-2028 .

              The Neuroscience Antibodies and Assays market is expected to grow at a CAGR of 9.64% during 2024-2028 .

              Neuroscience Antibodies and Assays market is segmented by Type( Consumables, Instruments) Application( Drug Discovery and Development, Research, In Vitro Diagnostics)

              Abcam plc, Abnova Corp., Bio Rad Laboratories Inc., Biosensis Pty Ltd., BMG LABTECH GmbH, Cell Signaling Technology Inc., Chemie Brunschwig AG, Elabscience Biotechnology Inc., Enzo Biochem Inc., F. Hoffmann La Roche Ltd., Fujirebio Holdings Inc., GenScript Biotech Corp., Kaneka Corp., Merck KGaA, NSJ Bioreagents, PerkinElmer Inc., Proteintech Group Inc., Rockland Immunochemicals Inc., Santa Cruz Biotechnology Inc., Thermo Fisher Scientific Inc. are a few of the key vendors in the Neuroscience Antibodies and Assays market.

              North America will register the highest growth rate of 46% among the other regions. Therefore, the Neuroscience Antibodies and Assays market in North America is expected to garner significant business opportunities for the vendors during the forecast period.

              US, Canada, Germany, UK, Italy, France, China, India, Japan, Brazil, Egypt, UAE, Oman, Argentina, KSA, UAE, Brazil, Rest of World (ROW)

              • Increasing incidences of neurological disordersPatients with a comprehensive range of neurological disorders is the driving factor this market.
              • including epilepsy is the driving factor this market.
              • stroke is the driving factor this market.
              • PD is the driving factor this market.
              • and brain tumors is the driving factor this market.
              • have a high risk of developing a disability. These disorders may also be fatal. These neurological disorders develop due to various factors such as bacterial and viral infections is the driving factor this market.
              • genetic factors is the driving factor this market.
              • and the lack of immune response. PD is one of the most common neurological diseases affecting the population. According to the Centers for Disease Control and Prevention (CDC) is the driving factor this market.
              • the prevalence of PD increases from 1% to 4% in the aging population of 60 years to 80 years. The prevalence of disease is more common among the geriatric population. According to the World Health Organization is the driving factor this market.
              • by 2030 is the driving factor this market.
              • one in every six people on the planet will be 60 years old or older. At this point is the driving factor this market.
              • the population aged 60 and up will increase from 1 billion in 2020 to 1.4 billion. By 2050 is the driving factor this market.
              • the world population of people aged 60 and up will have doubled (to 2.1 billion). Between 2020 and 2050 is the driving factor this market.
              • the number of people aged 80 and up is expected to triple is the driving factor this market.
              • reaching 426 million. According to The Lancet Global Health Report 2021 is the driving factor this market.
              • the burden of non-communicable neurological disorders is increasing in India is the driving factor this market.
              • mainly due to the aging of the population. Stroke is the driving factor this market.
              • headache disorders is the driving factor this market.
              • and epilepsy are the leading contributors to neurological disorders burden in India. Therefore is the driving factor this market.
              • factors such as the increasing incidence and prevalence of various neurological disorders and the growing demand for treating such disorders to save patients lives will contribute to the growth of the global neuroscience antibodies and assays market during the forecast period. Furthermore is the driving factor this market.
              • treating brain hemorrhage due to stroke and brain tumors is boosting the demand for neuroscience antibodies and assays. In September 2021 is the driving factor this market.
              • the CDC reported that every year is the driving factor this market.
              • 798 is the driving factor this market.
              • 000 people are affected by strokes in the US. A stroke can lead to malignant cerebral edema is the driving factor this market.
              • which leads to inadequate blood flow. This increases intracranial pressure and brain shift is the driving factor this market.
              • causing herniation syndrome and leading to brain death. These cases add to the demand for the diagnosis of brain injuries. Therefore is the driving factor this market.
              • the increase in the number of stroke cases is expected to boost the growth of the market in focus during the forecast period. is the driving factor this market.

              The Neuroscience Antibodies and Assays market vendors should focus on grabbing business opportunities from the Consumables segment as it accounted for the largest market share in the base year.