Non-cancerous Skin Diseases Therapeutics Market Size 2026-2030
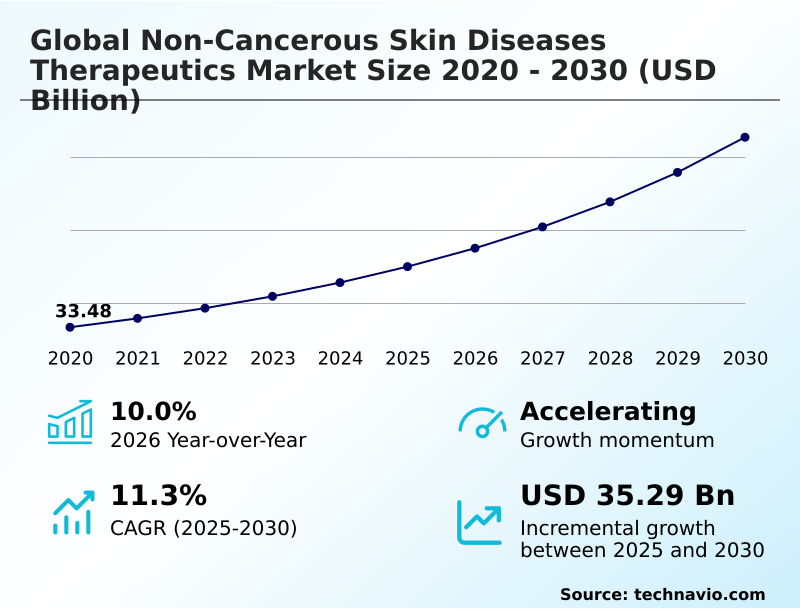
The non-cancerous skin diseases therapeutics market size is valued to increase by USD 35.29 billion, at a CAGR of 11.3% from 2025 to 2030. Rising global geriatric population and associated age-related dermatological vulnerabilities will drive the non-cancerous skin diseases therapeutics market.
Major Market Trends & Insights
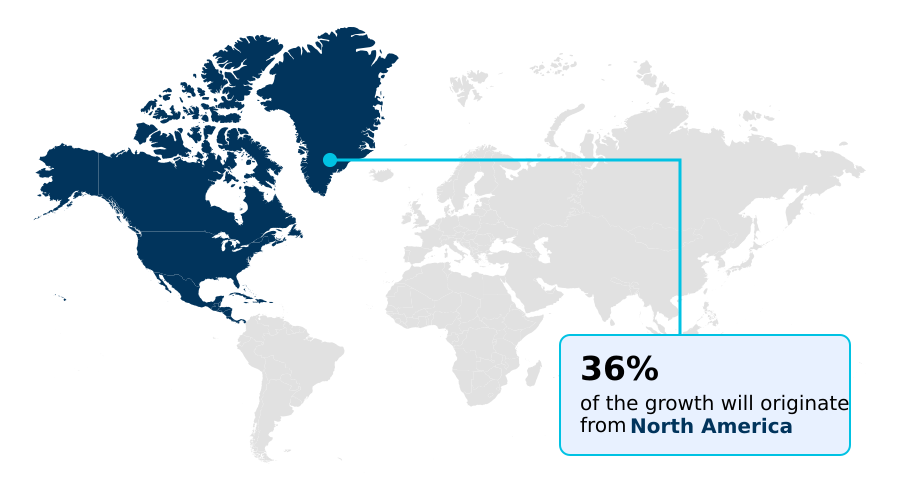
- North America dominated the market and accounted for a 35.9% growth during the forecast period.
- By Therapy Area - Psoriasis segment was valued at USD 17.36 billion in 2024
- By Route of Administration - Injectable segment accounted for the largest market revenue share in 2024
Market Size & Forecast
- Market Opportunities: USD 51.82 billion
- Market Future Opportunities: USD 35.29 billion
- CAGR from 2025 to 2030 : 11.3%
Market Summary
- The non-cancerous skin diseases therapeutics market is defined by a dynamic interplay of demographic shifts and scientific advancements. An aging global population presents a growing patient base susceptible to conditions requiring sustained intervention, driving demand for effective, low-toxicity solutions. Concurrently, heightened public awareness and improved diagnostic capabilities are expanding the patient pool seeking treatment.
- The therapeutic landscape is evolving from broad-spectrum agents to more precise treatments, such as targeted biologics and small-molecule inhibitors that modulate specific immune pathways. This innovation is supported by government initiatives and favorable reimbursement policies in key regions, which de-risk development and enhance patient access. However, this progress is moderated by significant challenges.
- For instance, a mid-sized biopharmaceutical firm developing a novel topical therapy may face a complex regulatory environment requiring extensive longitudinal safety data, delaying market entry by several years despite promising early-phase results.
- The high cost of advanced treatments and the need for robust, long-term safety data also create access barriers and fuel demand for cost-effective alternatives like biosimilars, shaping a market that must continuously balance innovation with accessibility and affordability.
What will be the Size of the Non-cancerous Skin Diseases Therapeutics Market during the forecast period?
Get Key Insights on Market Forecast (PDF) Get Free Sample
How is the Non-cancerous Skin Diseases Therapeutics Market Segmented?
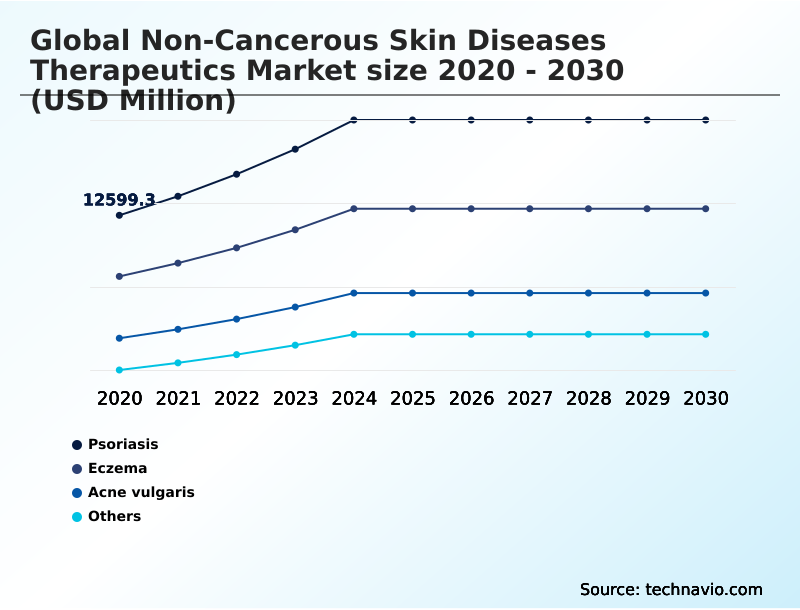
The non-cancerous skin diseases therapeutics industry research report provides comprehensive data (region-wise segment analysis), with forecasts and estimates in "USD million" for the period 2026-2030, as well as historical data from 2020-2024 for the following segments.
- Therapy area
- Psoriasis
- Eczema
- Acne vulgaris
- Others
- Route of administration
- Injectable
- Oral
- Topical
- End-user
- Hospitals
- Dermatology clinics
- Homecare
- Geography
- North America
- US
- Canada
- Mexico
- Europe
- Germany
- UK
- France
- Asia
- Rest of World (ROW)
- North America
By Therapy Area Insights
The psoriasis segment is estimated to witness significant growth during the forecast period.
The psoriasis segment represents a substantial share of the non-cancerous skin diseases therapeutics market, driven by the condition's chronic nature requiring long-term management.
The treatment paradigm has shifted from conventional topicals to highly targeted biologics, including monoclonal antibodies and interleukin pathway inhibitors that address specific cytokine signaling pathways.
The recent emergence of oral small molecules like Janus kinase (JAK) inhibitors offers a convenient alternative, impacting formulary management strategies.
While the R&D pipeline is robust, the high cost of these therapies presents reimbursement challenges, with health technology assessment bodies scrutinizing their value.
Real-world evidence (RWE) shows these advanced treatments can control keratinocyte proliferation with an over 75% improvement in patient-reported outcomes. This evolving landscape balances innovation against the pressures of value-based reimbursement models and therapeutic interchangeability.
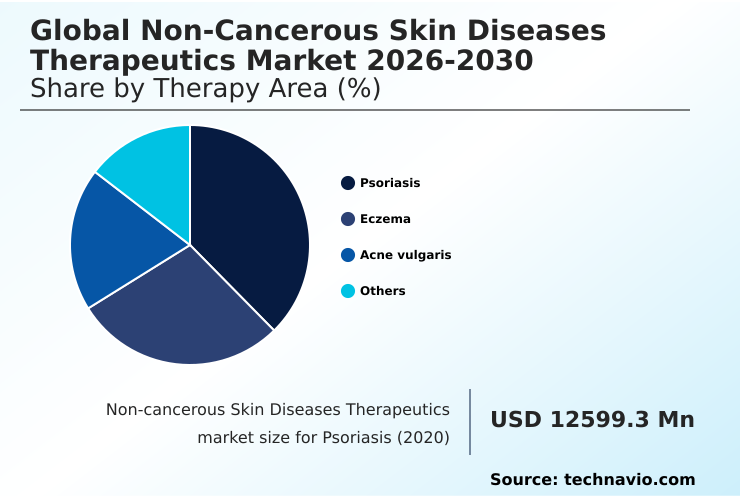
The Psoriasis segment was valued at USD 17.36 billion in 2024 and showed a gradual increase during the forecast period.
Regional Analysis
North America is estimated to contribute 35.9% to the growth of the global market during the forecast period.Technavio’s analysts have elaborately explained the regional trends and drivers that shape the market during the forecast period.
See How Non-cancerous Skin Diseases Therapeutics Market Demand is Rising in North America Get Free Sample
The geographic landscape of the non-cancerous skin diseases therapeutics market is diverse, with North America leading, accounting for over 35% of incremental growth. This maturity is driven by high adoption of advanced immunomodulatory drugs and robust patient support programs.
In contrast, Asia is the fastest-growing region, with a projected growth rate over 12%, fueled by improving healthcare access and demand for treatments addressing cutaneous barrier function.
However, challenges like high out-of-pocket expenditure and inconsistent cold-chain logistics for biologics temper growth in emerging markets. European markets emphasize cost-effectiveness, promoting systemic immunosuppressants and non-steroidal topical agents.
The use of teledermatology platforms is expanding globally, improving access to care and reducing clinic visits by 40% in some integrated systems, while expedited review pathways in several key countries accelerate the availability of new therapies.
Market Dynamics
Our researchers analyzed the data with 2025 as the base year, along with the key drivers, trends, and challenges. A holistic analysis of drivers will help companies refine their marketing strategies to gain a competitive advantage.
- Strategic decision-making in the non-cancerous skin diseases therapeutics market requires a granular understanding of diverse treatment paradigms. The debate over oral versus injectable psoriasis treatments continues, with patient preference and long-term safety of biologic therapies being key considerations.
- The efficacy of jak inhibitors for atopic dermatitis is setting new benchmarks, while research into topical treatments for acne vulgaris scarring addresses significant unmet needs. Concurrently, the cost-effectiveness of biosimilars in dermatology is reshaping market access, forcing a re-evaluation of pricing strategies.
- Technological integration is also pivotal; the use of teledermatology for rural patient diagnosis is expanding access, and the role of ai in diagnosing inflammatory skin disease is improving accuracy. Regulatory hurdles, such as gaining approval for vitiligo repigmentation therapies, remain a key focus.
- Clinicians are increasingly focused on managing systemic side effects of oral therapies and promoting antibiotic stewardship in acne management. The rise of personalized medicine in treating alopecia areata and the development of novel therapies for hidradenitis suppurativa and targeted treatments for rosacea erythema highlight a shift towards precision.
- Adherence solutions for chronic skin conditions are critical for improving patient-reported outcomes in clinical trials. As the market for pediatric atopic dermatitis treatment options grows, the impact of hta on market access and the development of therapeutic options for actinic keratosis and cutaneous squamous cell carcinoma adjuvants become more pronounced.
- For example, firms that have optimized supply chains for these specialized therapeutics have reported a reduction in fulfillment errors that is three times lower than those using generalized logistics. This operational efficiency is crucial for maintaining market position.
What are the key market drivers leading to the rise in the adoption of Non-cancerous Skin Diseases Therapeutics Industry?
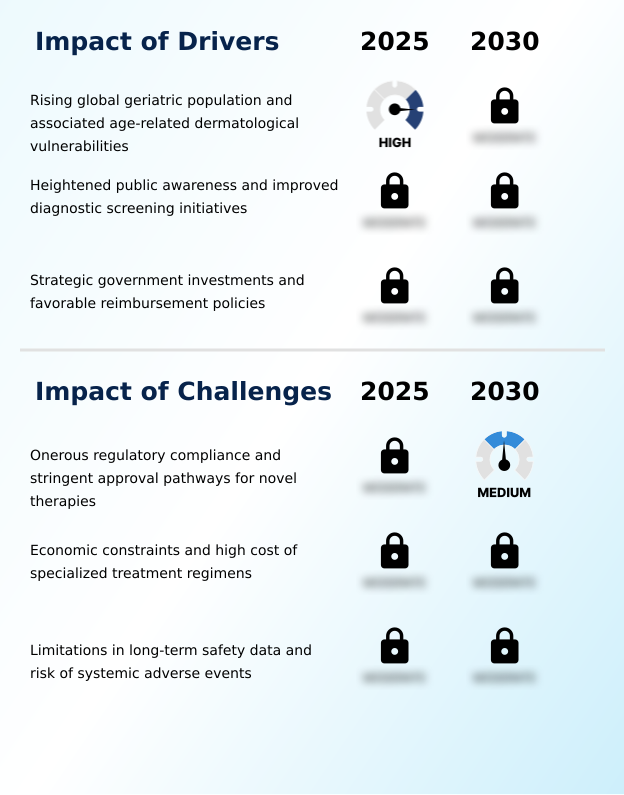
- A key driver for the market is the rising global geriatric population and the associated increase in age-related dermatological vulnerabilities.
- Market growth is significantly driven by demographic shifts and evolving healthcare policies.
- The aging global population, with distinct pharmacokinetics of older patients, creates sustained demand for treatments that support epidermal layer regeneration and cutaneous barrier function, such as advanced topical emollients.
- Heightened patient awareness and comprehensive patient support programs are increasing diagnosis rates, with targeted campaigns linked to a 15% rise in early specialist consultations. Favorable government initiatives, including expedited review pathways, are accelerating the availability of novel drugs.
- These pathways have been shown to reduce approval times by an average of six months.
- Furthermore, the adoption of value-based reimbursement models in several key markets is improving access, although health technology assessment (HTA) bodies continue to scrutinize long-term value, influencing which therapies are widely adopted.
What are the market trends shaping the Non-cancerous Skin Diseases Therapeutics Industry?
- The market is witnessing a significant trend toward the expansion of biologic and biosimilar interventions. This shift is particularly prominent for treating chronic inflammatory conditions.
- Key trends are reshaping the non-cancerous skin diseases therapeutics market, led by a pivot toward personalized medicine and digital health integration. The development of targeted biologic therapies and small molecules like phosphodiesterase-4 inhibitors, which act on specific intracellular signaling pathways, is central to this shift.
- This focus on precision is enhanced by biomarker testing for efficacy, which has been shown to improve treatment selection accuracy by over 25% in certain patient groups. Digital innovation is also critical, with companion digital therapeutics and real-time patient monitoring platforms driving better outcomes.
- For instance, integrated patient adherence technologies have demonstrated a 40% improvement in medication compliance for chronic conditions. New research into repigmentation therapy and sebaceous gland modulation further expands the scope of personalized treatment protocols.
What challenges does the Non-cancerous Skin Diseases Therapeutics Industry face during its growth?
- Industry growth is significantly challenged by onerous regulatory compliance requirements and the stringent approval pathways for novel therapies.
- The market faces significant challenges related to regulatory complexity, cost containment, and long-term safety validation. The stringent approval process for novel immunomodulatory drugs and small-molecule inhibitors often requires extensive real-world evidence (RWE), with post-market pharmacovigilance programs adding an average of 15% to total development costs. Payer-imposed prior authorization requirements for high-cost anti-inflammatory agents create treatment delays, impacting patient care.
- Furthermore, managing the complex cold-chain logistics for biologics can increase supply chain expenditures by up to 20% compared to conventional pharmaceuticals. While older systemic immunosuppressants have known long-term profiles, newer agents require substantial data generation to build clinician confidence, representing a key hurdle to broader adoption despite their targeted mechanisms.
Exclusive Technavio Analysis on Customer Landscape
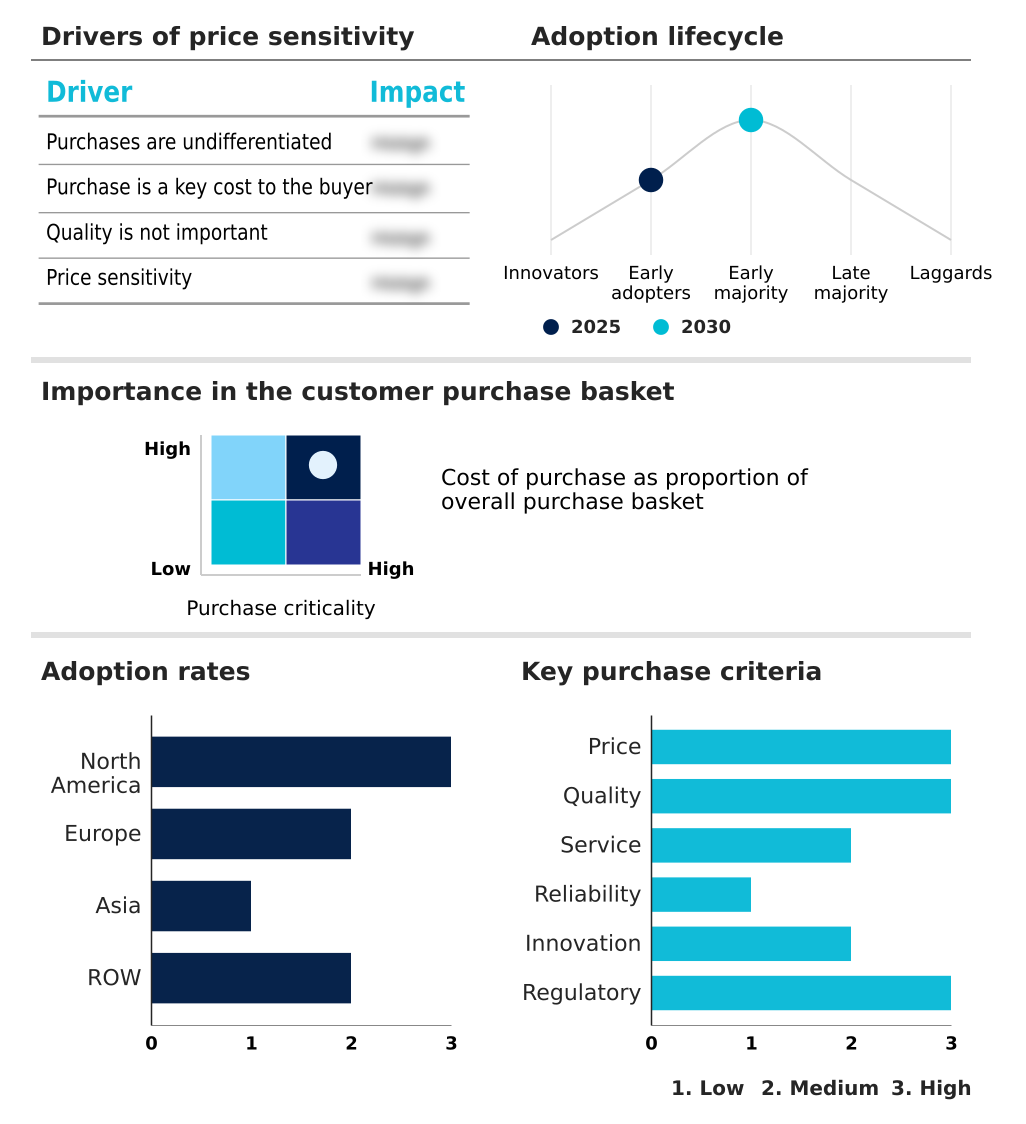
The non-cancerous skin diseases therapeutics market forecasting report includes the adoption lifecycle of the market, covering from the innovator’s stage to the laggard’s stage. It focuses on adoption rates in different regions based on penetration. Furthermore, the non-cancerous skin diseases therapeutics market report also includes key purchase criteria and drivers of price sensitivity to help companies evaluate and develop their market growth analysis strategies.
Customer Landscape of Non-cancerous Skin Diseases Therapeutics Industry
Competitive Landscape
Companies are implementing various strategies, such as strategic alliances, non-cancerous skin diseases therapeutics market forecast, partnerships, mergers and acquisitions, geographical expansion, and product/service launches, to enhance their presence in the industry.
AbbVie Inc. - Develops advanced therapeutics for non-cancerous skin diseases, including biologic drugs and targeted small-molecule inhibitors for chronic inflammatory conditions.
The industry research and growth report includes detailed analyses of the competitive landscape of the market and information about key companies, including:
- AbbVie Inc.
- Amgen Inc.
- AstraZeneca Plc
- Bayer AG
- Boehringer Ingelheim GmbH
- Bristol Myers Squibb Co.
- Eli Lilly and Co.
- F. Hoffmann La Roche Ltd.
- Galderma Group AG
- GlaxoSmithKline Plc
- Incyte Corp.
- Johnson and Johnson Services
- LEO Pharma AS
- Maruho Co. Ltd.
- Merck KGaA
- Novartis AG
- Pfizer Inc.
- Regeneron Pharmaceuticals Inc.
- Sanofi SA
- Sun Pharmaceutical Industries
Qualitative and quantitative analysis of companies has been conducted to help clients understand the wider business environment as well as the strengths and weaknesses of key industry players. Data is qualitatively analyzed to categorize companies as pure play, category-focused, industry-focused, and diversified; it is quantitatively analyzed to categorize companies as dominant, leading, strong, tentative, and weak.
Recent Development and News in Non-cancerous skin diseases therapeutics market
- In May, 2025, Brazil's National Health Surveillance Agency (ANVISA) partnered with the Brazilian Society of Dermatology to launch 'Pele Saudavel, Vida Plena,' a nationwide campaign to educate the public on the prevention and treatment of non-cancerous skin diseases.
- In March, 2025, AbbVie Inc. presented new data at the American Academy of Dermatology Annual Meeting reinforcing the efficacy and safety of its product, risankizumab, in treating psoriatic disease and shared real-world evidence on upadacitinib for atopic dermatitis.
- In February, 2025, Novartis AG showcased its immunology portfolio at the American Academy of Dermatology Annual Meeting with new findings for chronic spontaneous urticaria, hidradenitis suppurativa, and psoriasis, including data on remibrutinib and secukinumab.
- In January, 2025, Sanofi SA announced positive late-breaking phase 3 data for its investigational atopic dermatitis treatment, amlitelimab, supporting a less frequent dosing schedule and plans for global regulatory submissions.
Dive into Technavio’s robust research methodology, blending expert interviews, extensive data synthesis, and validated models for unparalleled Non-cancerous Skin Diseases Therapeutics Market insights. See full methodology.
| Market Scope | |
|---|---|
| Page number | 299 |
| Base year | 2025 |
| Historic period | 2020-2024 |
| Forecast period | 2026-2030 |
| Growth momentum & CAGR | Accelerate at a CAGR of 11.3% |
| Market growth 2026-2030 | USD 35287.3 million |
| Market structure | Fragmented |
| YoY growth 2025-2026(%) | 10.0% |
| Key countries | US, Canada, Mexico, Germany, UK, France, Italy, Spain, The Netherlands, China, India, Japan, South Korea, Indonesia, Thailand, Brazil, Saudi Arabia, UAE, Turkey, Argentina, Colombia, South Africa and Israel |
| Competitive landscape | Leading Companies, Market Positioning of Companies, Competitive Strategies, and Industry Risks |
Research Analyst Overview
- The non-cancerous skin diseases therapeutics market is advancing through a focus on targeted biological mechanisms and improved patient-centric solutions. The development of next-generation biologic therapies, including monoclonal antibodies and interleukin pathway inhibitors, which precisely target cytokine signaling pathways, represents a significant leap from traditional systemic immunosuppressants.
- Boardroom decisions are increasingly centered on the strategic development of oral small-molecule inhibitors, such as Janus kinase (JAK) inhibitors and phosphodiesterase-4 inhibitors, which offer convenience without compromising efficacy. Innovation extends to advanced topical emollients and non-steroidal topical agents that enhance cutaneous barrier function and epidermal layer regeneration.
- Research into immunomodulatory drugs and methods to control keratinocyte proliferation continues, with a focus on therapies for repigmentation and sebaceous gland modulation. The unique pharmacokinetics of older patients are a key consideration, as is the development of prescription digital therapeutics.
- Companies leveraging AI to model intracellular signaling have managed to shorten early-stage drug discovery phases by up to 20%, demonstrating a clear path to optimizing R&D investment in this competitive field.
What are the Key Data Covered in this Non-cancerous Skin Diseases Therapeutics Market Research and Growth Report?
-
What is the expected growth of the Non-cancerous Skin Diseases Therapeutics Market between 2026 and 2030?
-
USD 35.29 billion, at a CAGR of 11.3%
-
-
What segmentation does the market report cover?
-
The report is segmented by Therapy Area (Psoriasis, Eczema, Acne vulgaris, and Others), Route of Administration (Injectable, Oral, and Topical), End-user (Hospitals, Dermatology clinics, and Homecare) and Geography (North America, Europe, Asia, Rest of World (ROW))
-
-
Which regions are analyzed in the report?
-
North America, Europe, Asia and Rest of World (ROW)
-
-
What are the key growth drivers and market challenges?
-
Rising global geriatric population and associated age-related dermatological vulnerabilities, Onerous regulatory compliance and stringent approval pathways for novel therapies
-
-
Who are the major players in the Non-cancerous Skin Diseases Therapeutics Market?
-
AbbVie Inc., Amgen Inc., AstraZeneca Plc, Bayer AG, Boehringer Ingelheim GmbH, Bristol Myers Squibb Co., Eli Lilly and Co., F. Hoffmann La Roche Ltd., Galderma Group AG, GlaxoSmithKline Plc, Incyte Corp., Johnson and Johnson Services, LEO Pharma AS, Maruho Co. Ltd., Merck KGaA, Novartis AG, Pfizer Inc., Regeneron Pharmaceuticals Inc., Sanofi SA and Sun Pharmaceutical Industries
-
Market Research Insights
- The dynamics of the non-cancerous skin diseases therapeutics market are increasingly shaped by digital innovation and value-based care models. The adoption of teledermatology platforms, supported by machine learning diagnostics, is improving care delivery, with some systems demonstrating a 30% reduction in time-to-diagnosis for rural patients.
- These technologies facilitate real-time patient monitoring and the use of companion digital therapeutics to improve outcomes. Payers are implementing more sophisticated formulary management strategies and prior authorization requirements to control costs, placing greater emphasis on cost-benefit analysis for new therapies.
- Biomarker testing for efficacy is becoming crucial, as it supports personalized treatment protocols and can improve therapeutic success rates by up to 25% in select patient cohorts. This data-driven approach, coupled with a focus on patient adherence technologies, is central to navigating today's complex reimbursement landscape.
We can help! Our analysts can customize this non-cancerous skin diseases therapeutics market research report to meet your requirements.
 RIA -
RIA - 
