Non-Destructive Testing (NDT) Equipment Market Analysis, Size, and Forecast 2025-2029: North America (US and Canada), Europe (France, Germany, and UK), APAC (China, India, Japan, and South Korea), South America (Brazil), and Rest of World (ROW)

Non-Destructive Testing (NDT) Equipment Market Analysis, Size, and Forecast 2025-2029:
North America (US and Canada), Europe (France, Germany, and UK), APAC (China, India, Japan, and South Korea), South America (Brazil), and Rest of World (ROW)

Published: Jun 2025 231 Pages SKU: IRTNTR46591

Market Overview at a Glance

$950.5 Mn
Market Opportunity
6%
CAGR
5.6
YoY growth 2024-2025(%)

Non-Destructive Testing (NDT) Equipment Market Size 2025-2029

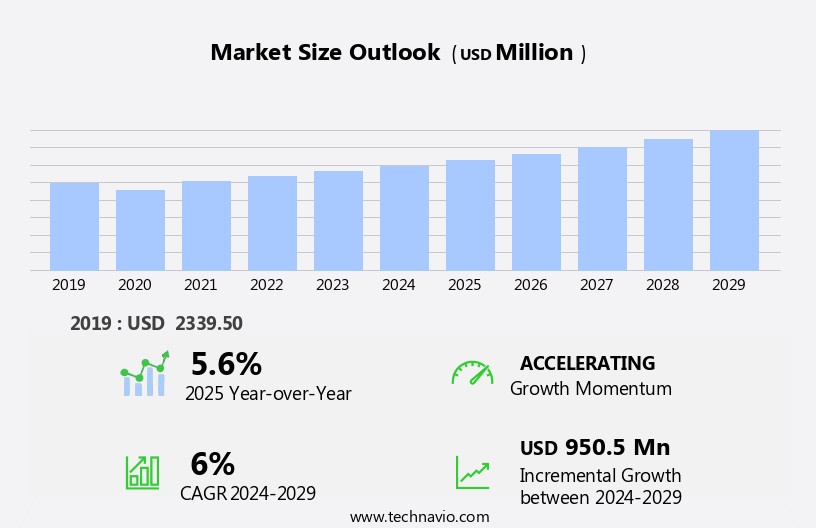
The non-destructive testing (NDT) equipment market size is forecast to increase by USD 950.5 million at a CAGR of 6% between 2024 and 2029.

  • The market is experiencing significant growth, driven primarily by the rise in oil and gas and power generation projects. This sector's expansion creates a substantial demand for advanced NDT technologies, particularly ultrasonic testing equipment. Another key trend shaping the market is the increasing availability of pre-used NDT equipment. In the power generation sector, there is a growing emphasis on safety and reliability, leading to increased adoption of NDT technologies for asset management and maintenance. This trend offers cost-effective solutions for companies seeking to invest in NDT technology without the high upfront costs associated with new equipment. However, the market faces challenges as well. One significant obstacle is the stringent regulations governing the use of NDT equipment in various industries.
  • Additionally, the market's competitive landscape is becoming increasingly crowded, with numerous players vying for market share. Companies must differentiate themselves through innovation, quality, and customer service to remain competitive. To capitalize on the market's opportunities and navigate these challenges effectively, companies should focus on continuous improvement, regulatory compliance, and customer satisfaction. Ensuring compliance with these regulations can be time-consuming and costly, requiring substantial resources and expertise. This trend is further fueled by the rise in crude oil prices, which is expected to drive investments in conventional oil and gas basins.

What will be the Size of the Non-Destructive Testing (NDT) Equipment Market during the forecast period?

Non-Destructive Testing (NDT) Equipment Market Size

 Explore in-depth regional segment analysis with market size data - historical 2019-2023 and forecasts 2025-2029 - in the full report.  
Request Free Sample

  • The market encompasses a range of solutions designed to ensure compliance assurance and risk mitigation in various industries. Consulting services play a crucial role in optimizing NDT processes, while software upgrades and automated NDT systems facilitate efficiency improvements and cost reduction. Global markets demand supply chain management solutions to streamline the procurement of NDT probes, engineering services, equipment rentals, and maintenance contracts. The market is experiencing significant growth, driven primarily by the increasing number of oil and gas and power generation projects worldwide.
  • Industry regulations mandate stringent safety standards, necessitating continuous process optimization and repair services. Overall, the NDT market is dynamic, with a focus on innovation and cost savings. Handheld and portable NDT equipment enable inspection personnel to conduct tests in remote locations, reducing downtime. Safety procedures and material science advancements drive the adoption of emerging technologies, such as phased array ultrasonic testing and eddy current testing.

How is this Non-Destructive Testing (NDT) Equipment Industry segmented?

The non-destructive testing (NDT) equipment industry research report provides comprehensive data (region-wise segment analysis), with forecasts and estimates in "USD million" for the period 2025-2029, as well as historical data from 2019-2023 for the following segments.

  • End-user
    • Oil and gas
    • Power generation
    • Aerospace and defense
    • Automotive and transportation
    • Others
  • Product Type
    • Ultrasonic testing equipment
    • Radiography testing equipment
    • Visual testing equipment
    • Others
  • Product
    • Portable equipment
    • Stationary equipment
    • Software solutions
  • Geography
    • North America
      • US
      • Canada
    • Europe
      • France
      • Germany
      • UK
    • APAC
      • China
      • India
      • Japan
      • South Korea
    • South America
      • Brazil
    • Rest of World (ROW)

By End-user Insights

The oil and gas segment is estimated to witness significant growth during the forecast period. Non-Destructive Testing (NDT) equipment plays a crucial role in ensuring the integrity and safety of various industries, particularly in energy applications such as oil and gas. In this sector, pipelines are a vital means of transporting oil and gas, making NDT essential for detecting defects, including corrosion and cracks. These issues can lead to severe consequences if left unchecked, such as pipeline leaks or ruptures. NDT techniques, including digital radiography, magnetic particle testing, and ultrasonic testing, are employed to identify and classify defects. Data analysis software and machine learning algorithms enable real-time radiography and predictive modeling, enhancing the efficiency and accuracy of inspections.

NDT software, including report generation software and data visualization tools, streamline the inspection process and facilitate informed decision-making. In the oil and gas sector, NDT is vital for pipeline inspection, with guided wave testing and crack detection techniques used to assess the structural integrity of pipelines. Leak testing and welding inspection are other essential applications. Neutron radiography and X-ray fluorescence are used for material characterization and corrosion detection. NDT is also used in non-energy applications, such as automotive and aerospace, for ensuring safety and quality. The NDT market is dynamic and evolving, driven by advancements in technology and the increasing demand for safety and efficiency in various industries.

NDT techniques, including digital radiography, magnetic particle testing, and ultrasonic testing, are essential for detecting defects and maintaining the integrity of critical infrastructure. Data analysis software, machine learning, and remote inspection technologies are transforming NDT, enabling real-time monitoring and predictive modeling. Regulatory compliance, training, and calibration services are crucial for maintaining the effectiveness of NDT equipment and techniques. A key trend in the market is the rising demand for ultrasonic testing equipment due to its versatility and ability to detect defects in various materials.

Non-Destructive Testing (NDT) Equipment Market Size

 Download Free Sample Report

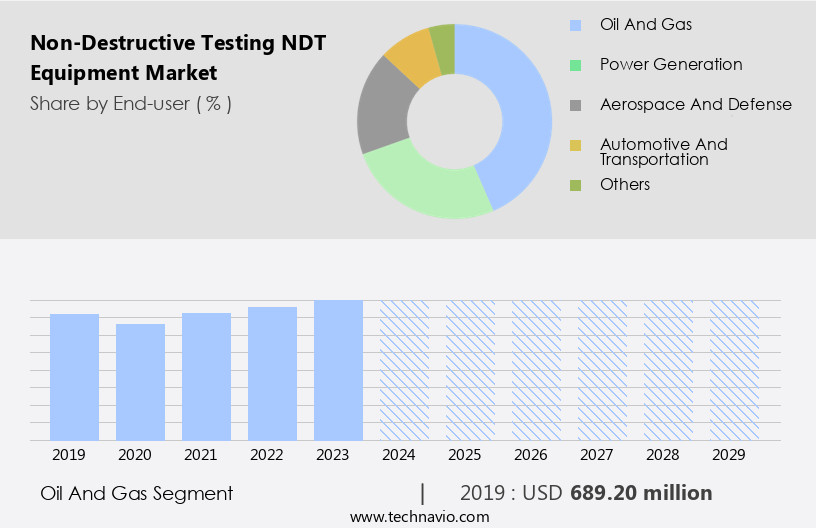
The Oil and gas segment was valued at USD 689.20 million in 2019 and showed a gradual increase during the forecast period.

NDT equipment is also integral to quality control and safety standards in manufacturing applications, aerospace, automotive, and construction industries. Remote inspection using sensor technology, such as electromagnetic acoustic transducers and acoustic emission testing, is increasingly popular for non-contact, real-time monitoring. Structural health monitoring using industrial computed tomography and dimensional inspection ensures the integrity of critical infrastructure. Big data and data analytics are transforming NDT, enabling advanced image processing and signal processing techniques. Training courses and calibration services ensure the continued effectiveness of NDT equipment and techniques. Regulatory compliance and asset integrity management are crucial aspects of NDT, ensuring safety and reliability.

Regional Analysis

APAC is estimated to contribute 39% to the growth of the global market during the forecast period. Technavio's analysts have elaborately explained the regional trends and drivers that shape the market during the forecast period.

Non-Destructive Testing (NDT) Equipment Market Share by Geography

View Free PDF Sample

The market in North America is experiencing significant growth, driven primarily by the robust presence of the oil and gas and aerospace industries in the region. The US, as a global leader in petroleum and natural gas production, continues to invest heavily in the upstream sector, including shale basins. The rise in crude oil prices is further fueling investments in conventional oil and gas basins, leading to increased demand for NDT equipment. In the aerospace sector, the focus on ensuring safety and quality control is driving the adoption of advanced NDT technologies such as digital radiography, time-of-flight diffraction, and phased array ultrasonic testing.

Energy applications are a major segment of the NDT market, with remote inspection and structural health monitoring being key areas of focus. Big data and data analytics play a crucial role in NDT, enabling real-time radiography, predictive modeling, and defect classification. Advanced sensor technology, including electromagnetic acoustic transducers and acoustic emission testing, are also gaining popularity for their ability to detect flaws in real-time. Manufacturing applications, including leak testing, welding inspection, and dimensional inspection, are other significant segments of the NDT market. Quality assurance and regulatory compliance are key considerations for manufacturers, and NDT equipment plays a critical role in ensuring product safety and reliability.

Training courses and calibration services are essential for maintaining the effectiveness of NDT equipment and ensuring accurate results. In the construction industry, NDT is increasingly being used for pipeline inspection, asset integrity management, and corrosion detection. Industrial computed tomography and x-ray fluorescence are particularly useful for material characterization and identifying defects in materials used in construction applications. Machine learning and artificial intelligence are also being integrated into NDT software to improve data analysis and automate processes such as automated ultrasonic testing and automated visual inspection. The NDT Equipment Market in North America is witnessing significant growth, driven by the strong presence of the oil and gas and aerospace industries in the region.

Advanced technologies such as digital radiography, time-of-flight diffraction, and machine learning are transforming the industry, enabling real-time flaw detection, predictive modeling, and automated processes. The focus on safety, quality control, and regulatory compliance is driving the adoption of NDT equipment across various industries, including manufacturing, construction, and energy. The integration of NDT technologies with AI and machine learning algorithms is expected to further enhance the capabilities of NDT solutions, improving overall operational efficiency and safety.

Market Dynamics

Our researchers analyzed the data with 2024 as the base year, along with the key drivers, trends, and challenges. A holistic analysis of drivers will help companies refine their marketing strategies to gain a competitive advantage.

What are the Non-Destructive Testing (NDT) Equipment market drivers leading to the rise in the adoption of Industry?

  • The rise in oil, gas, and power generation projects serves as the primary catalyst for market growth. Non-Destructive Testing (NDT) plays a crucial role in the oil and gas industry for ensuring equipment integrity, petroleum refining safety, and petroleum extraction operation safety. Ultrasonic and eddy current NDT equipment are essential for meticulous inspection of welds and metals to detect flaws and corrosion, preventing hazardous chemicals and fluids from escaping. NDT solutions are indispensable in various oil and gas applications, including upstream, midstream, and downstream sectors. Ultrasonic testing is used for inspecting welds and materials in the upstream sector to maintain the integrity of equipment used in petroleum extraction. Eddy current testing is employed to detect corrosion under insulation in the midstream sector, ensuring pipeline and transportation safety.
  • In the downstream sector, NDT techniques such as X-ray fluorescence, computed tomography (CT), and acoustic emission testing are used for defect classification and structural health monitoring. Sensor technology, real-time radiography, microfocus X-ray, and artificial intelligence (AI) are advanced NDT technologies used to enhance inspection efficiency and accuracy. Training courses and calibration services are also essential for maintaining the effectiveness of NDT equipment and ensuring that inspectors are proficient in using the latest NDT techniques. Leak testing and welding inspection are critical applications of NDT in the oil and gas industry. NDT solutions enable the detection of even the smallest defects, ensuring the safe and efficient operation of oil and gas facilities.

What are the Non-Destructive Testing (NDT) Equipment market trends shaping the Industry?

  • The increasing demand for ultrasonic testing equipment represents a significant market trend. This technology is increasingly being adopted for various industries due to its non-destructive inspection capabilities and high precision. Non-Destructive Testing (NDT) equipment is essential for ensuring asset integrity and regulatory compliance in various industries. Ultrasonic testing, a widely used NDT method, has gained prominence over radiography or computed tomography due to its advantages. Ultrasound technology employs high-frequency sound waves to detect defects, offering benefits such as accurate measurement of defect height, superior planar flaw detection, radiation-free operation, and no generation of waste material or use of chemicals.
  • This acceptance of ultrasonic testing as a viable alternative to radiography is a significant market trend. Other NDT techniques, such as guided wave testing for pipeline inspection, crack detection, material characterization through industrial computed tomography, dimensional inspection via visual inspection, dye penetrant testing, hardness testing, infrared thermography, and electromagnetic acoustic transducers, cater to diverse industry requirements. These methods contribute to the growth and versatility of the NDT market. Data acquisition systems play a crucial role in NDT, enabling efficient and accurate data collection and analysis. The ongoing development of advanced NDT technologies and the increasing focus on asset integrity management drive market expansion. 

How does Non-Destructive Testing (NDT) Equipment market face challenges during its growth?

  • The increasing prevalence of pre-owned NDT (Non-Destructive Testing) equipment in the market poses a significant challenge to the industry's growth trajectory. This trend, driven by the affordability and accessibility of second-hand equipment, necessitates continuous innovation and differentiation strategies among manufacturers and providers to remain competitive. The market is witnessing significant attention from market participants, with a focus on enhancing the capabilities of existing NDT solutions. However, not all end-users can afford to invest in the latest NDT equipment due to budget constraints. Instead, they opt for pre-owned NDT equipment, which is cost-effective and available through various sources such as NDT Supply.Com Inc., R-CON NDT, Test Equipment Distributors, and JWJ NDT. These platforms offer a wide range of pre-owned NDT equipment, including automated ultrasonic testing systems, radiographic testing equipment, eddy current testing systems, and more. The trend toward pre-owned NDT equipment may hinder the sales growth of new units.
  • End-users prefer this option due to the significant cost savings it offers. However, these pre-owned units may not have the latest features and advanced capabilities of new NDT equipment. Moreover, they may require additional maintenance and calibration efforts. To cater to the evolving needs of end-users, market participants are integrating advanced technologies such as NDT software, machine learning, data visualization, and predictive modeling into their offerings. These technologies enable automated ultrasonic testing, corrosion detection, and automated visual inspection, among other applications. Furthermore, cloud computing is gaining popularity in the NDT industry, enabling end-users to access real-time data and analysis from anywhere.

Exclusive Customer Landscape

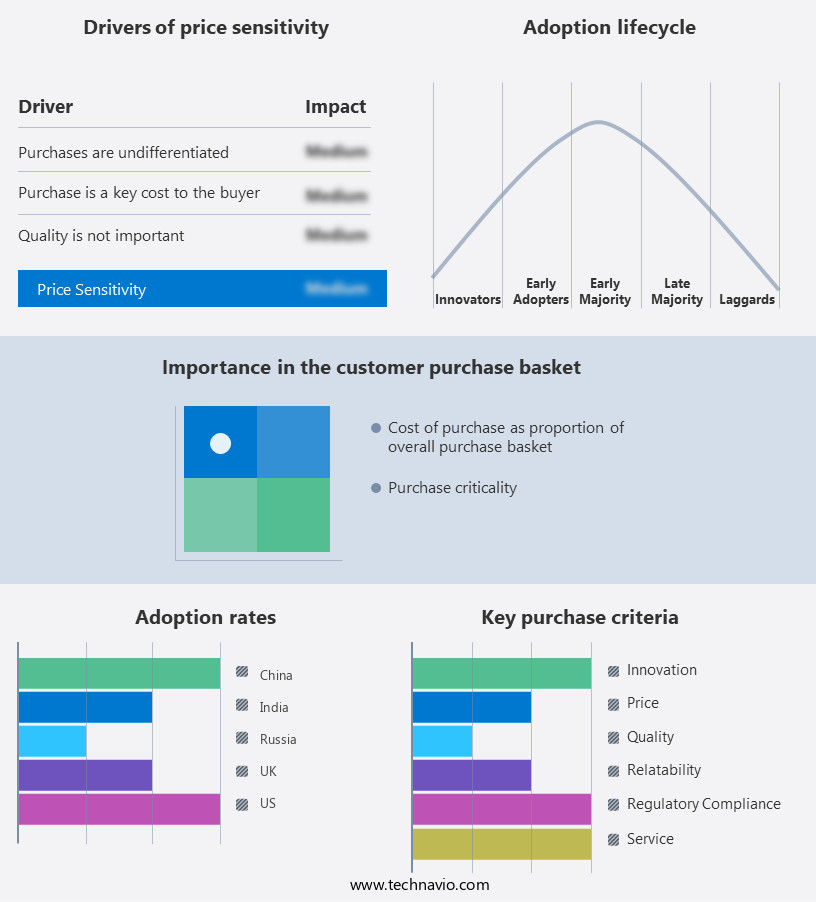
The non-destructive testing (ndt) equipment market forecasting report includes the adoption lifecycle of the market, covering from the innovator's stage to the laggard's stage. It focuses on adoption rates in different regions based on penetration. Furthermore, the non-destructive testing (ndt) equipment market report also includes key purchase criteria and drivers of price sensitivity to help companies evaluate and develop their market growth analysis strategies.

Non-Destructive Testing (NDT) Equipment Market Share by Geography

 Customer Landscape

Key Companies & Market Insights

Companies are implementing various strategies, such as strategic alliances, non-destructive testing (NDT) equipment market forecast, partnerships, mergers and acquisitions, geographical expansion, and product/service launches, to enhance their presence in the industry.

Acuren Corp. - The company specializes in Non-Destructive Testing (NDT) Equipment and delivers advanced testing services powered by state-of-the-art technologies, such as 3D modeling, high-precision ultrasonics, corrosion mapping, and cathodic protection (CP) measurement systems. 

The industry research and growth report includes detailed analyses of the competitive landscape of the market and information about key companies, including:

  • Acuren Corp.
  • Ashtead technology
  • Carl Zeiss AG
  • Cygnus Instruments Ltd.
  • Eddyfi Technologies
  • FPrimeC Solutions Inc.
  • FUJIFILM Holdings Corp.
  • General Electric Co.
  • HELMUT FISCHER GMBH
  • Illinois Tool Works Inc.
  • Labquip NDT Ltd.
  • Mistras Group Inc.
  • MME Group
  • Nikon Corp.
  • Olympus Corp.
  • Roper Technologies Inc.
  • Sonatest Ltd
  • TWI Ltd.
  • YXLON International GmbH
  • Zetec Inc.

Qualitative and quantitative analysis of companies has been conducted to help clients understand the wider business environment as well as the strengths and weaknesses of key industry players. Data is qualitatively analyzed to categorize companies as pure play, category-focused, industry-focused, and diversified; it is quantitatively analyzed to categorize companies as dominant, leading, strong, tentative, and weak.

Recent Development and News in Non-Destructive Testing (NDT) Equipment Market

  • In January 2024, Olympus Corporation, a leading manufacturer of NDT equipment, launched its new PharmaBright series of digital radiography systems, designed specifically for the pharmaceutical industry to ensure product quality and compliance with regulatory standards (Olympus Corporation Press Release).
  • In March 2024, Siemens AG and Mistras Group, Inc., two major players in NDT, announced a strategic partnership to expand their service offerings, combining Siemens' advanced technology with Mistras' extensive expertise in NDT services and data analytics (Siemens AG Press Release).
  • In May 2024, Eddyfi Technologies, a leading provider of advanced NDT technologies, completed a USD 50 million Series C funding round, led by Caisse de dépôt et placement du Québec, to accelerate the development and commercialization of its innovative technologies and expand its global presence (Eddyfi Technologies Press Release).
  • In April 2025, the European Union passed the new European Regulation on the Market Surveillance of Products (Regulation 2019/1020), which includes provisions for increased scrutiny of NDT equipment, aiming to enhance product safety and consumer protection (European Commission Press Release).

Research Analyst Overview

The market continues to evolve, driven by the increasing demand for efficient, accurate, and cost-effective methods for flaw detection and quality control across various sectors. This dynamic market encompasses a range of technologies, including pipeline inspection, data acquisition systems, testing standards, guided wave testing, crack detection, material characterization, industrial computed tomography, regulatory compliance, dimensional inspection, visual inspection, dye penetrant testing, asset integrity management, infrared thermography, hardness testing, electromagnetic acoustic transducers, and more. Energy applications, particularly in the oil and gas industry, have been a significant driver of growth in the NDT market. Remote inspection and big data analysis have become essential for ensuring safety and optimizing operations in these sectors.

Digital radiography, time-of-flight diffraction, and other advanced NDT techniques are increasingly being adopted to enhance the capabilities of traditional methods. In the manufacturing sector, NDT plays a crucial role in ensuring product quality and safety. Ultrasonic testing, eddy current testing, and automated ultrasonic testing are widely used for defect classification and predictive modeling. Neutron radiography and automated visual inspection are essential for aerospace applications, while X-ray fluorescence and microfocus X-ray are critical for material characterization. The ongoing development of sensor technology, data analysis software, and machine learning algorithms is transforming the NDT landscape. Real-time radiography, signal processing, image processing, and cloud computing are enabling more efficient and accurate data analysis.

Training courses and calibration services are also essential for ensuring the effective implementation and maintenance of NDT technologies. Regulatory compliance remains a critical factor in the NDT market, with stringent safety standards driving the adoption of advanced testing methods. Leak testing, welding inspection, and structural health monitoring are essential for ensuring the integrity of critical infrastructure. Infrared thermography and corrosion detection are vital for maintaining asset health and preventing costly downtime. The NDT equipment market is characterized by continuous innovation and evolution, driven by the need for efficient, accurate, and cost-effective methods for flaw detection and quality control across various sectors.

The integration of advanced technologies, such as digital radiography, machine learning, and cloud computing, is transforming the market and enabling new applications in energy, manufacturing, and infrastructure. The NDT equipment market is witnessing a shift towards pre-owned equipment due to cost considerations. However, market participants are responding by integrating advanced technologies into their offerings to provide end-users with more value and capabilities. This dynamic market environment requires a deep understanding of the latest trends and technologies to stay competitive. Regulatory organizations, including the American Society of Mechanical Engineers (ASME) and the American Petroleum Institute (API), have approved codes that permit the substitution of radiography testing with ultrasonic testing in specific applications.

Dive into Technavio's robust research methodology, blending expert interviews, extensive data synthesis, and validated models for unparalleled Non-Destructive Testing (NDT) Equipment Market insights. See full methodology.

Market Scope

Report Coverage

Details

Page number

231

Base year

2024

Historic period

2019-2023

Forecast period

2025-2029

Growth momentum & CAGR

Accelerate at a CAGR of 6%

Market growth 2025-2029

USD 950.5 million

Market structure

Fragmented

YoY growth 2024-2025(%)

5.6

Key countries

US, China, Germany, UK, India, Canada, Japan, France, Brazil, and South Korea

Competitive landscape

Leading Companies, Market Positioning of Companies, Competitive Strategies, and Industry Risks

Request Free Sample

What are the Key Data Covered in this Non-Destructive Testing (NDT) Equipment Market Research and Growth Report?

  • CAGR of the Non-Destructive Testing (NDT) Equipment industry during the forecast period
  • Detailed information on factors that will drive the growth and forecasting between 2025 and 2029
  • Precise estimation of the size of the market and its contribution of the industry in focus to the parent market
  • Accurate predictions about upcoming growth and trends and changes in consumer behaviour
  • Growth of the market across North America, APAC, Europe, South America, and Middle East and Africa
  • Thorough analysis of the market's competitive landscape and detailed information about companies
  • Comprehensive analysis of factors that will challenge the non-destructive testing (ndt) equipment market growth of industry companies

We can help! Our analysts can customize this non-destructive testing (ndt) equipment market research report to meet your requirements.

Get in touch

1 Executive Summary

  • 1.1 Market overview
    • Executive Summary - Chart on Market Overview
    • Executive Summary - Data Table on Market Overview
    • Executive Summary - Chart on Global Market Characteristics
    • Executive Summary - Chart on Market by Geography
    • Executive Summary - Chart on Market Segmentation by End-user
    • Executive Summary - Chart on Market Segmentation by Product Type
    • Executive Summary - Chart on Market Segmentation by Product
    • Executive Summary - Chart on Incremental Growth
    • Executive Summary - Data Table on Incremental Growth
    • Executive Summary - Chart on Company Market Positioning

2 Technavio Analysis

  • 2.1 Analysis of price sensitivity, lifecycle, customer purchase basket, adoption rates, and purchase criteria
    • Analysis of price sensitivity, lifecycle, customer purchase basket, adoption rates, and purchase criteria
  • 2.2 Criticality of inputs and Factors of differentiation
    • Overview on criticality of inputs and factors of differentiation
  • 2.3 Factors of disruption
    • Overview on factors of disruption
  • 2.4 Impact of drivers and challenges
    • Impact of drivers and challenges in 2024 and 2029

3 Market Landscape

  • 3.1 Market ecosystem
    • Parent Market
    • Data Table on - Parent Market
  • 3.2 Market characteristics
    • Market characteristics analysis
  • 3.3 Value chain analysis
    • Value chain analysis

4 Market Sizing

  • 4.1 Market definition
    • Offerings of companies included in the market definition
  • 4.2 Market segment analysis
    • Market segments
  • 4.3 Market size 2024
    • 4.4 Market outlook: Forecast for 2024-2029
      • Chart on Global - Market size and forecast 2024-2029 ($ million)
      • Data Table on Global - Market size and forecast 2024-2029 ($ million)
      • Chart on Global Market: Year-over-year growth 2024-2029 (%)
      • Data Table on Global Market: Year-over-year growth 2024-2029 (%)

    5 Historic Market Size

    • 5.1 Global Non-Destructive Testing (NDT) Equipment Market 2019 - 2023
      • Historic Market Size - Data Table on Global Non-Destructive Testing (NDT) Equipment Market 2019 - 2023 ($ million)
    • 5.2 End-user segment analysis 2019 - 2023
      • Historic Market Size - End-user Segment 2019 - 2023 ($ million)
    • 5.3 Product Type segment analysis 2019 - 2023
      • Historic Market Size - Product Type Segment 2019 - 2023 ($ million)
    • 5.4 Product segment analysis 2019 - 2023
      • Historic Market Size - Product Segment 2019 - 2023 ($ million)
    • 5.5 Geography segment analysis 2019 - 2023
      • Historic Market Size - Geography Segment 2019 - 2023 ($ million)
    • 5.6 Country segment analysis 2019 - 2023
      • Historic Market Size - Country Segment 2019 - 2023 ($ million)

    6 Qualitative Analysis

    • 6.1 Impact of AI in global non-destructive testing (NDT) equipment market

      7 Five Forces Analysis

      • 7.1 Five forces summary
        • Five forces analysis - Comparison between 2024 and 2029
      • 7.2 Bargaining power of buyers
        • Bargaining power of buyers - Impact of key factors 2024 and 2029
      • 7.3 Bargaining power of suppliers
        • Bargaining power of suppliers - Impact of key factors in 2024 and 2029
      • 7.4 Threat of new entrants
        • Threat of new entrants - Impact of key factors in 2024 and 2029
      • 7.5 Threat of substitutes
        • Threat of substitutes - Impact of key factors in 2024 and 2029
      • 7.6 Threat of rivalry
        • Threat of rivalry - Impact of key factors in 2024 and 2029
      • 7.7 Market condition
        • Chart on Market condition - Five forces 2024 and 2029

      8 Market Segmentation by End-user

      • 8.1 Market segments
        • Chart on End-user - Market share 2024-2029 (%)
        • Data Table on End-user - Market share 2024-2029 (%)
      • 8.2 Comparison by End-user
        • Chart on Comparison by End-user
        • Data Table on Comparison by End-user
      • 8.3 Oil and gas - Market size and forecast 2024-2029
        • Chart on Oil and gas - Market size and forecast 2024-2029 ($ million)
        • Data Table on Oil and gas - Market size and forecast 2024-2029 ($ million)
        • Chart on Oil and gas - Year-over-year growth 2024-2029 (%)
        • Data Table on Oil and gas - Year-over-year growth 2024-2029 (%)
      • 8.4 Power generation - Market size and forecast 2024-2029
        • Chart on Power generation - Market size and forecast 2024-2029 ($ million)
        • Data Table on Power generation - Market size and forecast 2024-2029 ($ million)
        • Chart on Power generation - Year-over-year growth 2024-2029 (%)
        • Data Table on Power generation - Year-over-year growth 2024-2029 (%)
      • 8.5 Aerospace and defense - Market size and forecast 2024-2029
        • Chart on Aerospace and defense - Market size and forecast 2024-2029 ($ million)
        • Data Table on Aerospace and defense - Market size and forecast 2024-2029 ($ million)
        • Chart on Aerospace and defense - Year-over-year growth 2024-2029 (%)
        • Data Table on Aerospace and defense - Year-over-year growth 2024-2029 (%)
      • 8.6 Automotive and transportation - Market size and forecast 2024-2029
        • Chart on Automotive and transportation - Market size and forecast 2024-2029 ($ million)
        • Data Table on Automotive and transportation - Market size and forecast 2024-2029 ($ million)
        • Chart on Automotive and transportation - Year-over-year growth 2024-2029 (%)
        • Data Table on Automotive and transportation - Year-over-year growth 2024-2029 (%)
      • 8.7 Others - Market size and forecast 2024-2029
        • Chart on Others - Market size and forecast 2024-2029 ($ million)
        • Data Table on Others - Market size and forecast 2024-2029 ($ million)
        • Chart on Others - Year-over-year growth 2024-2029 (%)
        • Data Table on Others - Year-over-year growth 2024-2029 (%)
      • 8.8 Market opportunity by End-user
        • Market opportunity by End-user ($ million)
        • Data Table on Market opportunity by End-user ($ million)

      9 Market Segmentation by Product Type

      • 9.1 Market segments
        • Chart on Product Type - Market share 2024-2029 (%)
        • Data Table on Product Type - Market share 2024-2029 (%)
      • 9.2 Comparison by Product Type
        • Chart on Comparison by Product Type
        • Data Table on Comparison by Product Type
      • 9.3 Ultrasonic testing equipment - Market size and forecast 2024-2029
        • Chart on Ultrasonic testing equipment - Market size and forecast 2024-2029 ($ million)
        • Data Table on Ultrasonic testing equipment - Market size and forecast 2024-2029 ($ million)
        • Chart on Ultrasonic testing equipment - Year-over-year growth 2024-2029 (%)
        • Data Table on Ultrasonic testing equipment - Year-over-year growth 2024-2029 (%)
      • 9.4 Radiography testing equipment - Market size and forecast 2024-2029
        • Chart on Radiography testing equipment - Market size and forecast 2024-2029 ($ million)
        • Data Table on Radiography testing equipment - Market size and forecast 2024-2029 ($ million)
        • Chart on Radiography testing equipment - Year-over-year growth 2024-2029 (%)
        • Data Table on Radiography testing equipment - Year-over-year growth 2024-2029 (%)
      • 9.5 Visual testing equipment - Market size and forecast 2024-2029
        • Chart on Visual testing equipment - Market size and forecast 2024-2029 ($ million)
        • Data Table on Visual testing equipment - Market size and forecast 2024-2029 ($ million)
        • Chart on Visual testing equipment - Year-over-year growth 2024-2029 (%)
        • Data Table on Visual testing equipment - Year-over-year growth 2024-2029 (%)
      • 9.6 Others - Market size and forecast 2024-2029
        • Chart on Others - Market size and forecast 2024-2029 ($ million)
        • Data Table on Others - Market size and forecast 2024-2029 ($ million)
        • Chart on Others - Year-over-year growth 2024-2029 (%)
        • Data Table on Others - Year-over-year growth 2024-2029 (%)
      • 9.7 Market opportunity by Product Type
        • Market opportunity by Product Type ($ million)
        • Data Table on Market opportunity by Product Type ($ million)

      10 Market Segmentation by Product

      • 10.1 Market segments
        • Chart on Product - Market share 2024-2029 (%)
        • Data Table on Product - Market share 2024-2029 (%)
      • 10.2 Comparison by Product
        • Chart on Comparison by Product
        • Data Table on Comparison by Product
      • 10.3 Portable equipment - Market size and forecast 2024-2029
        • Chart on Portable equipment - Market size and forecast 2024-2029 ($ million)
        • Data Table on Portable equipment - Market size and forecast 2024-2029 ($ million)
        • Chart on Portable equipment - Year-over-year growth 2024-2029 (%)
        • Data Table on Portable equipment - Year-over-year growth 2024-2029 (%)
      • 10.4 Stationary equipment - Market size and forecast 2024-2029
        • Chart on Stationary equipment - Market size and forecast 2024-2029 ($ million)
        • Data Table on Stationary equipment - Market size and forecast 2024-2029 ($ million)
        • Chart on Stationary equipment - Year-over-year growth 2024-2029 (%)
        • Data Table on Stationary equipment - Year-over-year growth 2024-2029 (%)
      • 10.5 Software solutions - Market size and forecast 2024-2029
        • Chart on Software solutions - Market size and forecast 2024-2029 ($ million)
        • Data Table on Software solutions - Market size and forecast 2024-2029 ($ million)
        • Chart on Software solutions - Year-over-year growth 2024-2029 (%)
        • Data Table on Software solutions - Year-over-year growth 2024-2029 (%)
      • 10.6 Market opportunity by Product
        • Market opportunity by Product ($ million)
        • Data Table on Market opportunity by Product ($ million)

      11 Customer Landscape

      • 11.1 Customer landscape overview
        • Analysis of price sensitivity, lifecycle, customer purchase basket, adoption rates, and purchase criteria

      12 Geographic Landscape

      • 12.1 Geographic segmentation
        • Chart on Market share by geography 2024-2029 (%)
        • Data Table on Market share by geography 2024-2029 (%)
      • 12.2 Geographic comparison
        • Chart on Geographic comparison
        • Data Table on Geographic comparison
      • 12.3 North America - Market size and forecast 2024-2029
        • Chart on North America - Market size and forecast 2024-2029 ($ million)
        • Data Table on North America - Market size and forecast 2024-2029 ($ million)
        • Chart on North America - Year-over-year growth 2024-2029 (%)
        • Data Table on North America - Year-over-year growth 2024-2029 (%)
      • 12.4 APAC - Market size and forecast 2024-2029
        • Chart on APAC - Market size and forecast 2024-2029 ($ million)
        • Data Table on APAC - Market size and forecast 2024-2029 ($ million)
        • Chart on APAC - Year-over-year growth 2024-2029 (%)
        • Data Table on APAC - Year-over-year growth 2024-2029 (%)
      • 12.5 Europe - Market size and forecast 2024-2029
        • Chart on Europe - Market size and forecast 2024-2029 ($ million)
        • Data Table on Europe - Market size and forecast 2024-2029 ($ million)
        • Chart on Europe - Year-over-year growth 2024-2029 (%)
        • Data Table on Europe - Year-over-year growth 2024-2029 (%)
      • 12.6 South America - Market size and forecast 2024-2029
        • Chart on South America - Market size and forecast 2024-2029 ($ million)
        • Data Table on South America - Market size and forecast 2024-2029 ($ million)
        • Chart on South America - Year-over-year growth 2024-2029 (%)
        • Data Table on South America - Year-over-year growth 2024-2029 (%)
      • 12.7 Middle East and Africa - Market size and forecast 2024-2029
        • Chart on Middle East and Africa - Market size and forecast 2024-2029 ($ million)
        • Data Table on Middle East and Africa - Market size and forecast 2024-2029 ($ million)
        • Chart on Middle East and Africa - Year-over-year growth 2024-2029 (%)
        • Data Table on Middle East and Africa - Year-over-year growth 2024-2029 (%)
      • 12.8 US - Market size and forecast 2024-2029
        • Chart on US - Market size and forecast 2024-2029 ($ million)
        • Data Table on US - Market size and forecast 2024-2029 ($ million)
        • Chart on US - Year-over-year growth 2024-2029 (%)
        • Data Table on US - Year-over-year growth 2024-2029 (%)
      • 12.9 China - Market size and forecast 2024-2029
        • Chart on China - Market size and forecast 2024-2029 ($ million)
        • Data Table on China - Market size and forecast 2024-2029 ($ million)
        • Chart on China - Year-over-year growth 2024-2029 (%)
        • Data Table on China - Year-over-year growth 2024-2029 (%)
      • 12.10 Germany - Market size and forecast 2024-2029
        • Chart on Germany - Market size and forecast 2024-2029 ($ million)
        • Data Table on Germany - Market size and forecast 2024-2029 ($ million)
        • Chart on Germany - Year-over-year growth 2024-2029 (%)
        • Data Table on Germany - Year-over-year growth 2024-2029 (%)
      • 12.11 India - Market size and forecast 2024-2029
        • Chart on India - Market size and forecast 2024-2029 ($ million)
        • Data Table on India - Market size and forecast 2024-2029 ($ million)
        • Chart on India - Year-over-year growth 2024-2029 (%)
        • Data Table on India - Year-over-year growth 2024-2029 (%)
      • 12.12 UK - Market size and forecast 2024-2029
        • Chart on UK - Market size and forecast 2024-2029 ($ million)
        • Data Table on UK - Market size and forecast 2024-2029 ($ million)
        • Chart on UK - Year-over-year growth 2024-2029 (%)
        • Data Table on UK - Year-over-year growth 2024-2029 (%)
      • 12.13 Canada - Market size and forecast 2024-2029
        • Chart on Canada - Market size and forecast 2024-2029 ($ million)
        • Data Table on Canada - Market size and forecast 2024-2029 ($ million)
        • Chart on Canada - Year-over-year growth 2024-2029 (%)
        • Data Table on Canada - Year-over-year growth 2024-2029 (%)
      • 12.14 Japan - Market size and forecast 2024-2029
        • Chart on Japan - Market size and forecast 2024-2029 ($ million)
        • Data Table on Japan - Market size and forecast 2024-2029 ($ million)
        • Chart on Japan - Year-over-year growth 2024-2029 (%)
        • Data Table on Japan - Year-over-year growth 2024-2029 (%)
      • 12.15 France - Market size and forecast 2024-2029
        • Chart on France - Market size and forecast 2024-2029 ($ million)
        • Data Table on France - Market size and forecast 2024-2029 ($ million)
        • Chart on France - Year-over-year growth 2024-2029 (%)
        • Data Table on France - Year-over-year growth 2024-2029 (%)
      • 12.16 Brazil - Market size and forecast 2024-2029
        • Chart on Brazil - Market size and forecast 2024-2029 ($ million)
        • Data Table on Brazil - Market size and forecast 2024-2029 ($ million)
        • Chart on Brazil - Year-over-year growth 2024-2029 (%)
        • Data Table on Brazil - Year-over-year growth 2024-2029 (%)
      • 12.17 South Korea - Market size and forecast 2024-2029
        • Chart on South Korea - Market size and forecast 2024-2029 ($ million)
        • Data Table on South Korea - Market size and forecast 2024-2029 ($ million)
        • Chart on South Korea - Year-over-year growth 2024-2029 (%)
        • Data Table on South Korea - Year-over-year growth 2024-2029 (%)
      • 12.18 Market opportunity by geography
        • Market opportunity by geography ($ million)
        • Data Tables on Market opportunity by geography ($ million)

      13 Drivers, Challenges, and Opportunity/Restraints

      • 13.1 Market drivers
        • 13.2 Market challenges
          • 13.3 Impact of drivers and challenges
            • Impact of drivers and challenges in 2024 and 2029
          • 13.4 Market opportunities/restraints

            14 Competitive Landscape

            • 14.1 Overview
              • 14.2 Competitive Landscape
                • Overview on criticality of inputs and factors of differentiation
              • 14.3 Landscape disruption
                • Overview on factors of disruption
              • 14.4 Industry risks
                • Impact of key risks on business

              15 Competitive Analysis

              • 15.1 Companies profiled
                • Companies covered
              • 15.2 Company ranking index
                • Company ranking index
              • 15.3 Market positioning of companies
                • Matrix on companies position and classification
              • 15.4 Ashtead technology
                • Ashtead technology - Overview
                • Ashtead technology - Product / Service
                • Ashtead technology - Key offerings
                • SWOT
              • 15.5 Carl Zeiss AG
                • Carl Zeiss AG - Overview
                • Carl Zeiss AG - Product / Service
                • Carl Zeiss AG - Key news
                • Carl Zeiss AG - Key offerings
                • SWOT
              • 15.6 Cygnus Instruments Ltd.
                • Cygnus Instruments Ltd. - Overview
                • Cygnus Instruments Ltd. - Product / Service
                • Cygnus Instruments Ltd. - Key offerings
                • SWOT
              • 15.7 Eddyfi Technologies
                • Eddyfi Technologies - Overview
                • Eddyfi Technologies - Product / Service
                • Eddyfi Technologies - Key offerings
                • SWOT
              • 15.8 FUJIFILM Holdings Corp.
                • FUJIFILM Holdings Corp. - Overview
                • FUJIFILM Holdings Corp. - Business segments
                • FUJIFILM Holdings Corp. - Key news
                • FUJIFILM Holdings Corp. - Key offerings
                • FUJIFILM Holdings Corp. - Segment focus
                • SWOT
              • 15.9 General Electric Co.
                • General Electric Co. - Overview
                • General Electric Co. - Business segments
                • General Electric Co. - Key news
                • General Electric Co. - Key offerings
                • General Electric Co. - Segment focus
                • SWOT
              • 15.10 HELMUT FISCHER GMBH
                • HELMUT FISCHER GMBH - Overview
                • HELMUT FISCHER GMBH - Product / Service
                • HELMUT FISCHER GMBH - Key offerings
                • SWOT
              • 15.11 Illinois Tool Works Inc.
                • Illinois Tool Works Inc. - Overview
                • Illinois Tool Works Inc. - Business segments
                • Illinois Tool Works Inc. - Key offerings
                • Illinois Tool Works Inc. - Segment focus
                • SWOT
              • 15.12 Mistras Group Inc.
                • Mistras Group Inc. - Overview
                • Mistras Group Inc. - Business segments
                • Mistras Group Inc. - Key news
                • Mistras Group Inc. - Key offerings
                • Mistras Group Inc. - Segment focus
                • SWOT
              • 15.13 MME Group
                • MME Group - Overview
                • MME Group - Product / Service
                • MME Group - Key offerings
                • SWOT
              • 15.14 Nikon Corp.
                • Nikon Corp. - Overview
                • Nikon Corp. - Business segments
                • Nikon Corp. - Key offerings
                • Nikon Corp. - Segment focus
                • SWOT
              • 15.15 Olympus Corp.
                • Olympus Corp. - Overview
                • Olympus Corp. - Business segments
                • Olympus Corp. - Key news
                • Olympus Corp. - Key offerings
                • Olympus Corp. - Segment focus
                • SWOT
              • 15.16 Sonatest Ltd
                • Sonatest Ltd - Overview
                • Sonatest Ltd - Product / Service
                • Sonatest Ltd - Key offerings
                • SWOT
              • 15.17 YXLON International GmbH
                • YXLON International GmbH - Overview
                • YXLON International GmbH - Product / Service
                • YXLON International GmbH - Key offerings
                • SWOT
              • 15.18 Zetec Inc.
                • Zetec Inc. - Overview
                • Zetec Inc. - Product / Service
                • Zetec Inc. - Key offerings
                • SWOT

              16 Appendix

              • 16.1 Scope of the report
                • 16.2 Inclusions and exclusions checklist
                  • Inclusions checklist
                  • Exclusions checklist
                • 16.3 Currency conversion rates for US$
                  • Currency conversion rates for US$
                • 16.4 Research methodology
                  • Research methodology
                • 16.5 Data procurement
                  • Information sources
                • 16.6 Data validation
                  • Data validation
                • 16.7 Validation techniques employed for market sizing
                  • Validation techniques employed for market sizing
                • 16.8 Data synthesis
                  • Data synthesis
                • 16.9 360 degree market analysis
                  • 360 degree market analysis
                • 16.10 List of abbreviations
                  • List of abbreviations

                Research Methodology

                Technavio presents a detailed picture of the market by way of study, synthesis, and summation of data from multiple sources. The analysts have presented the various facets of the market with a particular focus on identifying the key industry influencers. The data thus presented is comprehensive, reliable, and the result of extensive research, both primary and secondary.

                INFORMATION SOURCES

                Primary sources

                • Manufacturers and suppliers
                • Channel partners
                • Industry experts
                • Strategic decision makers

                Secondary sources

                • Industry journals and periodicals
                • Government data
                • Financial reports of key industry players
                • Historical data
                • Press releases

                DATA ANALYSIS

                Data Synthesis

                • Collation of data
                • Estimation of key figures
                • Analysis of derived insights

                Data Validation

                • Triangulation with data models
                • Reference against proprietary databases
                • Corroboration with industry experts

                REPORT WRITING

                Qualitative

                • Market drivers
                • Market challenges
                • Market trends
                • Five forces analysis

                Quantitative

                • Market size and forecast
                • Market segmentation
                • Geographical insights
                • Competitive landscape

                Interested in this report?

                Get your sample now to see our research methodology and insights!

                Download Now

                Frequently Asked Questions

                Non-Destructive Testing (Ndt) Equipment market growth will increase by $ 950.5 mn during 2025-2029.

                The Non-Destructive Testing (Ndt) Equipment market is expected to grow at a CAGR of 6% during 2025-2029.

                Non-Destructive Testing (Ndt) Equipment market is segmented by End-user( Oil and gas, Power generation, Aerospace and defense, Automotive and transportation, Others) Product Type( Ultrasonic testing equipment, Radiography testing equipment, Visual testing equipment, Others, Others) Product( Portable equipment, Stationary equipment, Software solutions, South America, Middle East and Africa)

                Acuren Corp., Ashtead technology, Carl Zeiss AG, Cygnus Instruments Ltd., Eddyfi Technologies, FPrimeC Solutions Inc., FUJIFILM Holdings Corp., General Electric Co., HELMUT FISCHER GMBH, Illinois Tool Works Inc., Labquip NDT Ltd., Mistras Group Inc., MME Group, Nikon Corp., Olympus Corp., Roper Technologies Inc., Sonatest Ltd, TWI Ltd., YXLON International GmbH, Zetec Inc. are a few of the key vendors in the Non-Destructive Testing (Ndt) Equipment market.

                APAC will register the highest growth rate of 39% among the other regions. Therefore, the Non-Destructive Testing (Ndt) Equipment market in APAC is expected to garner significant business opportunities for the vendors during the forecast period.

                US, China, Germany, UK, India, Canada, Japan, France, Brazil, South Korea

                • Increase in oil and gas and power generation projectsIn the oil and gas industry is the driving factor this market.
                • NDT is required to assess the integrity of equipment is the driving factor this market.
                • the safety of petroleum refining is the driving factor this market.
                • and the safety of petroleum extraction operations. Ultrasonic and eddy current NDT equipment is required for careful inspection of welds and metals for flaws and corrosion to keep potentially hazardous chemicals and fluids safely contained within pipes and pressure vessels. NDT plays a role in many parts of the oil and gas industry. Operating a safe is the driving factor this market.
                • efficient is the driving factor this market.
                • and profitable petroleum extraction operation requires effective ultrasonic and eddy current oil and upstream gas solutions. Transferring the extracted crude oil and gasses to the refineries is the driving factor this market.
                • where they will be converted into usable products is the driving factor this market.
                • needs a complete suite of midstream NDT solutions to keep pipelines and transportation operating smoothly.Investments in the development of oil and gas infrastructure have increased owing to the growing energy demand. In the oil and gas industry is the driving factor this market.
                • companies are shifting from onshore locations to deepwater and ultra-deepwater oil and gas fields. For instance is the driving factor this market.
                • Iraq Ministry of Finance signed a USD 897 million loan agreement with Japan for Phase 4 of the Basrah Refinery development project. The project will develop the current Basrah refinery by installing a new Fluid Catalytic Cracking (FCC) that will produce high-value oil petroleum products is the driving factor this market.
                • such as gasoline and diesel.New discoveries of offshore gas reserves in Africa will further spur the demand for NDT equipment. For instance is the driving factor this market.
                • Total SA (Total) discovered 57 meters of net gas condensate pay in South Africa is the driving factor this market.
                • located 175 kilometers off the country southern coast. New power plant projects are getting launched. For instance is the driving factor this market.
                • in 2024 is the driving factor this market.
                • Tesla Inc. expanded its Virtual Power Plant (VPP) efforts significantly is the driving factor this market.
                • moving beyond pilots to large-scale utility partnerships and compensation programs. Notably is the driving factor this market.
                • Tesla announced that it had paid out nearly $9.9 million to Powerwall owners participating in its VPP programs worldwide is the driving factor this market.
                • rewarding them for grid-support services during peak demand and emergency events. Such expansions in the oil and gas and power generation sectors can increase the for NDT equipment in the global non-destructive testing (NDT) equipment market during the forecast period. is the driving factor this market.

                The Non-Destructive Testing (Ndt) Equipment market vendors should focus on grabbing business opportunities from the Oil and gas segment as it accounted for the largest market share in the base year.