
North America Breakfast Cereals Market Size 2025-2029
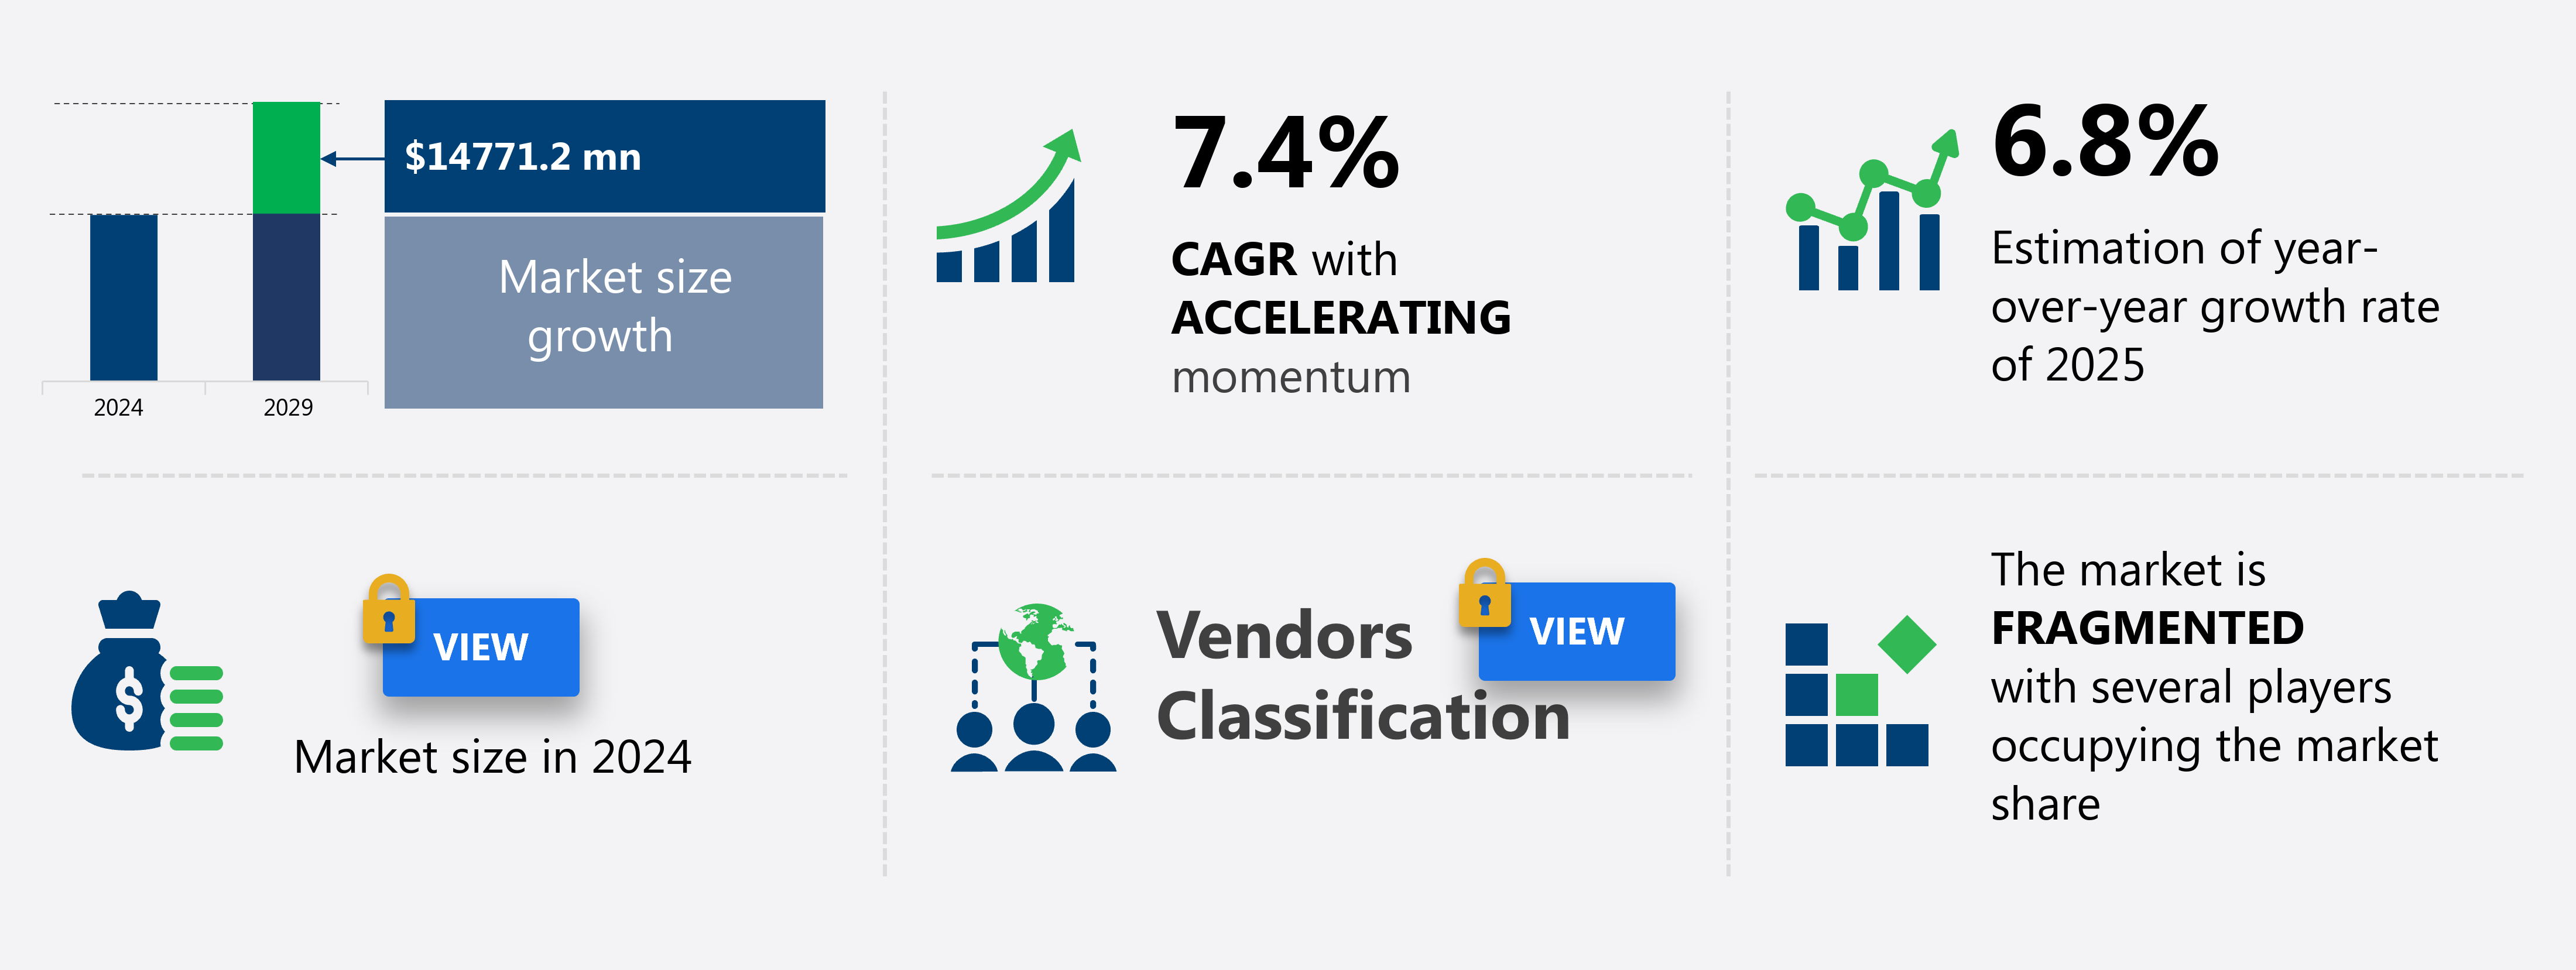
The breakfast cereals market size in North America is forecast to increase by USD 14.77 billion at a CAGR of 7.4% between 2024 and 2029.
-
The market is experiencing significant growth, driven by several key factors. Firstly, there is a growing consumer awareness and emphasis on health and wellness, leading to an increased demand for nutritious and convenient breakfast options. Additionally, the rising number of internet and e-commerce users in the region is driving sales, as consumers turn to online platforms for convenience and ease of purchase. Brands are responding by offering cereals fortified with essential vitamins and minerals.
-
However, fluctuations in raw material prices for cereals pose a challenge to market growth, as producers must balance costs with consumer demand for affordable and high-quality products. Wearable technology and health data analysis further facilitate personalized nutrition plans, ensuring optimal dosage recommendations. Overall, the market is expected to continue its growth trajectory, fueled by these trends and the evolving preferences of health-conscious consumers.
What will be the Size of the market During the Forecast Period?
-
Breakfast cereals have long been a staple in North American households, with consumers relying on them for convenience, nutrition, and variety. The market is driven by the health-conscious consumers' increasing demand for fiber, protein, and fortified ingredients. Brands offer a wide range of flavors and varieties to cater to diverse consumer preferences, including gluten-free and organic options. Sales of breakfast cereals continue to grow, fueled by the millennial and Generation Z demographics who prioritize convenience and sustainability. Consumers are increasingly seeking cereals with high fiber content, protein, and reduced sugar and calories. Brands are responding by offering cereals fortified with essential vitamins and minerals.
Distribution channels, including retailers and online platforms, play a significant role in the market's growth. The convenience of purchasing cereals online has gained popularity, especially during the pandemic. The market's future looks bright, with innovations in ingredients, flavors, and packaging expected to drive sales. Consumers are also demanding more transparency in the ingredients used in cereals, with a focus on natural and sustainable sourcing. As a result, brands are investing in research and development to meet these demands and stay competitive in the market.
How is this market segmented and which is the largest segment?
The market research report provides comprehensive data (region-wise segment analysis), with forecasts and estimates in "USD million" for the period 2025-2029, as well as historical data from 2019-2023 for the following segments.
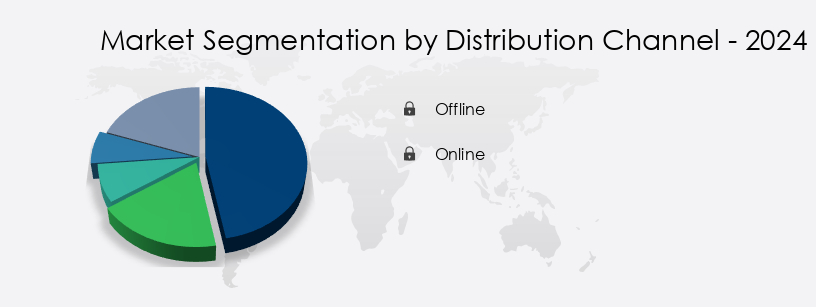
- Distribution Channel
- Offline
- Online
- Product
- Ready-to-eat (RTE)
- Hot cereals
- Price
- Mid-range
- Economy
- Premium
- Geography
- North America
- US
- Canada
- Mexico
- North America
By Distribution Channel Insights
- The offline segment is estimated to witness significant growth during the forecast period.
The North American breakfast cereals market is driven by the consumers' preference for convenient and nutritious breakfast options. Brands cater to this demand by offering a wide range of flavors, varieties, and health-focused ingredients, including gluten-free, organic, fiber, protein, and fortified options. Health-conscious consumers, particularly millennials and Generation Z, are increasingly prioritizing nutrition and fiber in their dietary habits. Sales of breakfast cereals continue to grow, fueled by advertising and brand loyalty. Pricing strategies and supply chain management play a significant role in the market's success. Offline distribution channels, including grocery stores, supermarkets, and convenience stores, are critical for market expansion.
These channels provide consumers with convenience, enabling them to compare cereal selections and make spontaneous purchases. Brick-and-mortar establishments offer strategic alliances, cooperative partnerships, and quick fulfillment, meeting the demand for on-the-go breakfast options. The processing of breakfast cereals involves raw materials, such as grains, fruits, and nuts, which undergo various stages of cooking, extrusion, and puffing to create the desired texture and taste. Quality control and food safety are essential in ensuring the shelf-life and safety of these products. Ingredients, such as sugar and calories, remain a concern for health-conscious consumers, leading to the development of low-sugar and low-calorie options.
Snacking on cereals has also become a popular trend, with consumers seeking convenient and portable options for between-meal snacks. Overall, the market continues to evolve, catering to the diverse needs and preferences of consumers.
Get a glance at the market report of share of various segments Request Free Sample
Market Dynamics
Our North America Breakfast Cereals Market researchers analyzed the data with 2024 as the base year, along with the key drivers, trends, and challenges. A holistic analysis of drivers will help companies refine their marketing strategies to gain a competitive advantage.
What are the key market drivers leading to the rise in adoption of North America Breakfast Cereals Market?
- Growing consumer awareness and emphasis on health and wellness is the key driver of the market. In North America, breakfast cereals have become a staple in households, with consumers increasingly prioritizing health and nutrition in their morning meals. Brands are responding to this trend by offering a wide range of cereals with additional health benefits. Whole grains, fiber, and essential vitamins are among the sought-after features, as they contribute to improved heart health, digestion, and overall well-being. The convenience of cereals, coupled with their long shelf-life and ease of distribution through retailers and online platforms, make them an attractive choice for health-conscious consumers. Millennials and Generation Z, in particular, are driving the demand for cereals that cater to their dietary preferences.
-
Gluten-free, organic, and non-GMO options are gaining popularity, as are cereals fortified with protein and fiber. Parents are also paying close attention to the nutritional content of cereals for their children. The market is characterized by intense competition among leading brands, with advertising and brand loyalty playing significant roles in consumer decision-making. Pricing strategies and supply chain management are crucial factors for companies looking to maintain a competitive edge. The processing and raw materials used in the production of cereals, as well as quality control and food safety measures, are essential for ensuring consumer trust and satisfaction. Snacking on cereals has also become a popular trend, especially among those with busy schedules. Convenience stores and other outlets have responded by stocking a variety of cereals, catering to the diverse preferences of consumers. Despite the convenience offered by cereals, some consumers are still concerned about sugar content and calories, leading brands to reformulate their products to address these concerns.
What are the market trends shaping the North America Breakfast Cereals Market?
- Increasing internet and e-commerce users driving breakfast cereal sales is the upcoming trend in the market. The North American breakfast cereals market is experiencing significant growth, with an increasing number of brands catering to health-conscious consumers. Sales of cereals are driven by the demand for convenience, fiber, protein, and fortified nutrients, making them a popular choice for various demographics, including millennials, generation Z, children, and parents. Consumers are increasingly seeking out gluten-free, organic, and high-fiber options, leading to the production of a wide range of flavors and varieties. Brand loyalty is a crucial factor in the breakfast cereals market, with advertising playing a significant role in consumer decision-making. Pricing and supply chain management are essential elements of the market, with raw materials and processing techniques influencing the shelf-life and quality control of the final product.
-
Food safety and dietary habits are also important considerations, with snacking and convenience stores emerging as new distribution channels. Retailers, both online and offline, are essential partners in the breakfast cereals market, ensuring the availability and accessibility of these products to consumers.
What challenges does North America Breakfast Cereals Market face during the growth?
- Fluctuations in raw material prices for cereals is a key challenge affecting the market growth. The market is witnessing significant growth due to increasing consumer preference for healthier food options. Brands are catering to this trend by offering a wide range of flavors, varieties, and ingredients, including gluten-free, organic, fiber-rich, and protein-fortified options. Health-conscious consumers, particularly millennials and Generation Z, are driving sales, with a focus on nutrition and convenience. However, pricing remains a challenge, as consumers seek affordable options. Companies are addressing this issue by entering into long-term contracts with suppliers of raw materials, such as flour and sugar, to mitigate price fluctuations. Adverse weather conditions and natural disasters, which can impact the quality and availability of raw materials, pose a challenge to the supply chain.
-
Brand loyalty is a key factor in consumer decision-making, with effective advertising and quality control playing crucial roles. Retailers, both online and offline, are essential distribution channels, while convenience stores offer an alternative outlet for cereal sales. Snacking on cereals has also emerged as a trend, expanding the market beyond traditional breakfast consumption. The processing and shelf-life of cereals are critical factors in maintaining food safety and quality.
Exclusive Customer Landscape
The market forecasting report includes the adoption lifecycle of the market, covering from the innovator's stage to the laggard's stage. It focuses on adoption rates in different regions based on penetration. Furthermore, the market report also includes key purchase criteria and drivers of price sensitivity to help companies evaluate and develop their market growth analysis strategies.
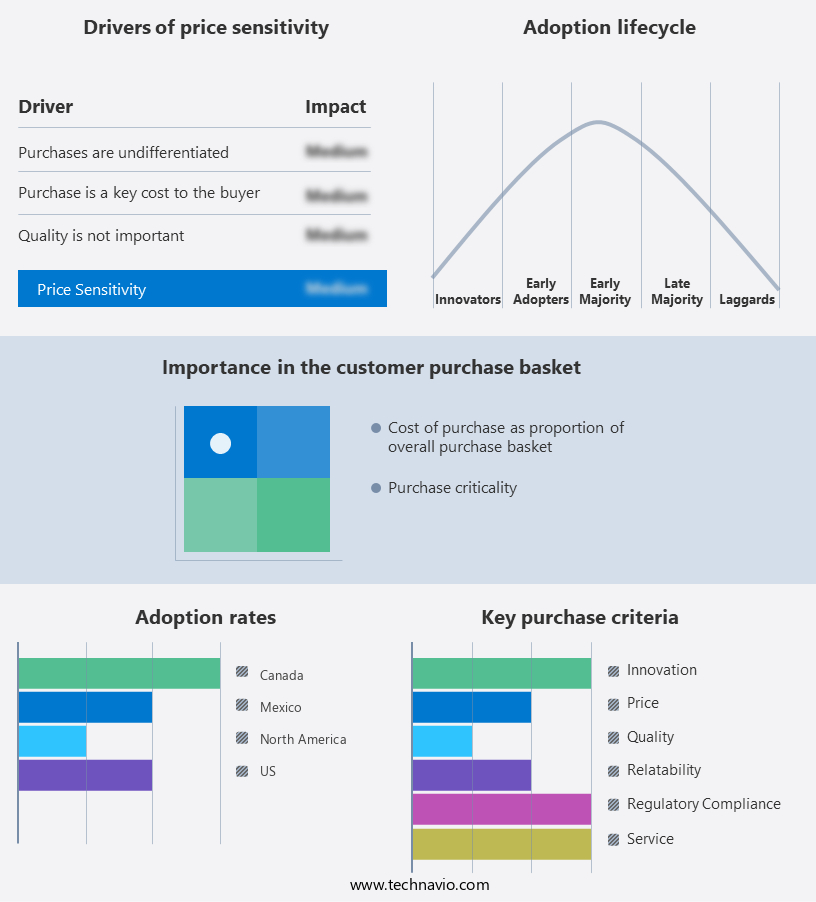
Customer Landscape
Key Companies & Market Insights
Companies are implementing various strategies, such as strategic alliances, market forecast , partnerships, mergers and acquisitions, geographical expansion, and product/service launches, to enhance their presence in the market.
Associated British Foods Plc - The company offers breakfast cereals under its brands Jordans, Dorset Cereals, and RYVITA.
The market research and growth report includes detailed analyses of the competitive landscape of the market and information about key companies, including:
- Associated British Foods Plc
- B and G Foods Inc.
- Bobs Red Mill Natural Foods Inc.
- Calbee Inc.
- Food For Life Baking Co. Inc.
- General Mills Inc.
- Kellanova
- Manischewitz Co.
- Natures Path Foods
- Nestle SA
- New England Natural Bakers
- Post Holdings Inc.
- The Quaker Oats Company
- The Simply Good Foods Co.
- Three Wishes Cereal
- Weetabix Ltd.
Qualitative and quantitative analysis of companies has been conducted to help clients understand the wider business environment as well as the strengths and weaknesses of key market players. Data is qualitatively analyzed to categorize companies as pure play, category-focused, industry-focused, and diversified; it is quantitatively analyzed to categorize companies as dominant, leading, strong, tentative, and weak.
Recent Development and News in Breakfast Cereals Market In North America
- In January 2024, General Mills, a leading breakfast cereals manufacturer, introduced a new line of plant-based cereals under its Nature Valley brand. The new product line, named "Plant Protein Power," aims to cater to the growing demand for plant-based food options among health-conscious consumers (General Mills Press Release).
- In March 2025, Quaker Oats, a subsidiary of PepsiCo, partnered with the American Heart Association to launch a new line of heart-healthy oatmeal products. The collaboration includes the development of new recipes and marketing efforts to promote the health benefits of oatmeal (PepsiCo Press Release).
- In May 2024, Kellogg Company announced the acquisition of RXBAR, a protein bar manufacturer, for approximately USD 600 million. The acquisition is expected to strengthen Kellogg's presence in the growing protein snacks market and expand its product offerings (Reuters).
Research Analyst Overview
The market is a significant sector, driven by consumers' increasing preference for convenient, nutritious, and flavorful options. Brands cater to various dietary needs, offering gluten-free, organic, and fortified cereals. Health-conscious consumers, especially millennials and Generation Z, are prioritizing fiber and protein in their breakfast choices. Sales of breakfast cereals continue to grow due to their health benefits, with fiber and protein being essential ingredients. Consumers are also drawn to cereals with low sugar and calorie content. Varieties catering to children and parents are popular, with brands investing in advertising and brand loyalty through promotions and partnerships.
Convenience plays a crucial role in the market, with cereals being easily available at retailers, online, and convenience stores. The supply chain is critical, with raw materials, processing, shelf-life, and quality control being essential factors. Food safety and adherence to dietary habits, such as snacking, are also key considerations for brands. Brand loyalty is influenced by pricing, with consumers seeking affordable options without compromising on nutrition and taste. The market is expected to continue growing, with innovation in flavors, varieties, and ingredients driving sales.
|
Market Scope |
|
|
Report Coverage |
Details |
|
Page number |
180 |
|
Base year |
2024 |
|
Historic period |
2019-2023 |
|
Forecast period |
2025-2029 |
|
Growth momentum & CAGR |
Accelerate at a CAGR of 7.4% |
|
Market growth 2025-2029 |
USD 14.77 Billion |
|
Market structure |
Fragmented |
|
YoY growth 2024-2025(%) |
6.8 |
|
Key countries |
US, Canada, and Mexico |
|
Competitive landscape |
Leading Companies, Market Positioning of Companies, Competitive Strategies, and Industry Risks |
What are the Key Data Covered in this Market Research and Growth Report?
- CAGR of the market during the forecast period
- Detailed information on factors that will drive the market growth and forecasting between 2025 and 2029
- Precise estimation of the size of the market and its contribution of the market in focus to the parent market
- Accurate predictions about upcoming market growth and trends and changes in consumer behaviour
- Growth of the market across North America
- Thorough analysis of the market's competitive landscape and detailed information about companies
- Comprehensive analysis of factors that will challenge the growth of market companies
We can help! Our analysts can customize this market research report to meet your requirements. Get in touch
 RIA -
RIA - 
