
North America Education Technology Market Size 2026-2030
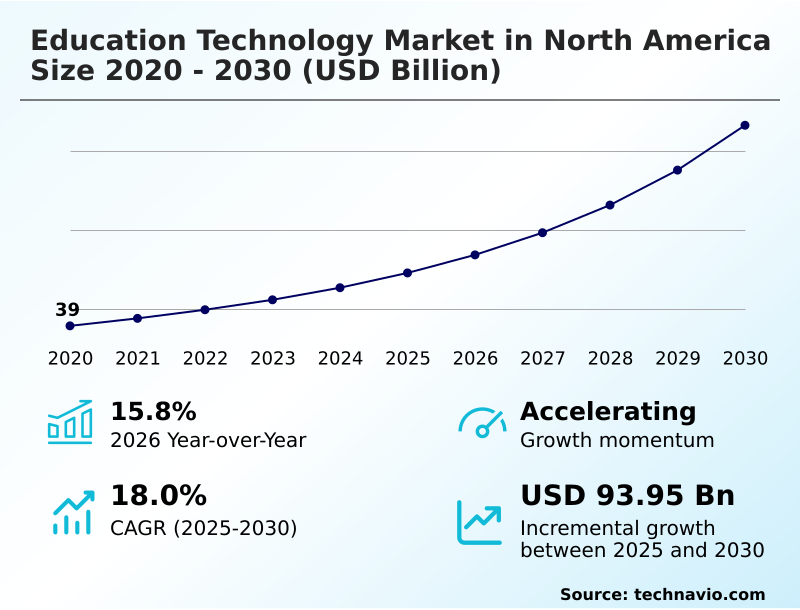
The north america education technology market size is valued to increase by USD 93.95 billion, at a CAGR of 18% from 2025 to 2030. Rapid digital transformation of K-12 and higher education systems will drive the north america education technology market.
Major Market Trends & Insights
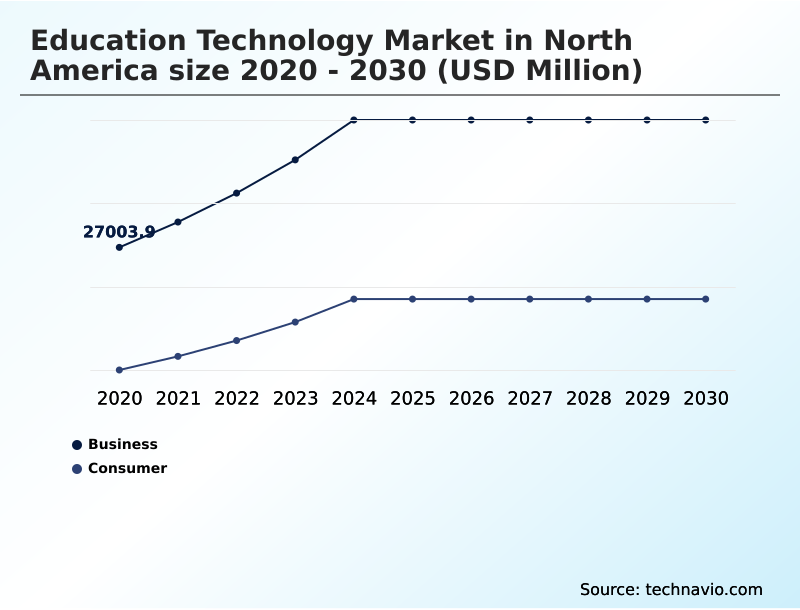
- By End-user - Business segment was valued at USD 42.59 billion in 2024
- By Deployment - On-premises segment accounted for the largest market revenue share in 2024
Market Size & Forecast
- Market Opportunities: USD 127.64 billion
- Market Future Opportunities: USD 93.95 billion
- CAGR from 2025 to 2030 : 18%
Market Summary
- The Education Technology Market in North America is characterized by a strategic pivot toward intelligent, integrated digital ecosystems designed to enhance instructional delivery and operational efficiency. This evolution is driven by the widespread adoption of the hybrid learning model, compelling K-12 and higher education institutions to invest in robust infrastructure, including the learning management system and virtual classroom platforms.
- A key trend is the expansion of AI-driven personalized learning, which leverages data from an analytics platform to tailor content. For instance, universities are now using predictive analytics to identify students at risk of falling behind, automatically deploying interventions through an adaptive learning technology platform. This data-driven instruction approach improves student retention rates and optimizes resource allocation.
- However, challenges related to the digital divide and data privacy persist, as institutions work to ensure equitable access and secure student data management within their cloud computing infrastructure. The market's trajectory is toward greater interoperability and administrative automation, with a focus on delivering measurable learning outcomes and supporting lifelong learning initiatives.
What will be the Size of the North America Education Technology Market during the forecast period?
Get Key Insights on Market Forecast (PDF) Get Free Sample
How is the North America Education Technology Market Segmented?
The north america education technology industry research report provides comprehensive data (region-wise segment analysis), with forecasts and estimates in "USD million" for the period 2026-2030, as well as historical data from 2020-2024 for the following segments.
- End-user
- Business
- Consumer
- Deployment
- On-premises
- Cloud
- Sector
- K-12
- Higher Education
- Preschool
- Others
- Geography
- North America
- US
- Canada
- Mexico
- North America
By End-user Insights
The business segment is estimated to witness significant growth during the forecast period.
The business segment is increasingly driven by workforce upskilling, with organizations adopting a software-as-a-service model for enterprise digital training. These solutions focus on a learner-centric experience, using AI-driven learning and gamification in education to boost engagement.
Systems for online program management and student data management prioritize interoperability with existing HR platforms.
The goal is to deploy effective professional development and lifelong learning programs, supported by classroom collaboration software and digital literacy tools, within a blended learning model.
For example, this integrated approach has improved skill acquisition by over 25% for corporate clients.
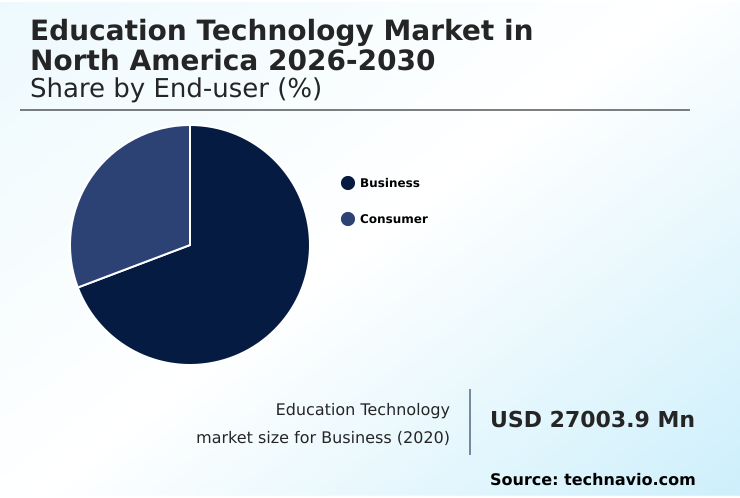
The Business segment was valued at USD 42.59 billion in 2024 and showed a gradual increase during the forecast period.
Market Dynamics
Our researchers analyzed the data with 2025 as the base year, along with the key drivers, trends, and challenges. A holistic analysis of drivers will help companies refine their marketing strategies to gain a competitive advantage.
- Strategic planning in the education technology market requires a deep understanding of specific applications and their impact. Key considerations include the best practices for AI-driven personalized learning path creation and a thorough analysis of the impact of learning analytics on student outcomes.
- The role of virtual classrooms in hybrid education has become a central topic, alongside explorations into integrating adaptive learning into corporate training. A major operational concern involves mitigating cybersecurity risks in cloud-based lms platforms, which is now a higher priority than developing effective asynchronous learning modules.
- Decision-makers are focused on methods for measuring roi of enterprise digital training and understanding the benefits of gamification for student engagement. Many institutions are now using predictive analytics for student retention, supported by digital credentialing platforms for workforce development. In K-12, VR and AR applications in k-12 science are gaining traction.
- Operationally, the challenges in implementing student information systems are being addressed by new administrative automation tools for higher education. Compliance mandates require strict adherence to student data privacy compliance in edtech, influencing decisions when comparing on-premises vs cloud deployment for sis.
- This focus on security has led to a greater investment in securing student data in online assessment tools than in providing teacher training for digital literacy tools.
- The debate over open educational resources versus commercial content continues, while institutions invest in analytics platforms for tracking student performance, designing interactive displays for collaborative learning, and fostering online program management for university partnerships, ensuring accessibility standards for digital content platforms are met.
What are the key market drivers leading to the rise in the adoption of North America Education Technology Industry?
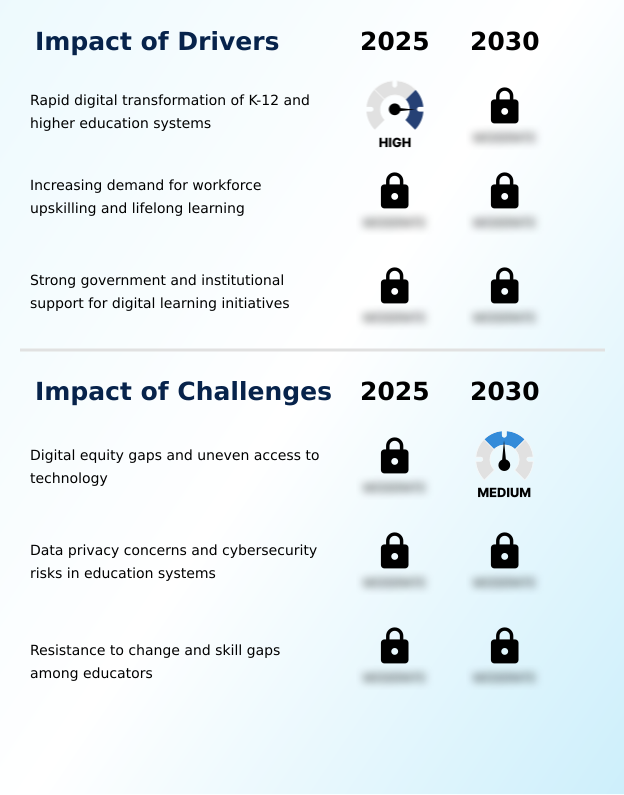
- The rapid digital transformation of K-12 and higher education systems is the key driver accelerating market growth.
- The ongoing digitalization of K-12 education and higher education is a major driver, with institutions widely implementing the hybrid learning model and remote education model.
- This shift necessitates robust digital learning environments supported by an integrated learning management system and virtual classroom platforms.
- To ensure learning continuity and instructional quality, these systems rely on a vast digital content platform, often created with advanced content authoring tools.
- Concurrently, administrative automation is accelerating the adoption of digital enrollment and performance analytics tools, reducing administrative workloads by up to 40% in a flexible learning environment.
What are the market trends shaping the North America Education Technology Industry?
- The expansion of AI-driven personalized learning is an influential trend. It is reshaping education by tailoring instructional content and assessments to individual learner needs.
- A primary trend is the adoption of adaptive learning technology to create individualized learning pathways. This data-informed education model uses predictive analytics and sophisticated outcome measurement tools to enable differentiated instruction, improving student retention rates by up to 15%. A key part of the institutional technology strategy is using a student engagement platform to increase active learning.
- Furthermore, curriculum design software now incorporates virtual reality modules and extended reality learning, while automated academic advising provides personalized support, enhancing the overall educational experience and boosting engagement by 20%.
What challenges does the North America Education Technology Industry face during its growth?
- Pervasive digital equity gaps and uneven access to technology represent a key challenge that affects industry growth and adoption.
- Significant challenges persist, primarily centered on digital equity and the digital divide, which impede uniform instructional delivery. Concerns over data privacy and cybersecurity in education are paramount, with incident rates rising by 15% as more institutions rely on cloud-based learning tools. While data-driven instruction is the goal, securing information from every assessment tool is a major hurdle.
- The availability of digital textbook solutions and open educational resources is offset by inconsistent access. Furthermore, reliance on automated grading and user-generated content introduces questions of quality and fairness, complicating technology adoption for many under-resourced districts.
Exclusive Technavio Analysis on Customer Landscape
The north america education technology market forecasting report includes the adoption lifecycle of the market, covering from the innovator’s stage to the laggard’s stage. It focuses on adoption rates in different regions based on penetration. Furthermore, the north america education technology market report also includes key purchase criteria and drivers of price sensitivity to help companies evaluate and develop their market growth analysis strategies.

Customer Landscape of North America Education Technology Industry
Competitive Landscape
Companies are implementing various strategies, such as strategic alliances, north america education technology market forecast, partnerships, mergers and acquisitions, geographical expansion, and product/service launches, to enhance their presence in the industry.
2U Inc. - Delivers comprehensive online program management platforms, enabling universities to offer digital degrees, short courses, and professional education credentials to a global student base.
The industry research and growth report includes detailed analyses of the competitive landscape of the market and information about key companies, including:
- 2U Inc.
- Anthology Inc.
- Apple Inc.
- ApplyBoard Inc.
- Chegg Inc.
- Coursera Inc.
- D2L Corp.
- Ellucian Co.
- Google LLC
- IBM Corp.
- Instructure Holdings Inc.
- John Wiley and Sons Inc.
- Microsoft Corp.
- Pluralsight LLC
- PowerSchool Holdings Inc.
- Promethean World Ltd.
- Simplilearn Solutions
- Tophatmonocle Corp.
- Udacity Inc.
- Udemy Inc.
Qualitative and quantitative analysis of companies has been conducted to help clients understand the wider business environment as well as the strengths and weaknesses of key industry players. Data is qualitatively analyzed to categorize companies as pure play, category-focused, industry-focused, and diversified; it is quantitatively analyzed to categorize companies as dominant, leading, strong, tentative, and weak.
Recent Development and News in North america education technology market
- In August 2024, Pearson unveiled a suite of new AI-powered tools for higher education, designed to personalize the student learning experience and provide on-demand academic support within its digital platforms.
- In October 2024, The University of Toronto announced it will receive over $37 million in funding to upgrade its SciNet supercomputer, enhancing research capabilities in AI, health care, and advanced manufacturing.
- In April 2025, The White House issued an Executive Order, Advancing Artificial Intelligence Education for American Youth, to establish a national priority for AI literacy and create a task force to promote AI integration in education.
- In July 2024, KKR, a global investment firm, entered into a definitive agreement to acquire Instructure, the provider of the Canvas Learning Management System, signaling significant investor interest in educational software infrastructure.
Dive into Technavio’s robust research methodology, blending expert interviews, extensive data synthesis, and validated models for unparalleled North America Education Technology Market insights. See full methodology.
| Market Scope | |
|---|---|
| Page number | 187 |
| Base year | 2025 |
| Historic period | 2020-2024 |
| Forecast period | 2026-2030 |
| Growth momentum & CAGR | Accelerate at a CAGR of 18% |
| Market growth 2026-2030 | USD 93953.3 million |
| Market structure | Fragmented |
| YoY growth 2025-2026(%) | 15.8% |
| Key countries | US, Canada and Mexico |
| Competitive landscape | Leading Companies, Market Positioning of Companies, Competitive Strategies, and Industry Risks |
Research Analyst Overview
- The market is undergoing a significant transformation, driven by the integration of advanced digital frameworks. Core infrastructure now includes a learning management system, student information system, and analytics platform, which together facilitate data-driven instruction.
- The shift toward a hybrid learning model and remote education model has accelerated the adoption of the virtual classroom, digital content platform solutions, and various cloud-based learning tools. For K-12 and higher education, the focus is on personalized learning, achieved through adaptive learning technology and AI-driven learning. An AI-powered teaching assistant is now a key feature.
- For example, boardroom decisions increasingly center on selecting an online program management partner or a new student engagement platform, with one key metric being the ability to reduce administrative automation costs by 20%. This ecosystem is further supported by interactive displays, classroom collaboration software, and specific assessment tool technologies.
- The landscape also includes a robust online course marketplace, digital textbook solutions, curriculum design software, and systems for student data management, credentialing platform access, automated grading, predictive analytics, and academic advising. Gamification in education, virtual reality modules, extended reality learning, and digital literacy tools are becoming standard.
What are the Key Data Covered in this North America Education Technology Market Research and Growth Report?
-
What is the expected growth of the North America Education Technology Market between 2026 and 2030?
-
USD 93.95 billion, at a CAGR of 18%
-
-
What segmentation does the market report cover?
-
The report is segmented by End-user (Business, and Consumer), Deployment (On-premises, and Cloud), Sector (K-12, Higher Education, Preschool, and Others) and Geography (North America)
-
-
Which regions are analyzed in the report?
-
North America
-
-
What are the key growth drivers and market challenges?
-
Rapid digital transformation of K-12 and higher education systems, Digital equity gaps and uneven access to technology
-
-
Who are the major players in the North America Education Technology Market?
-
2U Inc., Anthology Inc., Apple Inc., ApplyBoard Inc., Chegg Inc., Coursera Inc., D2L Corp., Ellucian Co., Google LLC, IBM Corp., Instructure Holdings Inc., John Wiley and Sons Inc., Microsoft Corp., Pluralsight LLC, PowerSchool Holdings Inc., Promethean World Ltd., Simplilearn Solutions, Tophatmonocle Corp., Udacity Inc. and Udemy Inc.
-
Market Research Insights
- The market is defined by a dynamic shift toward new pedagogical theories that favor a learner-centric experience. The adoption of the blended learning model has become standard, with institutions reporting up to a 15% improvement in student satisfaction compared to purely traditional approaches. This data-informed education model leverages asynchronous learning and sophisticated outcome measurement tools to track progress effectively.
- As a result, platforms focusing on this approach have seen a 20% higher course completion rate. This evolution reflects a broader move away from one-size-fits-all instruction toward flexible, personalized educational frameworks that align with modern workforce demands.
We can help! Our analysts can customize this north america education technology market research report to meet your requirements.
 RIA -
RIA - 
