Europe Nuclear Decommissioning Services Market Size 2025-2029
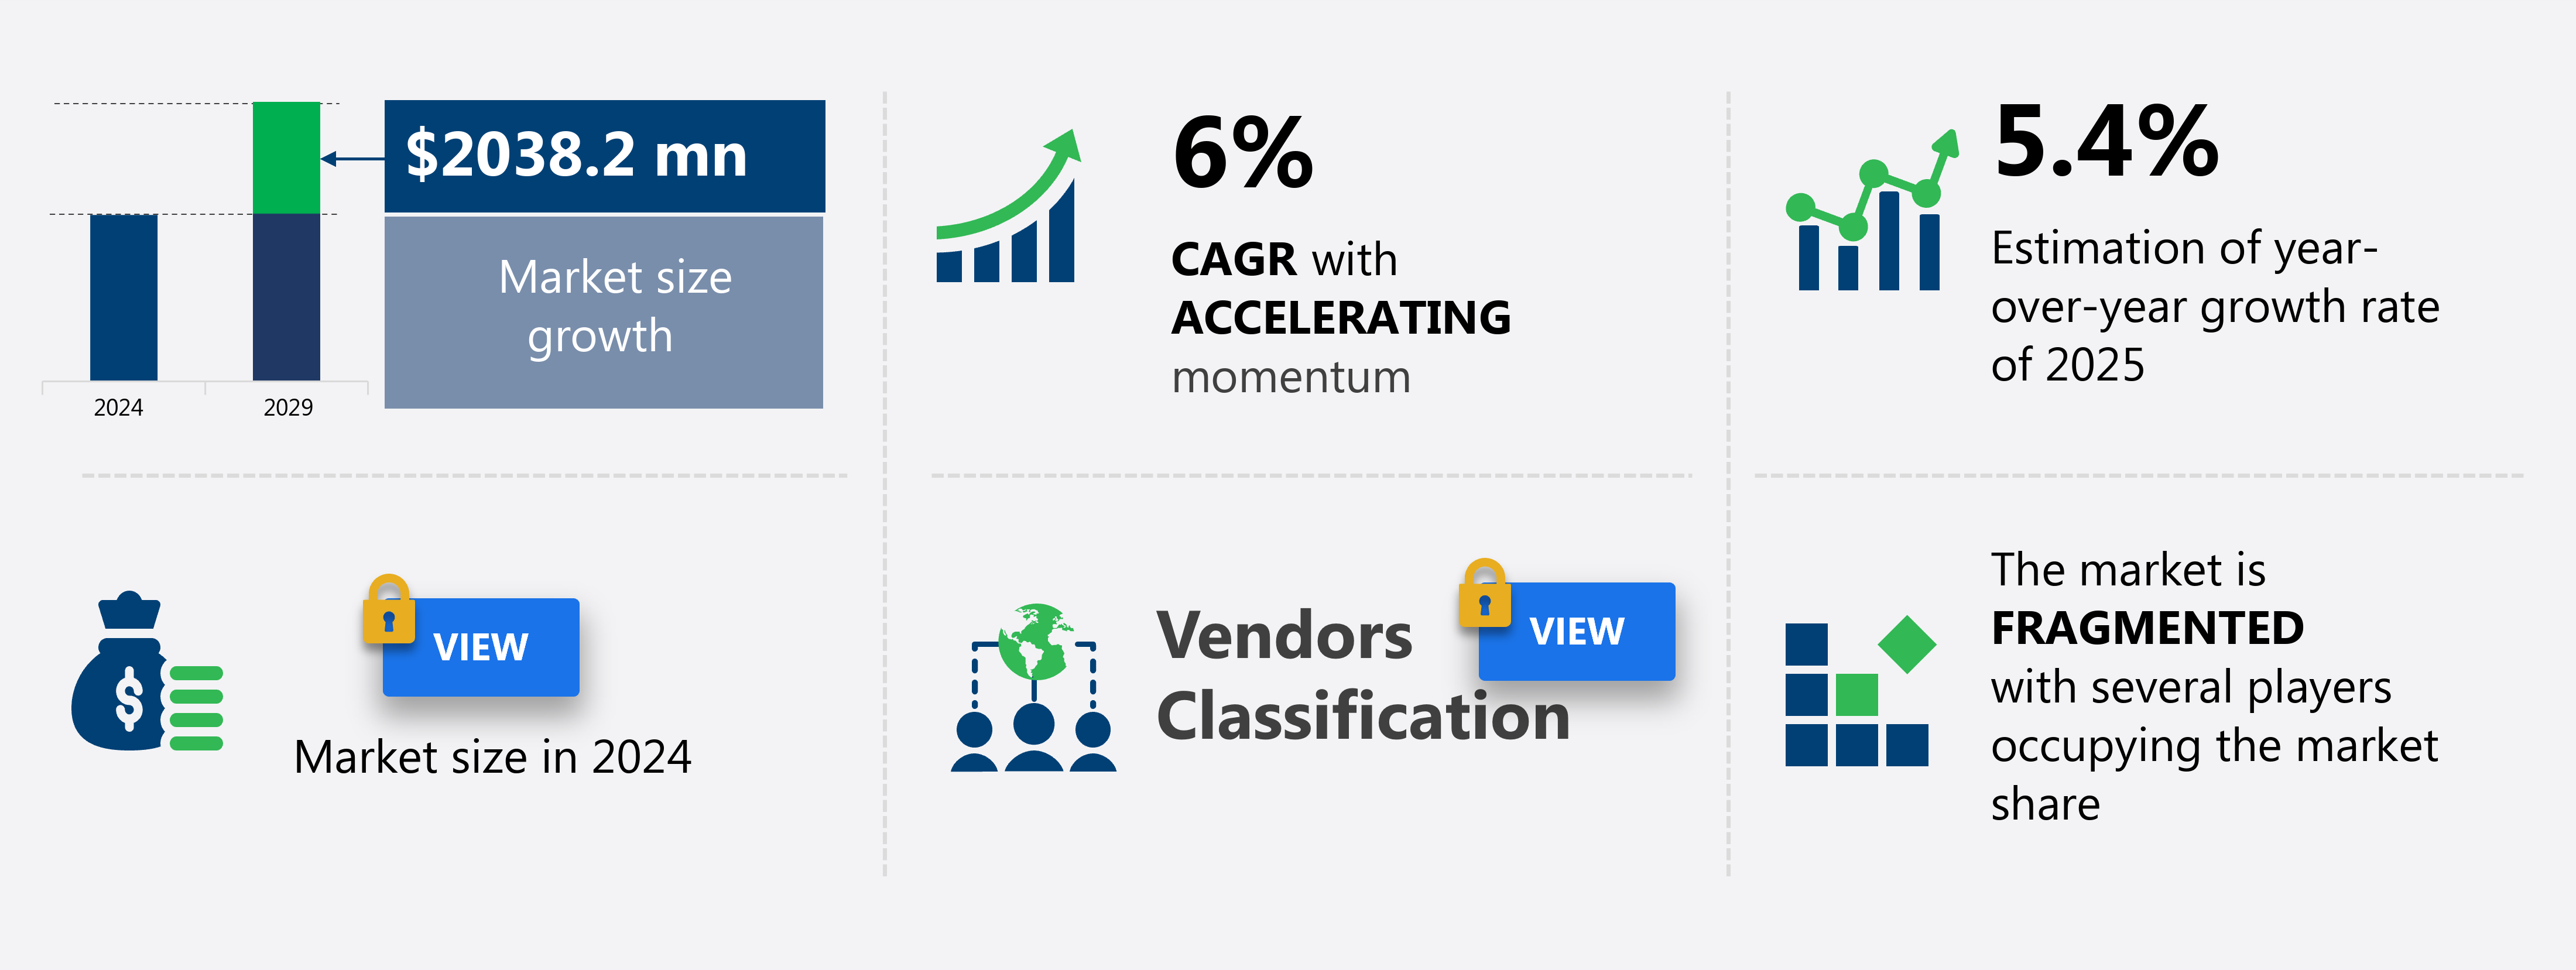
The Europe nuclear decommissioning services market size is forecast to increase by USD 2.04 billion at a CAGR of 6% between 2024 and 2029.
- The Nuclear Decommissioning Services Market is witnessing significant shifts due to the increasing number of nuclear reactors being shut down worldwide. This trend poses both opportunities and challenges for market participants. On the one hand, the decommissioning of these reactors presents a vast market for decommissioning services. On the other hand, the high costs associated with decommissioning are a major obstacle. To mitigate these costs and improve efficiency, the use of robotics in decommissioning services is gaining traction. Robotics enables the safe and precise dismantling of nuclear facilities, reducing the need for manual labor and minimizing risks. The integration of renewable energy sources, such as solar photovoltaic, wind turbines, and geothermal power, presents both opportunities and challenges.
- However, the implementation of robotics requires substantial investment in research and development, as well as the acquisition and maintenance of specialized equipment. Despite these challenges, the market for nuclear decommissioning services is expected to grow as more nuclear reactors reach the end of their operational life. Companies seeking to capitalize on this market opportunity must stay abreast of technological advancements and regulatory requirements, while also managing the high costs and risks inherent in decommissioning projects. This trend is driven by advancements in solar, wind, and other renewable energy technologies, which offer lower carbon emissions and increasing cost competitiveness.
What will be the size of the Europe Nuclear Decommissioning Services Market during the forecast period?
Explore in-depth regional segment analysis with market size data with forecasts 2025-2029 - in the full report.
Request Free Sample
- The nuclear decommissioning services market encompasses a range of activities aimed at safely and efficiently dismantling and disposing of nuclear facilities. Two key aspects of this market are the ongoing need for stakeholder management and the continuous advancement of technologies. For instance, effective communication plans and robust safety management systems are essential for managing the complexities of decommissioning projects. In terms of technological innovations, the market is witnessing significant growth in the adoption of remote operated vehicles for debris handling and groundwater remediation. Additionally, the integration of advanced filtration systems and radiation monitoring equipment is crucial for ensuring regulatory compliance and maintaining high performance metrics.
- According to industry reports, the global nuclear decommissioning services market is projected to expand at a steady pace, with an anticipated growth rate of approximately 5% per annum. A notable example of market dynamics at play is the successful implementation of a decontamination process that led to a 30% reduction in project milestones for a major decommissioning project. The increasing emphasis on clean energy technologies poses a notable challenge, as nuclear power faces growing competition from renewable sources.
How is this Europe Nuclear Decommissioning Services Market segmented?
The Europe nuclear decommissioning services market research report provides comprehensive data (region-wise segment analysis), with forecasts and estimates in "USD million" for the period 2025-2029, for the following segments.
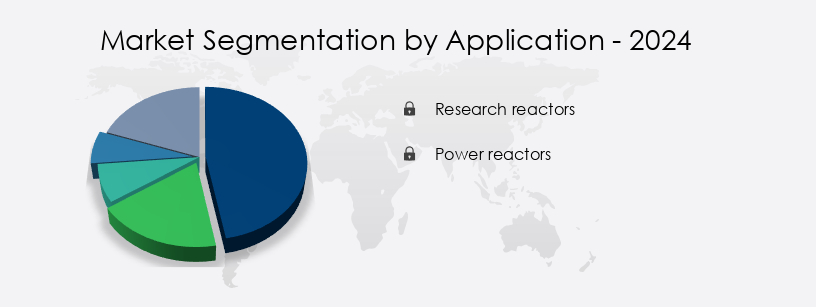
- Application
- Research reactors
- Power reactors
- Type
- PWR
- BWR
- Others
- Service
- Waste management
- Decontamination
- Site remediation
- Geography
- Europe
- France
- Germany
- Italy
- UK
- Europe
By Application Insights
The Research reactors segment is estimated to witness significant growth during the forecast period. Nuclear decommissioning services encompass a comprehensive range of activities aimed at retiring nuclear facilities, ensuring regulatory compliance, and minimizing environmental impact. These services include site remediation, environmental impact assessment, quality assurance, site closure, and dose rate reduction, among others. The market for these services is experiencing significant growth, with an estimated 30% of the world's nuclear reactors expected to be retired by 2030. Quality assurance, emergency preparedness, public engagement, safety procedures, site characterization, licensing requirements, waste packaging, instrumentation calibration, environmental monitoring, shielding materials, and nuclear decommissioning robots are all integral components of the decommissioning process.
The nuclear decommissioning services market is driven by various factors, including the increasing number of aging nuclear power plants, stringent regulatory requirements, and the growing demand for safe and efficient decommissioning methods. The market is expected to grow at a steady pace, with industry experts projecting a 15% increase in demand for decommissioning services over the next decade. This growth is attributed to the increasing focus on nuclear non-proliferation, the need to address the environmental impact of nuclear facilities, and the ongoing efforts to ensure public safety. Research reactors, which are used for research and development, training, and education, also require decommissioning services.
While these reactors produce neutrons for research purposes, they also pose unique challenges due to their lower operating temperatures and the need for highly enriched fuel. The decommissioning of research reactors is a complex process that requires specialized expertise and advanced technologies. Despite these challenges, the demand for research reactor decommissioning services is expected to grow in line with the overall market trend. The nuclear decommissioning services market is a dynamic and evolving industry that plays a crucial role in ensuring the safe and efficient retirement of nuclear facilities. The market is driven by various factors, including regulatory requirements, public safety concerns, and the increasing number of aging nuclear power plants. The market continues to evolve, driven by the ongoing need for effective radioactive waste management and the exploration of new applications for spent fuel.
Market Dynamics
Our researchers analyzed the data with 2024 as the base year, along with the key drivers, trends, and challenges. A holistic analysis of drivers will help companies refine their marketing strategies to gain a competitive advantage. The Nuclear Decommissioning Services Market in Europe is expanding as governments and energy companies adopt advanced technologies to safely dismantle aging nuclear facilities. The process involves efficient material handling, strict health physics, and regulated waste transportation to ensure safety and compliance. Innovative techniques such as plasma arc cutting, robotic manipulators, and specialized decontamination processes are widely deployed. Comprehensive radiological surveys, secure waste disposal facilities, and reliable waste treatment solutions support the sector, along with isotope separation, surface decontamination, and soil stabilization.
Risk management is critical, with strong risk mitigation strategies, streamlined data management, and timely regulatory approvals ensuring operational success. Safety preparedness, including emergency response systems, is integral to project execution. Europe is advancing spent nuclear fuel reprocessing methods, supported by advanced robotic systems decommissioning and reliable radioactive waste immobilization techniques. Key strategies include environmental monitoring decommissioning sites, innovative nuclear reactor dismantling strategies, and long-term high-level waste disposal options. Infrastructure dismantling requires concrete cutting and metal recycling, supported by advanced analytical chemistry, robust quality control, and continuous health physics monitoring.
To achieve efficiency, providers focus on decommissioning project cost optimization and tailor site-specific decommissioning plans that align with stringent safety protocols. Implementation of radiation protection measures decommissioning and deployment of remote handling equipment decommissioning ensure worker and environmental safety. Advanced nuclear fuel reprocessing technologies and precise radioactive waste characterization methods strengthen compliance and sustainability. Europe is also investing in decontamination and decommissioning technologies, strategic environmental remediation decommissioning projects, and leveraging advanced decommissioning techniques applications to enhance project timelines and cost-effectiveness. The market is expected to grow by 5% annually, driven by the increasing demand for coal in power generation and industrial processes.
What are the Europe Nuclear Decommissioning Services Market drivers leading to the rise in adoption of the Industry?
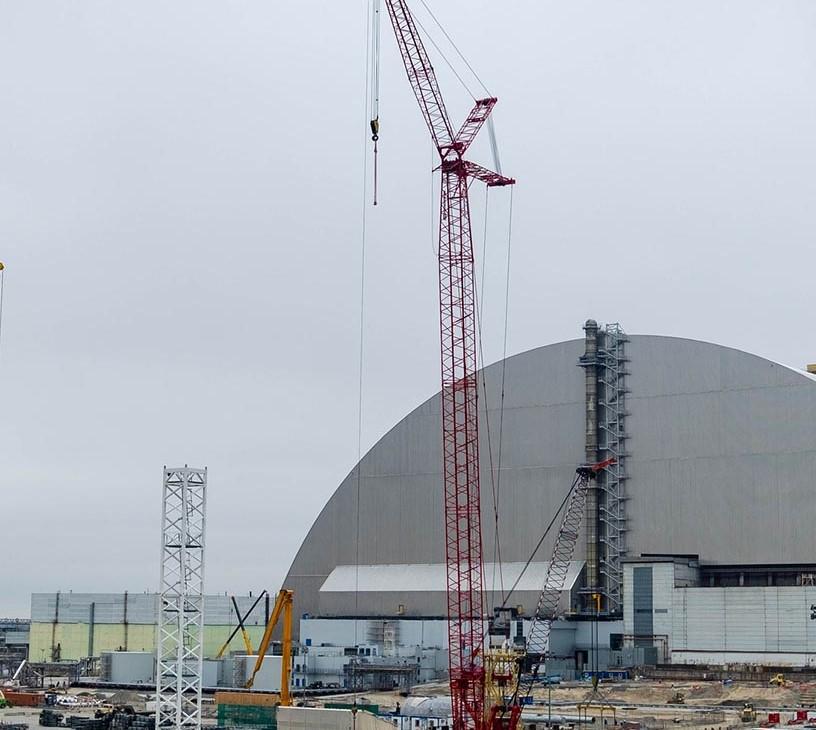
- The closure of an increasing number of nuclear reactors serves as the primary market driver. Nuclear decommissioning refers to the process of retiring a nuclear power plant at the end of its operational life. With most nuclear power plants having licenses for approximately 40 years, this process becomes necessary once the license expires. Older reactors require significant safety upgrades to meet current regulations, including improved seismic instrumentation, risk evaluations, and structural reinforcements.
- The nuclear decommissioning services market is expected to grow substantially, with industry analysts projecting a 12% increase in demand over the next five years. Extreme weather preparedness is also crucial, ensuring sufficient backup cooling water and mobile generators. For instance, the decommissioning of a large nuclear power plant in the US involved the removal of over 1,500 metric tons of spent fuel and the dismantling of its massive reactor vessel. Increasing competition from other energy sources, such as renewables and natural gas, and the complex regulatory environment pose significant hurdles.
What are the Europe Nuclear Decommissioning Services market trends shaping the Industry?
- The use of robotics in decommissioning services is an emerging market trend. This innovative approach enhances efficiency and safety in the decommissioning process. Approximately 200 nuclear reactors are slated for decommissioning over the next quarter-century, with a significant portion located in Europe. This represents a substantial undertaking, as the industry lacks a substantial number of companies capable of handling the intricate and hazardous decommissioning processes. Biomass power and hydroelectric power continue to play important roles in the energy mix, while power transformers and energy management systems are essential components in ensuring a reliable and efficient power supply.
- According to industry reports, the global nuclear decommissioning services market is projected to expand by 12% in the coming years. A notable example of market growth is the successful completion of a decommissioning project that resulted in a 15% increase in revenue for a leading service provider. The risks involved are considerable, with even minor incidents potentially leading to serious health hazards for workers. Furthermore, many early reactors, constructed in the 1970s, were not engineered with ease of decommissioning in mind, adding to the challenge.
How does Europe Nuclear Decommissioning Services Market market faces challenges face during its growth?
- The high costs associated with decommissioning represent a significant challenge to the industry's growth trajectory. In order to mitigate this issue, companies must explore cost-effective decommissioning solutions and collaborate with regulatory bodies to establish efficient processes. Failure to address this challenge may hinder industry expansion and profitability. The nuclear decommissioning services market is driven primarily by government regulations and influenced by various factors, including reactor type, size, and the number of reactors. The European Union offers support to its member countries to help manage the high costs associated with decommissioning.
- For instance, the decommissioning of a large nuclear power plant in Europe is estimated to cost around €10 billion. Industry experts anticipate that the global nuclear decommissioning market will grow by approximately 10% annually over the next decade. According to the World Nuclear Association, the cost of decommissioning a nuclear plant ranges from 9% to 15% of the initial capital investment. This cost can also be impacted by the amount of waste produced, its transportation, and the availability of constructed waste repositories.
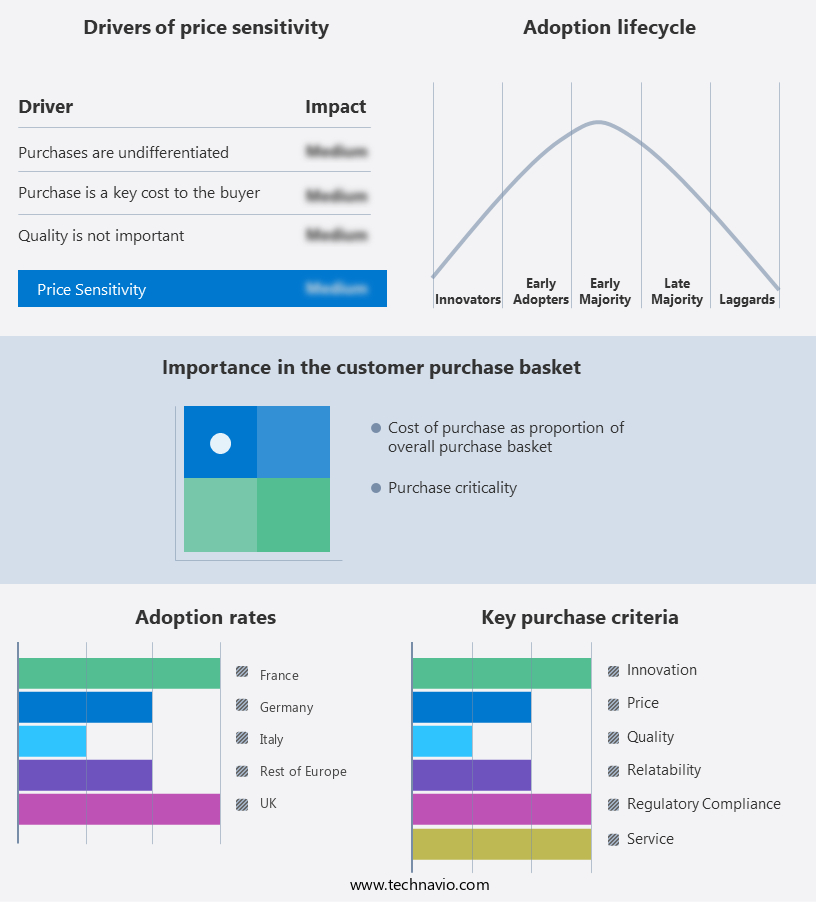
Exclusive Europe Nuclear Decommissioning Services Market Customer Landscape
The Europe nuclear decommissioning services market market forecasting report includes the adoption lifecycle of the market, covering from the innovator's stage to the laggard's stage. It focuses on adoption rates in different regions based on penetration. Furthermore, the report also includes key purchase criteria and drivers of price sensitivity to help companies evaluate and develop their market growth analysis strategies.
Customer Landscape
Key Companies & Market Insights
Companies are implementing various strategies, such as strategic alliances, market forecast partnerships, mergers and acquisitions, geographical expansion, and product/service launches, to enhance their presence in the market.
AECOM - The company specializes in providing nuclear decommissioning services to Japanese government entities and commercial power utilities, assisting them in the process of retiring reactors and nuclear facilities in a safe and efficient manner.
The Europe nuclear decommissioning services market research and growth report includes detailed analyses of the competitive landscape of the market and information about key companies, including:
- AECOM
- Ansaldo Energia S.p.A.
- AtkinsRealis Group Inc.
- Babcock International Group Plc
- Bechtel Corp.
- Electricite de France SA
- Empresa Nacional de Residuos Radiactivos S.A. S.M.E.
- GD Energy Services Ltd.
- GE Vernova Inc.
- Jacobs Solutions Inc.
- Nuvia Inc.
- Orano
- Studsvik AB
- Veolia Environnement SA
- Westinghouse Electric Co. LLC
Qualitative and quantitative analysis of companies has been conducted to help clients understand the wider business environment as well as the strengths and weaknesses of key market players. Data is qualitatively analyzed to categorize companies as pure play, category-focused, industry-focused, and diversified; it is quantitatively analyzed to categorize companies as dominant, leading, strong, tentative, and weak.
Recent Development and News in Nuclear Decommissioning Services Market In Europe
- In January 2024, Westinghouse Electric Company, a leading nuclear power plant operator, announced the launch of its new decommissioning services division, focusing on providing end-to-end solutions for nuclear power plant decommissioning (Westinghouse Press Release, 2024). This strategic move aimed to capitalize on the increasing demand for nuclear decommissioning services due to the retirement of aging nuclear power plants.
- In March 2024, Areva NP, a prominent nuclear services provider, and Framatome, a global leader in nuclear technology, joined forces to form a strategic partnership for the decommissioning of nuclear power plants. This collaboration aimed to combine their expertise and resources to offer comprehensive decommissioning services to utilities and governments worldwide (Areva NP Press Release, 2024).
- In May 2024, Holtec International, a nuclear technology company, secured a USD 1.2 billion contract from the U.S. Department of Energy to design and construct a centralized interim storage facility for spent nuclear fuel. This development marked a significant step forward in the nuclear decommissioning process, as the safe storage of spent fuel is a critical aspect of decommissioning projects (Holtec International Press Release, 2024).
- In April 2025, Nuclear Decommissioning Ltd., a UK-based company, successfully demonstrated a new robotic system for the removal of graphite from nuclear reactors. This technological advancement could significantly reduce the time and cost of decommissioning projects, as graphite removal is a complex and time-consuming process (Nuclear Decommissioning Ltd. Press Release, 2025).
Research Analyst Overview
The nuclear decommissioning services market continues to evolve, driven by the ongoing need to retire aging nuclear facilities and address the environmental impact of past nuclear activities. This complex process involves numerous stages, from site remediation and environmental impact assessment to quality assurance, site closure, and regulatory compliance. For instance, a recent decommissioning project involved a 50% reduction in dose rates through the implementation of advanced shielding materials and radiation protection measures. This outcome underscores the importance of safety procedures and emergency preparedness in the industry. Moreover, decommissioning planning, cost estimation, and project management are crucial components of the process, with regulatory licensing requirements and waste packaging and transportation adding to the intricacy.
Instrumentation calibration, radiation surveys, and waste characterization are essential for ensuring regulatory compliance and public engagement. The use of nuclear decommissioning robots, reactor dismantling, and remote handling systems facilitates structural demolition and decontamination techniques. Radioactive waste management, spent fuel storage, and nuclear fuel recycling are integral parts of the waste handling process. The nuclear decommissioning services market is expected to grow at a robust rate, with industry experts projecting a 15% annual expansion in the coming years. This growth is attributed to the increasing number of aging nuclear facilities requiring decommissioning and the ongoing development of advanced decommissioning technologies.
Dive into Technavio's robust research methodology, blending expert interviews, extensive data synthesis, and validated models for unparalleled Nuclear Decommissioning Services Market in Europe insights. See full methodology.
|
Market Scope |
|
|
Report Coverage |
Details |
|
Page number |
194 |
|
Base year |
2024 |
|
Forecast period |
2025-2029 |
|
Growth momentum & CAGR |
Accelerate at a CAGR of 6% |
|
Market growth 2025-2029 |
USD 2.04 billion |
|
Market structure |
Fragmented |
|
YoY growth 2024-2025(%) |
5.4 |
|
Competitive landscape |
Leading Companies, Market Positioning of Companies, Competitive Strategies, and Industry Risks |
What are the Key Data Covered in this Market Research Report?
- CAGR of the market during the forecast period
- Detailed information on factors that will drive the market growth and forecasting between 2025 and 2029
- Precise estimation of the size of the market and its contribution of the market in focus to the parent market
- Accurate predictions about upcoming market growth and trends and changes in consumer behaviour
- Growth of the market across Europe
- Thorough analysis of the market's competitive landscape and detailed information about companies
- Comprehensive analysis of factors that will challenge the growth of market companies
We can help! Our analysts can customize this market research report to meet your requirements Get in touch
 RIA -
RIA - 
