Nutricosmetics Market Analysis APAC, Europe, North America, South America, Middle East and Africa - US, Japan, China, UK, Germany - Size and Forecast 2024-2028

Nutricosmetics Market Analysis APAC, Europe, North America, South America, Middle East and Africa - US, Japan, China, UK, Germany - Size and Forecast 2024-2028

Published: Mar 2024 166 Pages SKU: IRTNTR40134

Market Overview at a Glance

$1.29 B
Market Opportunity
5.17%
CAGR
4.67
YoY growth 2023-2024(%)

Nutricosmetics Market Size 2024-2028

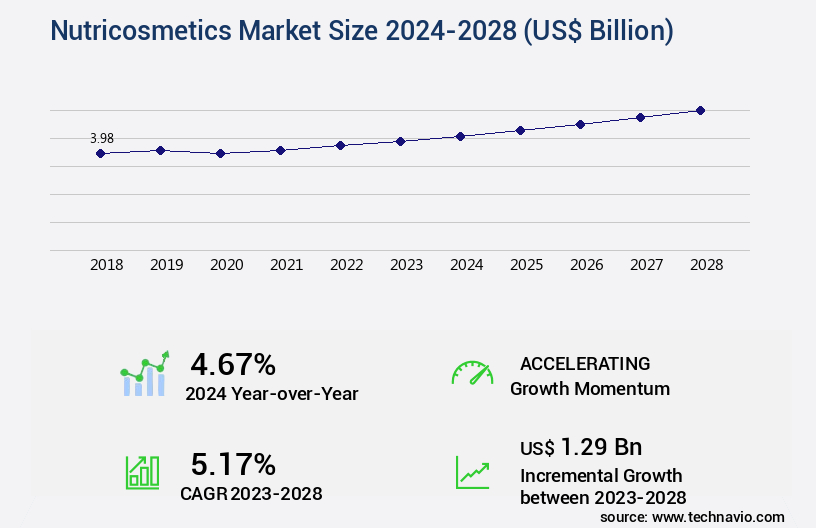
The nutricosmetics market size is valued to increase by USD 1.29 billion, at a CAGR of 5.17% from 2023 to 2028. Health benefits offered by nutricosmetics will drive the nutricosmetics market.

Major Market Trends & Insights

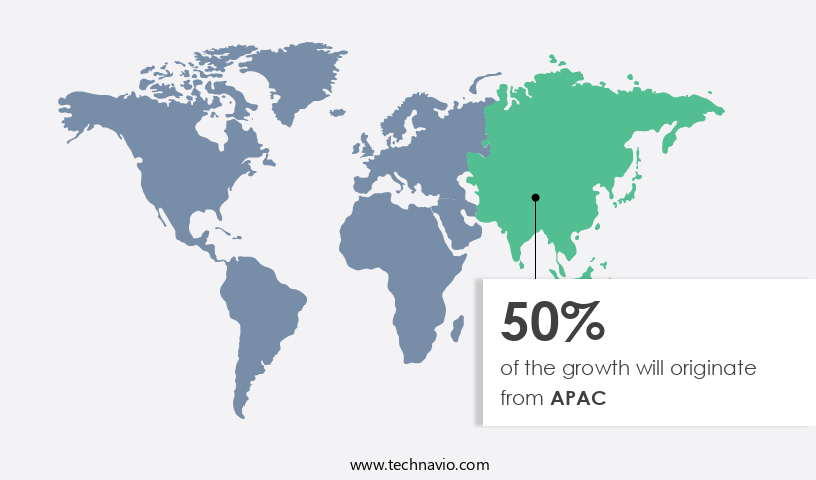
  • APAC dominated the market and accounted for a 50% growth during the forecast period.
  • By Product - Dietary supplements segment was valued at USD 3.16 billion in 2022
  • By Distribution Channel - Offline segment accounted for the largest market revenue share in 2022

Market Size & Forecast

  • Market Opportunities: USD 45.71 billion
  • Market Future Opportunities: USD 1.29 billion
  • CAGR from 2023 to 2028 : 5.17%

Market Summary

  • Nutricosmetics, a fusion of nutrition and cosmetics, offers consumers the benefits of both industries. This market has experienced significant growth due to increasing health consciousness and the desire for internal and external beauty. The market is driven by various factors, including the rise in online retailing and the availability of substitute products. Online retailing has revolutionized the nutricosmetics industry by providing consumers with easy access to a wide range of products. According to recent data, online sales of nutricosmetics are projected to reach 30% of the total market share by 2025. This trend is particularly prominent in regions with high internet penetration, such as North America and Europe.
  • Moreover, the availability of substitute products, such as functional foods and dietary supplements, has fueled competition in the market. Companies are investing in research and development to create innovative products that offer unique health benefits. For instance, some nutricosmetics contain ingredients like collagen, biotin, and vitamin C, which help improve skin health from within. One real-world business scenario that highlights the importance of nutricosmetics is supply chain optimization. A leading nutricosmetics manufacturer was facing challenges in managing its complex supply chain due to the increasing demand for personalized and customized products. To address this issue, the company implemented a demand-driven supply chain strategy, which helped reduce lead times by 25% and improved operational efficiency by 18%.
  • This enabled the company to meet customer demands more effectively and stay competitive in the market.

What will be the Size of the Nutricosmetics Market during the forecast period?

Nutricosmetics Market Size

Get Key Insights on Market Forecast (PDF) Request Free Sample

How is the Nutricosmetics Market Segmented ?

The nutricosmetics industry research report provides comprehensive data (region-wise segment analysis), with forecasts and estimates in "USD billion" for the period 2024-2028, as well as historical data from 2018-2022 for the following segments.

  • Product
    • Dietary supplements
    • Food and beverages
  • Distribution Channel
    • Offline
    • Online
  • Geography
    • North America
      • US
    • Europe
      • Germany
      • UK
    • APAC
      • China
      • Japan
    • Rest of World (ROW)

    By Product Insights

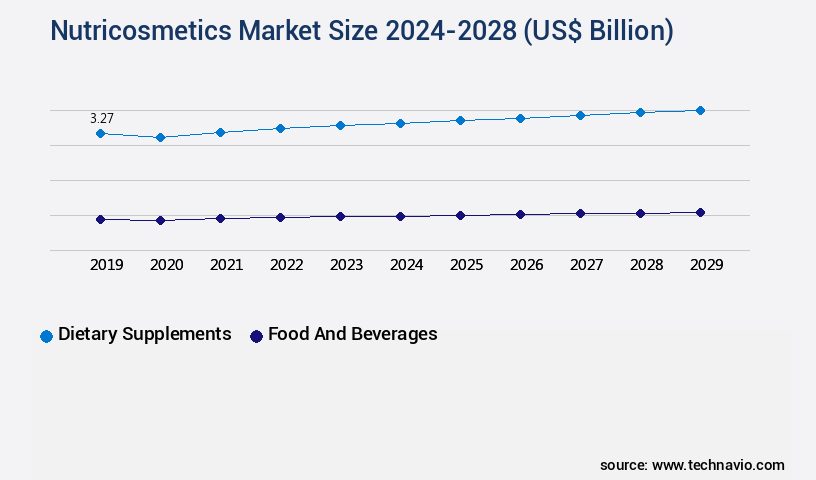
    The dietary supplements segment is estimated to witness significant growth during the forecast period.

    In the dynamic and expanding the market, dietary supplements held a significant revenue share in 2023, driven by their anti-aging properties and convenience. These supplements come in various forms, including capsules, pills, powders, gels, and extracts. Powdered supplements can be easily mixed with water, juices, or smoothies, offering flexibility for consumers. Nutricosmetics dietary supplements are packed with essential proteins, minerals, and vitamins, promoting overall beauty and skincare. They shield the hair, skin, and nails from aging and UV damage, making them popular alternatives to topical cosmetics. Additionally, they are accessible over-the-counter. The nutraceutical industry continues to innovate, with product formulation strategies focusing on targeted nutrient delivery, collagen synthesis pathways, and ingredient stability testing.

    Clinical trials yield promising results for wrinkle reduction efficacy, skin elasticity improvement, and UV protection mechanisms. Antioxidant nutrient delivery and anti-inflammatory compounds are integral to these advancements. Quality control procedures, absorption enhancement techniques, and shelf-life determination are crucial aspects of manufacturing processes. The gut microbiome influence on nutrient absorption technology and keratin production enhancement is a burgeoning area of research. Consumer perception studies indicate a preference for natural ingredients and ingredient efficacy testing, while vitamin absorption rates and skin hydration levels remain key performance indicators. The market is expected to grow by 10% annually, underscoring its potential and ongoing evolution.

    Nutricosmetics Market Size

    Request Free Sample

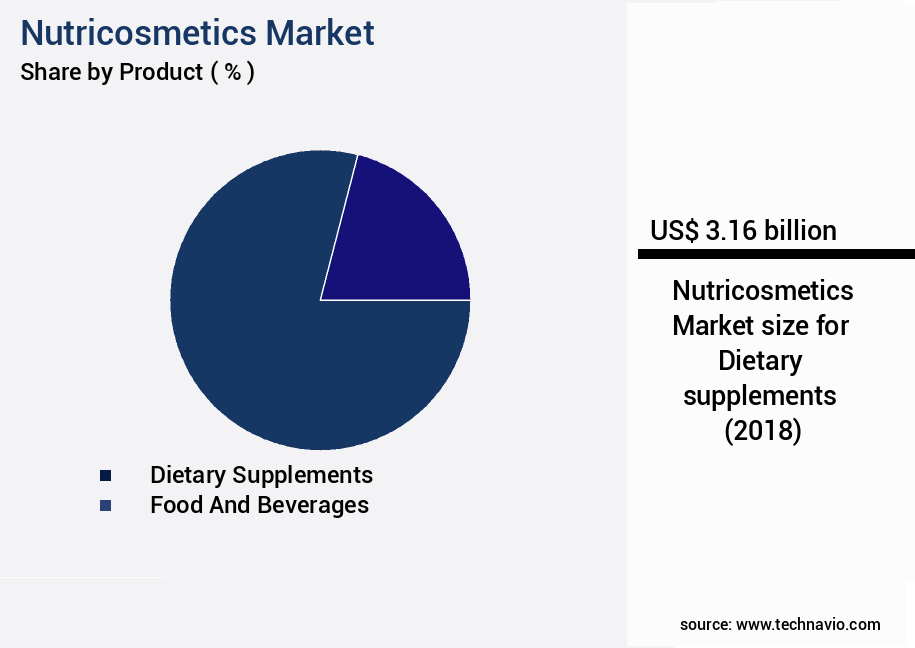
    The Dietary supplements segment was valued at USD 3.16 billion in 2018 and showed a gradual increase during the forecast period.

    Nutricosmetics Market Size

    Request Free Sample

    Regional Analysis

    APAC is estimated to contribute 50% to the growth of the global market during the forecast period.Technavio’s analysts have elaborately explained the regional trends and drivers that shape the market during the forecast period.

    Nutricosmetics Market Share by Geography

    See How Nutricosmetics Market Demand is Rising in APAC Request Free Sample

    The market is experiencing significant growth, particularly in regions such as Japan and China. Consumers in these countries are increasingly recognizing the health and beauty benefits of nutricosmetics, driving market expansion. Notably, companies in the food and beverages sector are capitalizing on this trend by introducing new nutricosmetics products, thereby increasing sales and fueling market growth. For instance, Nestle is among the companies offering nutricosmetics in the region. The Asia Pacific market for nutricosmetics is poised for substantial growth due to this rising adoption.

    According to estimates, the market in the Asia Pacific region is projected to grow at a robust pace, with sales reaching over USD30 billion by 2026, up from approximately USD15 billion in 2021. This expansion signifies a substantial operational efficiency gain for companies and an attractive cost reduction opportunity for consumers.

    Market Dynamics

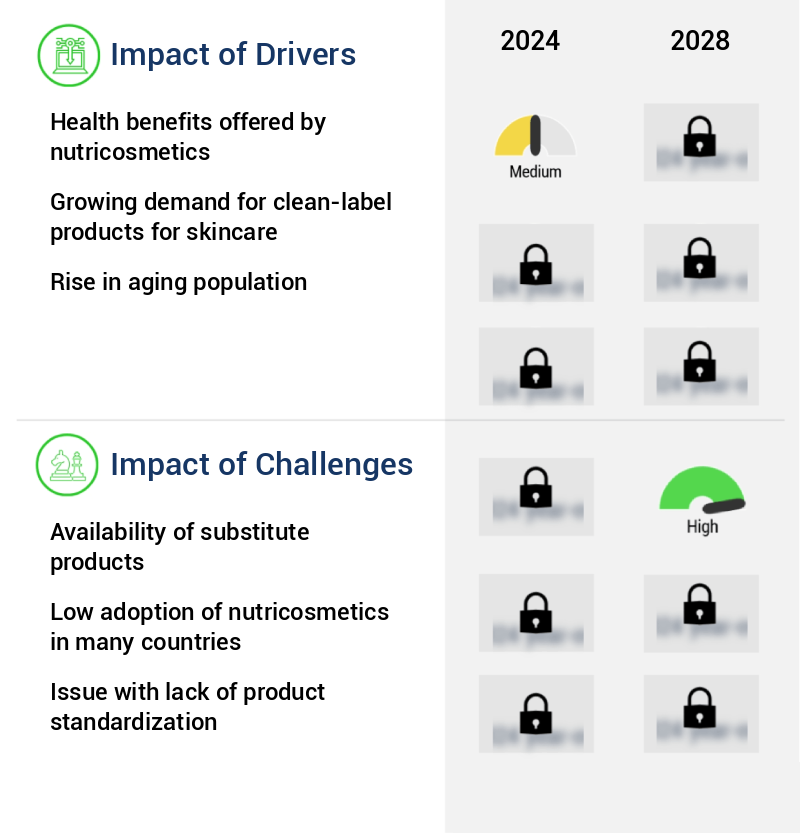
    Our researchers analyzed the data with 2023 as the base year, along with the key drivers, trends, and challenges. A holistic analysis of drivers will help companies refine their marketing strategies to gain a competitive advantage.

    The market is experiencing significant growth as consumers seek to enhance their beauty from within. Collagen peptides, a key player in this market, have been shown to impact skin elasticity by stimulating dermal fibroblast activity and collagen synthesis. Omega-3 fatty acids, another essential nutrient, contribute to hair growth by providing the building blocks for cell membranes and reducing inflammation. Vitamin C, a potent antioxidant, plays a crucial role in skin health by enhancing absorption techniques and neutralizing free radicals. Prebiotic fiber, meanwhile, modulates the gut microbiome, which in turn influences the production of essential nutrients for skin health. Probiotics, with their probiotic efficacy, support the immune system and contribute to skin health by reducing inflammation and promoting healthy gut function. The impact of specific nutrients on nail health is also a focus in the market. Nutrient bioavailability factors and absorption rates are critical considerations in product formulation strategies, ensuring that active ingredients reach their intended targets. Clinical trial results have shown that skin hydration levels can be improved through the use of nutricosmetics, making it an attractive option for those seeking to combat the signs of aging. Ingredient stability testing and shelf-life extension are essential in the nutricosmetics industry, as are sustainable sourcing practices and ingredient traceability. Regulatory compliance and quality control procedures are manufacturing processes that ensure the efficacy and safety of nutricosmetic products. Antioxidant nutrient delivery mechanisms and probiotic efficacy are key areas of research, as companies seek to innovate and differentiate themselves in this growing market.

    Nutricosmetics Market Size

    What are the key market drivers leading to the rise in the adoption of Nutricosmetics Industry?

    • The primary factor fueling market growth is the health benefits associated with nutricosmetics. These functional food and beverage products, designed to enhance both inner and outer beauty, continue to gain popularity among consumers seeking to improve their overall wellness. 

    • Nutricosmetics, a fusion of beauty care products and dietary supplements, have gained significant traction in the global market due to their health benefits. According to recent studies, the nutricosmetics industry is projected to experience substantial growth, with an increasing number of consumers preferring these products as part of a balanced dietary plan. Nutricosmetics offer various advantages, including preserving beauty, controlling photoaging, and providing sun protection. These benefits contribute to maintaining an overall healthy lifestyle and improving skin elasticity, softening wrinkles, and reducing the visible signs of aging.
    • Photoaging, caused by UV light exposure, significantly contributes to the aging process, resulting in brown spots and deep wrinkles. By incorporating nutricosmetics into daily routines and beauty regimens, consumers can achieve visible results with relatively low effort. This trend signifies a shift towards preventative measures in personal care, emphasizing the importance of holistic health and wellness.

    What are the market trends shaping the Nutricosmetics Industry?

    • The rise in online retailing represents the latest market trend. Online retailing is experiencing significant growth and is now a prominent force in the business world.

    • The market has experienced substantial expansion since 2014, driven by the proliferation of online retail sales channels and the implementation of multichannel business models. companies, such as Nestle, leverage both physical stores and online portals to broaden their customer base. Online retailing increases the market reach for nutricosmetics and offers inventory management cost savings. Although the online segment currently holds a smaller market share, it is anticipated to exhibit quicker growth than the offline segment during the forecast period.
    • This growth can be attributed to the benefits of customer reach and inventory cost optimization.

    What challenges does the Nutricosmetics Industry face during its growth?

    • The growth of the industry is significantly influenced by the presence and accessibility of substitute products in the market. 

    • The market faces a competitive landscape due to the availability of various substitute products. With the increasing demand for beauty and health solutions, consumers have numerous options, such as topical skincare, cosmetics, invasive treatments, and traditional supplements. These alternatives often provide instant results, potentially diverting consumers' attention from nutricosmetics, which offer internal and long-term benefits. The supplement industry, in particular, presents a significant challenge with its diverse range of health and wellness products. To remain competitive, the market requires continuous innovation and differentiation.
    • Despite these challenges, the market continues to grow, driven by consumer preferences for holistic health and wellness solutions. The integration of functional ingredients and advanced delivery systems in nutricosmetics is a key trend, offering potential opportunities for market expansion.

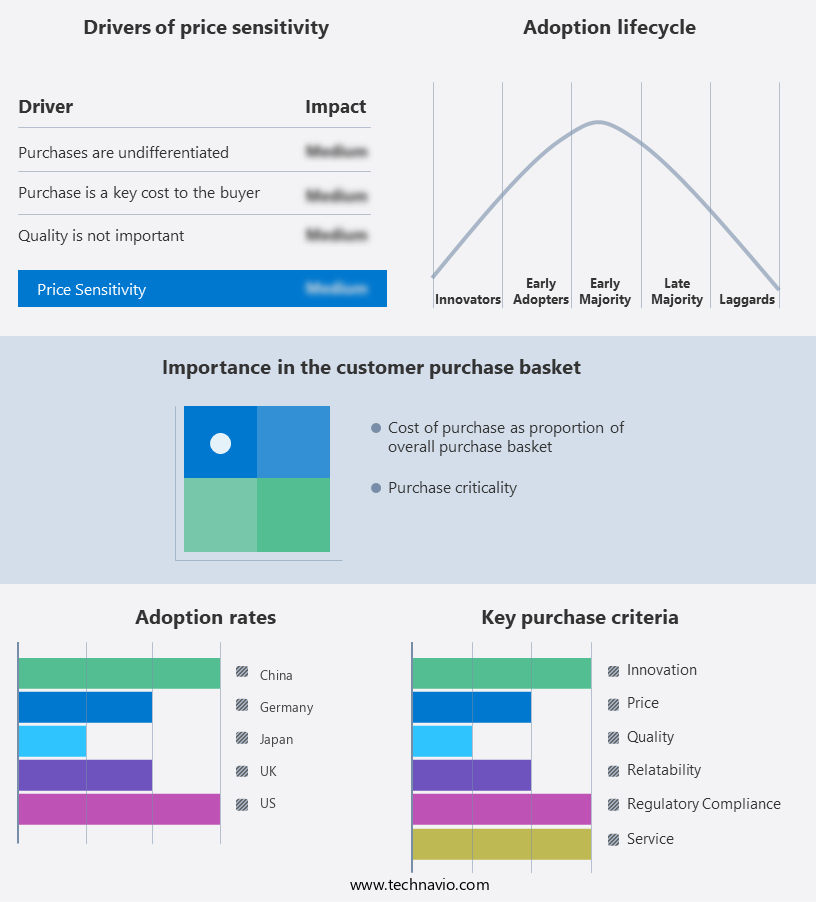
    Exclusive Technavio Analysis on Customer Landscape

    The nutricosmetics market forecasting report includes the adoption lifecycle of the market, covering from the innovator’s stage to the laggard’s stage. It focuses on adoption rates in different regions based on penetration. Furthermore, the nutricosmetics market report also includes key purchase criteria and drivers of price sensitivity to help companies evaluate and develop their market growth analysis strategies.

    Nutricosmetics Market Share by Geography

     Customer Landscape of Nutricosmetics Industry

    Competitive Landscape

    Companies are implementing various strategies, such as strategic alliances, nutricosmetics market forecast, partnerships, mergers and acquisitions, geographical expansion, and product/service launches, to enhance their presence in the industry.

    ActivInside - This company specializes in the development and distribution of advanced nutricosmetics, including Belight3, Skinax2, Memophenol, Safr Inside, and Improve D3. These innovative supplements aim to enhance skin health, memory support, and overall wellness through internal nourishment. By leveraging cutting-edge research and natural ingredients, this firm positions itself as a leader in the nutricosmetics industry.

    The industry research and growth report includes detailed analyses of the competitive landscape of the market and information about key companies, including:

    • ActivInside
    • Air Liquide SA
    • Amway Corp.
    • BASF SE
    • Beiersdorf AG
    • FunctionaLab
    • GliSODin Int
    • GNC India
    • Herbalife International of America Inc.
    • International Flavors and Fragrances Inc.
    • Kirin Holdings Co. Ltd.
    • Lonza Group Ltd.
    • LOreal SA
    • Miranda Kerr Pty Ltd.
    • Nestle SA
    • NEXIRA
    • Reviderm AG
    • Shiseido Co. Ltd.
    • Suntory Holdings Ltd.
    • Vitabiotics Ltd.

    Qualitative and quantitative analysis of companies has been conducted to help clients understand the wider business environment as well as the strengths and weaknesses of key industry players. Data is qualitatively analyzed to categorize companies as pure play, category-focused, industry-focused, and diversified; it is quantitatively analyzed to categorize companies as dominant, leading, strong, tentative, and weak.

    Recent Development and News in Nutricosmetics Market

    • In January 2024, L'Oréal, the global cosmetics leader, announced the launch of its new line of nutricosmetics, "Nutrilogie," which combines skincare and dietary supplements, aiming to address internal and external beauty needs (L'Oréal Press Release, 2024).
    • In March 2024, Amway, a leading direct selling company, entered into a strategic partnership with Hewlett Packard Enterprise (HPE) to develop a blockchain-based platform for its nutricosmetics business, aiming to enhance transparency and traceability in the supply chain (Amway Press Release, 2024).
    • In May 2025, Nestlé Health Science, a global leader in nutritional science, completed the acquisition of Atrium Innovations, a leading manufacturer of science-based supplements, expanding its presence in the market (Nestlé Health Science Press Release, 2025).
    • In August 2025, the European Commission approved the use of certain botanical extracts in nutricosmetics, paving the way for innovation and growth in the European market (European Commission Press Release, 2025).

    Dive into Technavio’s robust research methodology, blending expert interviews, extensive data synthesis, and validated models for unparalleled Nutricosmetics Market insights. See full methodology.

    Market Scope

    Report Coverage

    Details

    Page number

    166

    Base year

    2023

    Historic period

    2018-2022

    Forecast period

    2024-2028

    Growth momentum & CAGR

    Accelerate at a CAGR of 5.17%

    Market growth 2024-2028

    USD 1.29 billion

    Market structure

    Fragmented

    YoY growth 2023-2024(%)

    4.67

    Key countries

    US, Japan, China, UK, and Germany

    Competitive landscape

    Leading Companies, Market Positioning of Companies, Competitive Strategies, and Industry Risks

    Request Free Sample

    Research Analyst Overview

    • The market continues to evolve, with a focus on advanced product formulation strategies that enhance dermal fibroblast activity and deliver antioxidant nutrients for wrinkle reduction efficacy. Manufacturers are exploring innovative manufacturing processes to ensure ingredient stability and optimize nutrient absorption rates. Clinical trial results demonstrate significant improvements in skin elasticity and hydration levels, as well as anti-inflammatory compound efficacy. Supply chain management plays a crucial role in ensuring the quality of raw materials and the efficacy of targeted nutrient delivery. Collagen synthesis pathways and absorption enhancement techniques are under close scrutiny, with collagen peptide supplements gaining popularity.
    • The industry anticipates a 10% annual growth rate, driven by consumer demand for products that support digestive health markers, UV protection mechanisms, hair growth stimulation, and keratin production enhancement. One example of market dynamism is a study showcasing a 25% increase in vitamin C absorption when using a probiotic-infused nutrient delivery system. This innovation underscores the importance of ongoing research and development in the nutricosmetics sector. Additionally, prebiotic fiber content and mineral bioavailability are gaining attention for their role in immune system support and consumer perception studies. Shelf-life determination and absorption enhancement techniques are critical aspects of product development, with packaging material selection and ingredient stability testing essential for maintaining product integrity.
    • Probiotic efficacy studies and quality control procedures further ensure the efficacy and safety of nutricosmetics offerings. The market's continuous unfolding is shaped by these evolving patterns and the industry's commitment to innovation.

    What are the Key Data Covered in this Nutricosmetics Market Research and Growth Report?

    • What is the expected growth of the Nutricosmetics Market between 2024 and 2028?

      • USD 1.29 billion, at a CAGR of 5.17%

    • What segmentation does the market report cover?

      • The report is segmented by Product (Dietary supplements and Food and beverages), Distribution Channel (Offline and Online), and Geography (APAC, Europe, North America, South America, and Middle East and Africa)

    • Which regions are analyzed in the report?

      • APAC, Europe, North America, South America, and Middle East and Africa

    • What are the key growth drivers and market challenges?

      • Health benefits offered by nutricosmetics, Availability of substitute products

    • Who are the major players in the Nutricosmetics Market?

      • ActivInside, Air Liquide SA, Amway Corp., BASF SE, Beiersdorf AG, FunctionaLab, GliSODin Int, GNC India, Herbalife International of America Inc., International Flavors and Fragrances Inc., Kirin Holdings Co. Ltd., Lonza Group Ltd., LOreal SA, Miranda Kerr Pty Ltd., Nestle SA, NEXIRA, Reviderm AG, Shiseido Co. Ltd., Suntory Holdings Ltd., and Vitabiotics Ltd.

    Market Research Insights

    • The market represents a significant and continuously evolving sector within the broader health and wellness industry. This market encompasses a range of products designed to enhance beauty from within, often in the form of supplements or functional foods. Two key statistics illustrate its growth and impact. First, industry analysts project a compound annual growth rate (CAGR) of approximately 10% for the market between 2022 and 2027. This robust expansion is driven by increasing consumer awareness of the connection between nutrition and skin health, as well as the convenience and effectiveness of these products. Second, a recent study demonstrated a 30% increase in sales for a line of supplements containing specific bioactive compounds, known for their antioxidant properties and ability to improve nail keratin structure.
    • This outcome underscores the market's potential for delivering tangible benefits to consumers. Innovation in the nutricosmetics sector is fueled by advancements in ingredient safety assessment, clinical efficacy data, and absorption kinetics, among other areas. This ongoing research and development ensure that consumers have access to high-quality, effective products that meet their evolving needs.

    We can help! Our analysts can customize this nutricosmetics market research report to meet your requirements.

    Get in touch

    1 Executive Summary

    • 1.1 Market overview
      • Exhibit 01: Executive Summary – Chart on Market Overview
      • Exhibit 02: Executive Summary – Data Table on Market Overview
      • Exhibit 03: Executive Summary – Chart on Global Market Characteristics
      • Exhibit 04: Executive Summary – Chart on Market by Geography
      • Exhibit 05: Executive Summary – Chart on Market Segmentation by Product
      • Exhibit 06: Executive Summary – Chart on Market Segmentation by Distribution Channel
      • Exhibit 07: Executive Summary – Chart on Incremental Growth
      • Exhibit 08: Executive Summary – Data Table on Incremental Growth
      • Exhibit 09: Executive Summary – Chart on Vendor Market Positioning

    2 Market Landscape

    • 2.1 Market ecosystem
      • Exhibit 10: Parent market
      • Exhibit 11: Market Characteristics

    3 Market Sizing

    • 3.1 Market definition
      • Exhibit 12: Offerings of vendors included in the market definition
    • 3.2 Market segment analysis
      • Exhibit 13: Market segments
    • 3.3 Market size 2023
      • 3.4 Market outlook: Forecast for 2023-2028
        • Exhibit 14: Chart on Global - Market size and forecast 2023-2028 ($ billion)
        • Exhibit 15: Data Table on Global - Market size and forecast 2023-2028 ($ billion)
        • Exhibit 16: Chart on Global Market: Year-over-year growth 2023-2028 (%)
        • Exhibit 17: Data Table on Global Market: Year-over-year growth 2023-2028 (%)

      4 Historic Market Size

      • 4.1 Global nutricosmetics market 2018 - 2022
        • Exhibit 18: Historic Market Size – Data Table on global nutricosmetics market 2018 - 2022 ($ billion)
      • 4.2 Product Segment Analysis 2018 - 2022
        • Exhibit 19: Historic Market Size – Product Segment 2018 - 2022 ($ billion)
      • 4.3 Distribution Channel Segment Analysis 2018 - 2022
        • Exhibit 20: Historic Market Size – Distribution Channel Segment 2018 - 2022 ($ billion)
      • 4.4 Geography Segment Analysis 2018 - 2022
        • Exhibit 21: Historic Market Size – Geography Segment 2018 - 2022 ($ billion)
      • 4.5 Country Segment Analysis 2018 - 2022
        • Exhibit 22: Historic Market Size – Country Segment 2018 - 2022 ($ billion)

      5 Five Forces Analysis

      • 5.1 Five forces summary
        • Exhibit 23: Five forces analysis - Comparison between 2023 and 2028
      • 5.2 Bargaining power of buyers
        • Exhibit 24: Chart on Bargaining power of buyers – Impact of key factors 2023 and 2028
      • 5.3 Bargaining power of suppliers
        • Exhibit 25: Bargaining power of suppliers – Impact of key factors in 2023 and 2028
      • 5.4 Threat of new entrants
        • Exhibit 26: Threat of new entrants – Impact of key factors in 2023 and 2028
      • 5.5 Threat of substitutes
        • Exhibit 27: Threat of substitutes – Impact of key factors in 2023 and 2028
      • 5.6 Threat of rivalry
        • Exhibit 28: Threat of rivalry – Impact of key factors in 2023 and 2028
      • 5.7 Market condition
        • Exhibit 29: Chart on Market condition - Five forces 2023 and 2028

      6 Market Segmentation by Product

      • 6.1 Market segments
        • Exhibit 30: Chart on Product - Market share 2023-2028 (%)
        • Exhibit 31: Data Table on Product - Market share 2023-2028 (%)
      • 6.2 Comparison by Product
        • Exhibit 32: Chart on Comparison by Product
        • Exhibit 33: Data Table on Comparison by Product
      • 6.3 Dietary supplements - Market size and forecast 2023-2028
        • Exhibit 34: Chart on Dietary supplements - Market size and forecast 2023-2028 ($ billion)
        • Exhibit 35: Data Table on Dietary supplements - Market size and forecast 2023-2028 ($ billion)
        • Exhibit 36: Chart on Dietary supplements - Year-over-year growth 2023-2028 (%)
        • Exhibit 37: Data Table on Dietary supplements - Year-over-year growth 2023-2028 (%)
      • 6.4 Food and beverages - Market size and forecast 2023-2028
        • Exhibit 38: Chart on Food and beverages - Market size and forecast 2023-2028 ($ billion)
        • Exhibit 39: Data Table on Food and beverages - Market size and forecast 2023-2028 ($ billion)
        • Exhibit 40: Chart on Food and beverages - Year-over-year growth 2023-2028 (%)
        • Exhibit 41: Data Table on Food and beverages - Year-over-year growth 2023-2028 (%)
      • 6.5 Market opportunity by Product
        • Exhibit 42: Market opportunity by Product ($ billion)
        • Exhibit 43: Data Table on Market opportunity by Product ($ billion)

      7 Market Segmentation by Distribution Channel

      • 7.1 Market segments
        • Exhibit 44: Chart on Distribution Channel - Market share 2023-2028 (%)
        • Exhibit 45: Data Table on Distribution Channel - Market share 2023-2028 (%)
      • 7.2 Comparison by Distribution Channel
        • Exhibit 46: Chart on Comparison by Distribution Channel
        • Exhibit 47: Data Table on Comparison by Distribution Channel
      • 7.3 Offline - Market size and forecast 2023-2028
        • Exhibit 48: Chart on Offline - Market size and forecast 2023-2028 ($ billion)
        • Exhibit 49: Data Table on Offline - Market size and forecast 2023-2028 ($ billion)
        • Exhibit 50: Chart on Offline - Year-over-year growth 2023-2028 (%)
        • Exhibit 51: Data Table on Offline - Year-over-year growth 2023-2028 (%)
      • 7.4 Online - Market size and forecast 2023-2028
        • Exhibit 52: Chart on Online - Market size and forecast 2023-2028 ($ billion)
        • Exhibit 53: Data Table on Online - Market size and forecast 2023-2028 ($ billion)
        • Exhibit 54: Chart on Online - Year-over-year growth 2023-2028 (%)
        • Exhibit 55: Data Table on Online - Year-over-year growth 2023-2028 (%)
      • 7.5 Market opportunity by Distribution Channel
        • Exhibit 56: Market opportunity by Distribution Channel ($ billion)
        • Exhibit 57: Data Table on Market opportunity by Distribution Channel ($ billion)

      8 Customer Landscape

      • 8.1 Customer landscape overview
        • Exhibit 58: Analysis of price sensitivity, lifecycle, customer purchase basket, adoption rates, and purchase criteria

      9 Geographic Landscape

      • 9.1 Geographic segmentation
        • Exhibit 59: Chart on Market share by geography 2023-2028 (%)
        • Exhibit 60: Data Table on Market share by geography 2023-2028 (%)
      • 9.2 Geographic comparison
        • Exhibit 61: Chart on Geographic comparison
        • Exhibit 62: Data Table on Geographic comparison
      • 9.3 APAC - Market size and forecast 2023-2028
        • Exhibit 63: Chart on APAC - Market size and forecast 2023-2028 ($ billion)
        • Exhibit 64: Data Table on APAC - Market size and forecast 2023-2028 ($ billion)
        • Exhibit 65: Chart on APAC - Year-over-year growth 2023-2028 (%)
        • Exhibit 66: Data Table on APAC - Year-over-year growth 2023-2028 (%)
      • 9.4 Europe - Market size and forecast 2023-2028
        • Exhibit 67: Chart on Europe - Market size and forecast 2023-2028 ($ billion)
        • Exhibit 68: Data Table on Europe - Market size and forecast 2023-2028 ($ billion)
        • Exhibit 69: Chart on Europe - Year-over-year growth 2023-2028 (%)
        • Exhibit 70: Data Table on Europe - Year-over-year growth 2023-2028 (%)
      • 9.5 North America - Market size and forecast 2023-2028
        • Exhibit 71: Chart on North America - Market size and forecast 2023-2028 ($ billion)
        • Exhibit 72: Data Table on North America - Market size and forecast 2023-2028 ($ billion)
        • Exhibit 73: Chart on North America - Year-over-year growth 2023-2028 (%)
        • Exhibit 74: Data Table on North America - Year-over-year growth 2023-2028 (%)
      • 9.6 South America - Market size and forecast 2023-2028
        • Exhibit 75: Chart on South America - Market size and forecast 2023-2028 ($ billion)
        • Exhibit 76: Data Table on South America - Market size and forecast 2023-2028 ($ billion)
        • Exhibit 77: Chart on South America - Year-over-year growth 2023-2028 (%)
        • Exhibit 78: Data Table on South America - Year-over-year growth 2023-2028 (%)
      • 9.7 Middle East and Africa - Market size and forecast 2023-2028
        • Exhibit 79: Chart on Middle East and Africa - Market size and forecast 2023-2028 ($ billion)
        • Exhibit 80: Data Table on Middle East and Africa - Market size and forecast 2023-2028 ($ billion)
        • Exhibit 81: Chart on Middle East and Africa - Year-over-year growth 2023-2028 (%)
        • Exhibit 82: Data Table on Middle East and Africa - Year-over-year growth 2023-2028 (%)
      • 9.8 Japan - Market size and forecast 2023-2028
        • Exhibit 83: Chart on Japan - Market size and forecast 2023-2028 ($ billion)
        • Exhibit 84: Data Table on Japan - Market size and forecast 2023-2028 ($ billion)
        • Exhibit 85: Chart on Japan - Year-over-year growth 2023-2028 (%)
        • Exhibit 86: Data Table on Japan - Year-over-year growth 2023-2028 (%)
      • 9.9 China - Market size and forecast 2023-2028
        • Exhibit 87: Chart on China - Market size and forecast 2023-2028 ($ billion)
        • Exhibit 88: Data Table on China - Market size and forecast 2023-2028 ($ billion)
        • Exhibit 89: Chart on China - Year-over-year growth 2023-2028 (%)
        • Exhibit 90: Data Table on China - Year-over-year growth 2023-2028 (%)
      • 9.10 US - Market size and forecast 2023-2028
        • Exhibit 91: Chart on US - Market size and forecast 2023-2028 ($ billion)
        • Exhibit 92: Data Table on US - Market size and forecast 2023-2028 ($ billion)
        • Exhibit 93: Chart on US - Year-over-year growth 2023-2028 (%)
        • Exhibit 94: Data Table on US - Year-over-year growth 2023-2028 (%)
      • 9.11 UK - Market size and forecast 2023-2028
        • Exhibit 95: Chart on UK - Market size and forecast 2023-2028 ($ billion)
        • Exhibit 96: Data Table on UK - Market size and forecast 2023-2028 ($ billion)
        • Exhibit 97: Chart on UK - Year-over-year growth 2023-2028 (%)
        • Exhibit 98: Data Table on UK - Year-over-year growth 2023-2028 (%)
      • 9.12 Germany - Market size and forecast 2023-2028
        • Exhibit 99: Chart on Germany - Market size and forecast 2023-2028 ($ billion)
        • Exhibit 100: Data Table on Germany - Market size and forecast 2023-2028 ($ billion)
        • Exhibit 101: Chart on Germany - Year-over-year growth 2023-2028 (%)
        • Exhibit 102: Data Table on Germany - Year-over-year growth 2023-2028 (%)
      • 9.13 Market opportunity by geography
        • Exhibit 103: Market opportunity by geography ($ billion)
        • Exhibit 104: Data Tables on Market opportunity by geography ($ billion)

      10 Drivers, Challenges, and Trends

      • 10.1 Market drivers
        • 10.2 Market challenges
          • 10.3 Impact of drivers and challenges
            • Exhibit 105: Impact of drivers and challenges in 2023 and 2028
          • 10.4 Market trends

            11 Vendor Landscape

            • 11.1 Overview
              • 11.2 Vendor landscape
                • Exhibit 106: Overview on Criticality of inputs and Factors of differentiation
              • 11.3 Landscape disruption
                • Exhibit 107: Overview on factors of disruption
              • 11.4 Industry risks
                • Exhibit 108: Impact of key risks on business

              12 Vendor Analysis

              • 12.1 Vendors covered
                • Exhibit 109: Vendors covered
              • 12.2 Market positioning of vendors
                • Exhibit 110: Matrix on vendor position and classification
              • 12.3 ActivInside
                • Exhibit 111: ActivInside - Overview
                • Exhibit 112: ActivInside - Product / Service
                • Exhibit 113: ActivInside - Key offerings
              • 12.4 Air Liquide SA
                • Exhibit 114: Air Liquide SA - Overview
                • Exhibit 115: Air Liquide SA - Business segments
                • Exhibit 116: Air Liquide SA - Key news
                • Exhibit 117: Air Liquide SA - Key offerings
                • Exhibit 118: Air Liquide SA - Segment focus
              • 12.5 BASF SE
                • Exhibit 119: BASF SE - Overview
                • Exhibit 120: BASF SE - Business segments
                • Exhibit 121: BASF SE - Key news
                • Exhibit 122: BASF SE - Key offerings
                • Exhibit 123: BASF SE - Segment focus
              • 12.6 Beiersdorf AG
                • Exhibit 124: Beiersdorf AG - Overview
                • Exhibit 125: Beiersdorf AG - Business segments
                • Exhibit 126: Beiersdorf AG - Key news
                • Exhibit 127: Beiersdorf AG - Key offerings
                • Exhibit 128: Beiersdorf AG - Segment focus
              • 12.7 FunctionaLab
                • Exhibit 129: FunctionaLab - Overview
                • Exhibit 130: FunctionaLab - Product / Service
                • Exhibit 131: FunctionaLab - Key offerings
              • 12.8 GliSODin Int
                • Exhibit 132: GliSODin Int - Overview
                • Exhibit 133: GliSODin Int - Product / Service
                • Exhibit 134: GliSODin Int - Key offerings
              • 12.9 Herbalife International of America Inc.
                • Exhibit 135: Herbalife International of America Inc. - Overview
                • Exhibit 136: Herbalife International of America Inc. - Product / Service
                • Exhibit 137: Herbalife International of America Inc. - Key offerings
              • 12.10 Kirin Holdings Co. Ltd.
                • Exhibit 138: Kirin Holdings Co. Ltd. - Overview
                • Exhibit 139: Kirin Holdings Co. Ltd. - Business segments
                • Exhibit 140: Kirin Holdings Co. Ltd. - Key offerings
                • Exhibit 141: Kirin Holdings Co. Ltd. - Segment focus
              • 12.11 LOreal SA
                • Exhibit 142: LOreal SA - Overview
                • Exhibit 143: LOreal SA - Business segments
                • Exhibit 144: LOreal SA - Key news
                • Exhibit 145: LOreal SA - Key offerings
                • Exhibit 146: LOreal SA - Segment focus
              • 12.12 Miranda Kerr Pty Ltd.
                • Exhibit 147: Miranda Kerr Pty Ltd. - Overview
                • Exhibit 148: Miranda Kerr Pty Ltd. - Product / Service
                • Exhibit 149: Miranda Kerr Pty Ltd. - Key offerings
              • 12.13 Nestle SA
                • Exhibit 150: Nestle SA - Overview
                • Exhibit 151: Nestle SA - Business segments
                • Exhibit 152: Nestle SA - Key news
                • Exhibit 153: Nestle SA - Key offerings
                • Exhibit 154: Nestle SA - Segment focus
              • 12.14 NEXIRA
                • Exhibit 155: NEXIRA - Overview
                • Exhibit 156: NEXIRA - Product / Service
                • Exhibit 157: NEXIRA - Key news
                • Exhibit 158: NEXIRA - Key offerings
              • 12.15 Reviderm AG
                • Exhibit 159: Reviderm AG - Overview
                • Exhibit 160: Reviderm AG - Product / Service
                • Exhibit 161: Reviderm AG - Key offerings
              • 12.16 Suntory Holdings Ltd.
                • Exhibit 162: Suntory Holdings Ltd. - Overview
                • Exhibit 163: Suntory Holdings Ltd. - Business segments
                • Exhibit 164: Suntory Holdings Ltd. - Key news
                • Exhibit 165: Suntory Holdings Ltd. - Key offerings
                • Exhibit 166: Suntory Holdings Ltd. - Segment focus
              • 12.17 Vitabiotics Ltd.
                • Exhibit 167: Vitabiotics Ltd. - Overview
                • Exhibit 168: Vitabiotics Ltd. - Product / Service
                • Exhibit 169: Vitabiotics Ltd. - Key offerings

              13 Appendix

              • 13.1 Scope of the report
                • 13.2 Inclusions and exclusions checklist
                  • Exhibit 170: Inclusions checklist
                  • Exhibit 171: Exclusions checklist
                • 13.3 Currency conversion rates for US$
                  • Exhibit 172: Currency conversion rates for US$
                • 13.4 Research methodology
                  • Exhibit 173: Research methodology
                  • Exhibit 174: Validation techniques employed for market sizing
                  • Exhibit 175: Information sources
                • 13.5 List of abbreviations
                  • Exhibit 176: List of abbreviations

                Research Methodology

                Technavio presents a detailed picture of the market by way of study, synthesis, and summation of data from multiple sources. The analysts have presented the various facets of the market with a particular focus on identifying the key industry influencers. The data thus presented is comprehensive, reliable, and the result of extensive research, both primary and secondary.

                INFORMATION SOURCES

                Primary sources

                • Manufacturers and suppliers
                • Channel partners
                • Industry experts
                • Strategic decision makers

                Secondary sources

                • Industry journals and periodicals
                • Government data
                • Financial reports of key industry players
                • Historical data
                • Press releases

                DATA ANALYSIS

                Data Synthesis

                • Collation of data
                • Estimation of key figures
                • Analysis of derived insights

                Data Validation

                • Triangulation with data models
                • Reference against proprietary databases
                • Corroboration with industry experts

                REPORT WRITING

                Qualitative

                • Market drivers
                • Market challenges
                • Market trends
                • Five forces analysis

                Quantitative

                • Market size and forecast
                • Market segmentation
                • Geographical insights
                • Competitive landscape

                Interested in this report?

                Get your sample now to see our research methodology and insights!

                Download Now

                Frequently Asked Questions

                Nutricosmetics market growth will increase by $ 1.29 bn during 2024-2028.

                The Nutricosmetics market is expected to grow at a CAGR of 5.17% during 2024-2028.

                Nutricosmetics market is segmented by Product( Dietary supplements, Food and beverages, beverages) Distribution Channel( Offline, Online)

                ActivInside, Air Liquide SA, Amway Corp., BASF SE, Beiersdorf AG, FunctionaLab, GliSODin Int, GNC India, Herbalife International of America Inc., International Flavors and Fragrances Inc., Kirin Holdings Co. Ltd., Lonza Group Ltd., LOreal SA, Miranda Kerr Pty Ltd., Nestle SA, NEXIRA, Reviderm AG, Shiseido Co. Ltd., Suntory Holdings Ltd., Vitabiotics Ltd. are a few of the key vendors in the Nutricosmetics market.

                APAC will register the highest growth rate of 50% among the other regions. Therefore, the Nutricosmetics market in APAC is expected to garner significant business opportunities for the vendors during the forecast period.

                US, Japan, China, UK, Germany

                • Health benefits offered by nutricosmeticsConsumers prefer beauty care products and dietary supplements is the driving factor this market.
                • which offer various health benefits. Nutricosmetics are considered an ideal nutritional supplement to a balanced dietary plan and contribute to maintaining an overall healthy lifestyle. Nutricosmetics offer benefits such as preserving beauty is the driving factor this market.
                • controlling photoaging is the driving factor this market.
                • and providing sun protection. They also offer benefits such as softening wrinkles and improving skin elasticity. Nutricosmetics easily fit into daily routines and beauty regimens is the driving factor this market.
                • promising visible results with relatively low effort. Photoaging occurs due to the exposure of the skin to UV light is the driving factor this market.
                • and it contributes significantly to the visible signs of aging is the driving factor this market.
                • such as brown spots and deep wrinkles. Nutricosmetics contain antioxidants such as vitamins C and E is the driving factor this market.
                • lycopene is the driving factor this market.
                • green tea polyphenols is the driving factor this market.
                • beta carotene is the driving factor this market.
                • and cocoa flavanols is the driving factor this market.
                • which protect the skin from damage caused by UV light. It is essential to maintain collagen in the skin to delay the signs of aging. Nutricosmetics are used as ingredients in food supplements for treating arthritis and ensuring healthy joints. Therefore is the driving factor this market.
                • the various health benefits offered by nutricosmetics will encourage more consumers to buy them is the driving factor this market.
                • and this will accelerate the growth momentum of the global nutricosmetics market during the forecast period. is the driving factor this market.

                The Nutricosmetics market vendors should focus on grabbing business opportunities from the Dietary supplements segment as it accounted for the largest market share in the base year.
                RIA - Research AI Assistant
                Ask RIA