Oil Content Analyzer Market Size 2025-2029
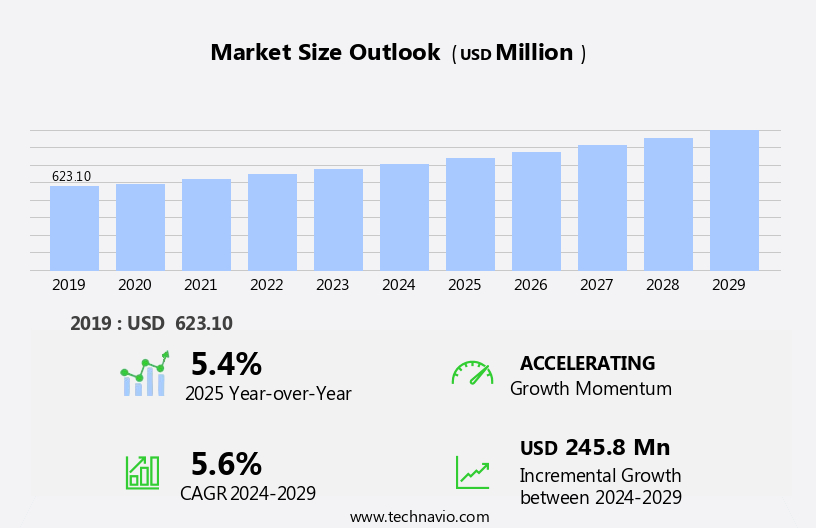
The oil content analyzer market size is forecast to increase by USD 245.8 million, at a CAGR of 5.6% between 2024 and 2029.
- The market is experiencing significant growth due to several key trends. Strict environmental regulations are driving the demand for accurate and efficient oil analysis to ensure compliance. Additionally, the rising preference for handheld analyzers offers convenience and portability, making them increasingly popular in various industries. However, the market faces challenges such as high initial costs and maintenance expenses, which may hinder market growth. Advanced sensor technology, automation, IoT, and Artificial Intelligence are integral to the market's growth, enabling real-time monitoring, process optimization, and quality control. Despite these challenges, the market is expected to continue expanding as the need for precise oil analysis solutions becomes increasingly crucial for maintaining equipment performance and ensuring environmental sustainability.
What will be the Size of the Market During the Forecast Period?
- The market encompasses advanced technologies and automated solutions designed to measure and determine the oil content in various industries, including storage, safety, genetics, logistics, and food production. This market caters to the needs of vegetable production, animal fat processing, and pharmaceuticals, among others. Regulatory compliance and policy adherence are key drivers, as oil content analysis is essential for ensuring product quality, safety, and traceability. Industrial and extraction processes benefit from oil content analyzers, enabling cost reduction through improved process control optimization, waste minimization, and smart analytics.
- These systems employ AI-powered data processing, modular analyzer systems, and cloud-linked liquid analyzers for real-time monitoring and enhanced environmental monitoring. Sustainability and breeding are also relevant aspects, as accurate oil content measurement contributes to the production of low-fat products and the development of sustainable industrial processes. Maintenance complexity and industrial safety protocols are addressed through automated solutions, ensuring efficient and secure operations. Overall, the market continues to grow, driven by the increasing demand for regulatory compliance, quality assurance, and cost reduction in various industries.
How is this Oil Content Analyzer Industry segmented and which is the largest segment?
The oil content analyzer industry research report provides comprehensive data (region-wise segment analysis), with forecasts and estimates in "USD million" for the period 2025-2029, as well as historical data from 2019-2023 for the following segments.
- Technology
- NIR spectroscopy
- Chemical extraction
- Gravimetric method
- Others
- End-user
- Food and beverage
- Pharmaceutical
- Oil and gas
- Others
- Geography
- North America
- Canada
- US
- Europe
- Germany
- UK
- France
- APAC
- China
- India
- Japan
- South Korea
- Middle East and Africa
- South America
- Brazil
- North America
By Technology Insights
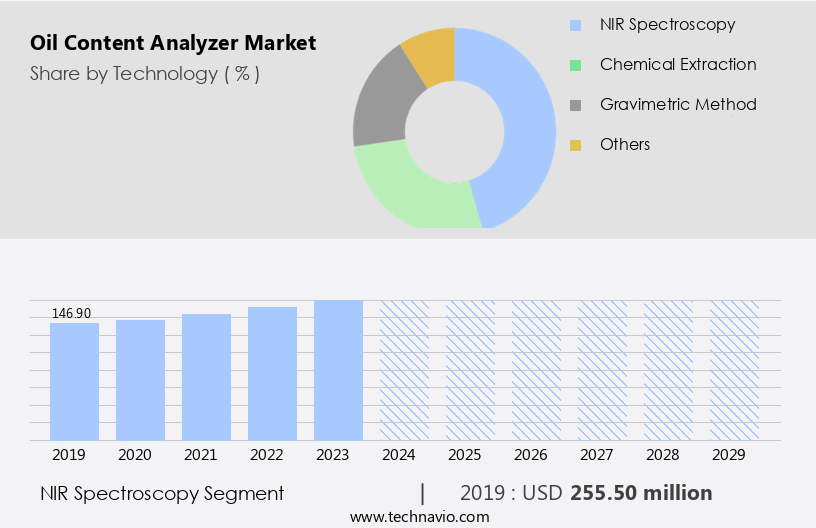
- The NIR spectroscopy segment is estimated to witness significant growth during the forecast period.
The market is primarily driven by the adoption of near infrared (NIR) spectroscopy technology. This non-destructive, rapid, and highly precise method utilizes near infrared light to measure oil content by detecting the absorption of specific wavelengths. NIR spectroscopy is extensively used in various industries, including food and beverage for ensuring product quality and safety through accurate measurement of oil and fat content, petrochemical for monitoring and analyzing oil composition to optimize processes and comply with environmental regulations, and industrial lubricant sectors for real-time monitoring and analysis, ensuring machinery performance and longevity. NIR spectroscopy's benefits, such as operational efficiency, economic implications, and sustainability, are further enhanced by technological advancements, including sensor technology, automation, IoT, and digital transformation. The regulatory framework, including environmental regulations and emissions control, also plays a significant role in market growth.
Get a glance at the market report of share of various segments Request Free Sample
The NIR spectroscopy segment was valued at USD 255.50 million in 2019 and showed a gradual increase during the forecast period.
Regional Analysis
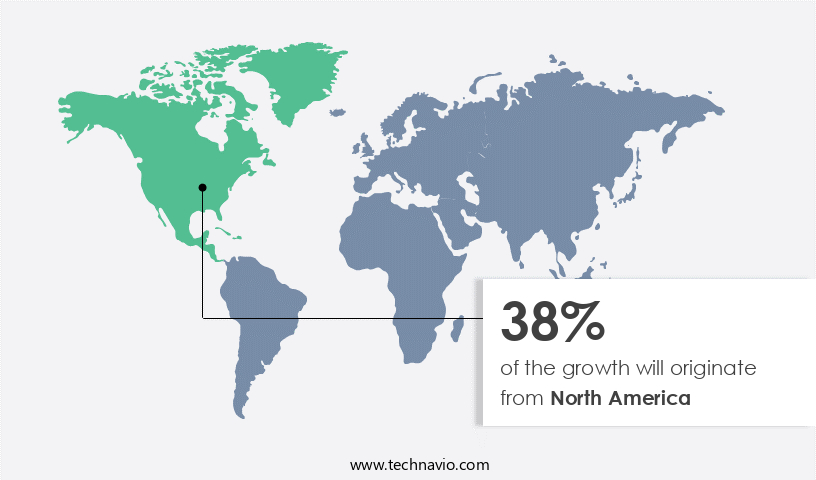
- North America is estimated to contribute 38% to the growth of the global market during the forecast period.
Technavio's analysts have elaborately explained the regional trends and drivers that shape the market during the forecast period.
For more insights on the market size of various regions, Request Free Sample
The market in North America is driven by regulatory compliance and the need for operational efficiency in various industries, including water treatment, food processing, and petroleum. Strict environmental regulations from agencies like the EPA, FDA, and USDA necessitate the use of oil content analyzers to ensure product quality and environmental sustainability. In the US, the oil and natural gas industry saw a production increase in 2023, averaging 13 million barrels per day. This growth has fueled the demand for oil content analyzers in refining processes, particularly for monitoring and controlling oil levels to minimize environmental impact and ensure regulatory compliance.
Technological advancements, such as sensor technology, AI, and IoT, have led to the development of portable and automated systems, reducing human error and increasing accuracy. Additionally, the market is influenced by the need for self-diagnostic tools, multi-parameter monitoring, and connectivity features for industrial laboratories and field testing. The economic implications of using oil content analyzers include energy efficiency, low-maintenance solutions, and process optimization in chemical production and pharmaceutical industries. Sustainability initiatives and emissions control are also significant factors driving market growth.
Market Dynamics
Our researchers analyzed the data with 2024 as the base year, along with the key drivers, trends, and challenges. A holistic analysis of drivers will help companies refine their marketing strategies to gain a competitive advantage.
What are the key market drivers leading to the rise in the adoption of the Oil Content Analyzer Industry?
Stringent environmental regulations are the key driver of the market.
- The market is driven by stringent environmental regulations, as industries are mandated to monitor and control oil discharge levels to ensure regulatory compliance. Regulatory bodies impose strict limits on oil contamination in water bodies, industrial wastewater, and emissions to mitigate environmental damage and protect aquatic life. In the US, the Environmental Protection Agency (EPA) enforces the Clean Water Act (CWA), which requires industries to limit oil discharge into navigable waters. This regulation necessitates the use of advanced oil content analyzers in wastewater treatment plants, refineries, and offshore oil platforms for accurate measurement of oil and grease content using techniques such as n-hexane extraction and gravimetric analysis.
- The growth of the market is driven by advanced sensor technology, automation, IoT, and Artificial Intelligence, which facilitate real-time monitoring, process optimization, and enhanced quality control. These technological advancements reduce human error, enhance operational efficiency, and improve product shelf life. The market caters to various industries, including food processing, chemical production, pharmaceuticals, and gas processing, among others. The increasing focus on sustainability and environmental monitoring further fuels the demand for oil content analyzers in industrial laboratories and field testing. Moreover, the market is witnessing digital transformation, with wireless communication, connectivity features, and digital twin frameworks enabling comprehensive analysis, quality assurance, and self-diagnostic tools.
What are the market trends shaping the Oil Content Analyzer Industry?
Rising demand for handheld analyzers is the upcoming market trend.
- Handheld oil content analyzers are gaining popularity in various industries, including oil and gas, food processing, and environmental monitoring, due to their portability and real-time analysis capabilities. These devices enable businesses to assess oil contamination, degradation, and quality on-site, ensuring operational efficiency, regulatory compliance, and optimized maintenance schedules. In the oil and gas sector, handheld analyzers are essential for detecting oil contamination in water and complying with environmental discharge regulations. Sensor technology, IoT, and automation are integral to these analyzers, providing accurate measurements, multi-parameter monitoring, and connectivity features.
- The food processing industry uses handheld analyzers for content measurement in edible oils, ensuring product quality and shelf life. Industrial laboratories and research institutes also employ these analyzers for comprehensive analysis and quality assurance. Handheld oil content analyzers contribute to sustainability initiatives by reducing the need for external laboratory testing, human error, and supply chain disruptions. Additionally, they support emissions control, energy efficiency, and environmental monitoring, aligning with industrial base digital transformation and environmental regulations.
What challenges does the Oil Content Analyzer Industry face during its growth?
High initial cost and maintenance expenses are a key challenge affecting the industry growth.
- The market faces a significant challenge due to the high initial investment and maintenance costs of advanced analyzers. These analyzers, which utilize advanced technologies such as infrared (IR) spectroscopy, nuclear magnetic resonance (NMR), and chromatography, carry a substantial price tag. For instance, the CEM SMART 6 Moisture and Solids Analyzer, commonly used in food and chemical industries for oil content measurement, ranges from USD 20,000 to USD 30,000 depending on the model and specifications. This financial hurdle poses a challenge for small and medium-sized enterprises (SMEs), who may find it challenging to justify the investment. Advanced sensor technology, automation, IoT, and AI are driving technological advancements in oil content analyzers.
- These technologies enable accurate content measurement, quality control, product shelf life enhancement, environmental monitoring, and regulatory compliance. Additionally, the market is witnessing a shift towards low-maintenance solutions and digital transformation to optimize production processes and enhance operational efficiency. Oil content analyzers are essential in various industries, including food processing, refining, chemical production, pharmaceuticals, and gas processing. They play a crucial role in ensuring product quality, reducing human error, and minimizing contamination. Moreover, they help in detecting pipeline leaks, ensuring regulatory compliance, and promoting environmental sustainability. The market for oil content analyzers is subject to regulatory frameworks and environmental directives.
Exclusive Customer Landscape
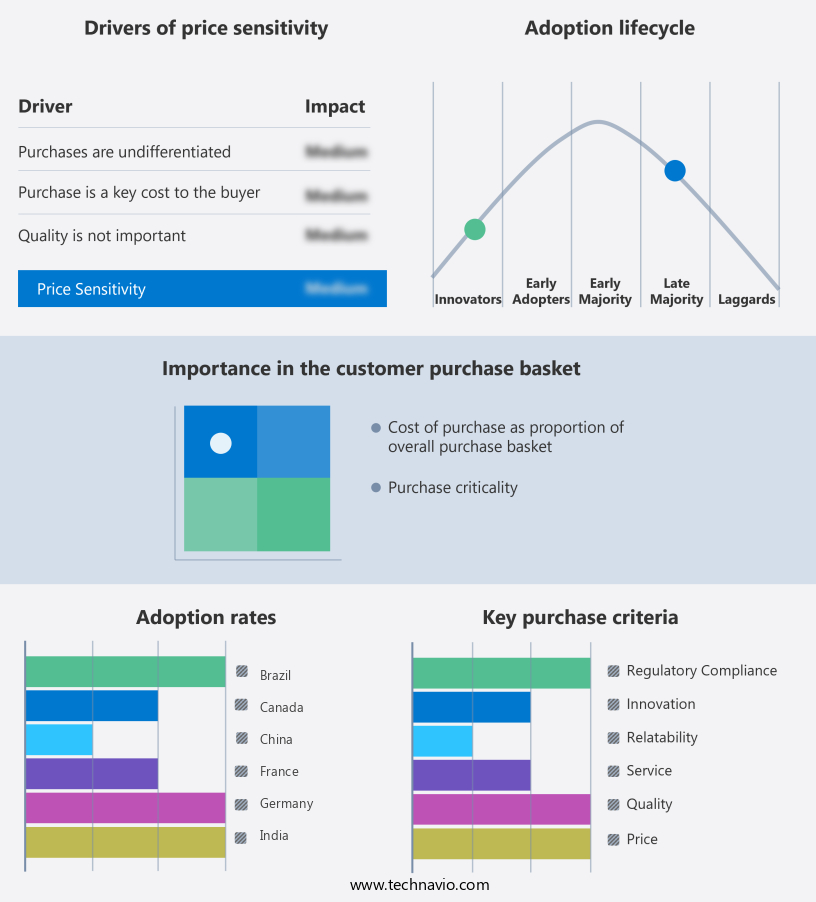
The market forecasting report includes the adoption lifecycle of the market, covering from the innovator's stage to the laggard's stage. It focuses on adoption rates in different regions based on penetration. Furthermore, the market report also includes key purchase criteria and drivers of price sensitivity to help companies evaluate and develop their market growth analysis strategies.
Customer Landscape
Key Companies & Market Insights
Companies are implementing various strategies, such as strategic alliances, market forecast, partnerships, mergers and acquisitions, geographical expansion, and product/service launches, to enhance their presence in the industry.
ABB Ltd. - The company offers oil content analyzers such as FTPA200-HP260 Process FT-IR analyzers designed for real-time, online process monitoring and process control of hydrocarbon streams.
The industry research and growth report includes detailed analyses of the competitive landscape of the market and information about key companies, including:
- Advanced Sensors
- Ametek Spectro Scientific
- Bruker Corp.
- eralytics GmbH
- FOSS
- HORIBA Ltd.
- Kam Controls
- Labotronics Scientific
- Labtron Equipment Ltd.
- Lumex Instruments
- Perkin Elmer Inc.
- Shanghai BOQU Instrument Co. Ltd.
- Sheng-Hanp.
- Teledyne Analytical Instruments
- Turner Designs Inc.
- Zeltex LLC
- ZEUTEC
Qualitative and quantitative analysis of companies has been conducted to help clients understand the wider business environment as well as the strengths and weaknesses of key industry players. Data is qualitatively analyzed to categorize companies as pure play, category-focused, industry-focused, and diversified; it is quantitatively analyzed to categorize companies as dominant, leading, strong, tentative, and weak.
Research Analyst Overview
The market encompasses a range of analytical instruments used to measure and monitor the content of various liquids, including crude oil and edible oils, in production processes and industrial laboratories. These analyzers play a crucial role in ensuring operational efficiency, product quality, and regulatory compliance in various industries, such as food processing, chemical production, and refining. Sensor technology is a key component of oil content analyzers, enabling accurate and reliable measurements. Infrared content analyzers, for instance, utilize infrared radiation to determine the oil content in a liquid sample. Sensor technologies continue to evolve, with advancements in AI and IoT integration enabling automated systems and wireless communication for on-site testing and real-time monitoring.
Further, operational efficiency is a significant economic implication of oil content analyzers, as they help minimize human error and reduce the need for labor-intensive manual testing. In addition, these analyzers contribute to sustainability initiatives by promoting efficient use of resources and minimizing waste. Regulatory frameworks play a critical role in the market, as these instruments are essential for ensuring compliance with environmental regulations and emissions control directives. In the food and beverage industry, for example, accurate measurement of oil content is necessary for product labeling and quality control. In the pharmaceutical industry, oil content analyzers are used to ensure the quality and consistency of raw materials and finished products.
In addition, environmental sustainability is a growing concern in the market, with a focus on low-maintenance solutions and renewable energies. Self-diagnostic tools and multi-parameter monitoring capabilities enable predictive maintenance and reduce downtime, while digital transformation and digital twin frameworks facilitate process optimization and supply chain resilience. The market is characterized by ongoing technological advancements and research initiatives. Research institutes and industrial laboratories are continually exploring new applications and improving existing technologies to enhance operational efficiency, product quality, and regulatory compliance. Field testing and benchtop analyzers provide flexibility and mobility, allowing for testing in various settings and applications. Despite the benefits of oil content analyzers, challenges remain, including the need for skilled personnel to operate and maintain these complex systems and the potential for supply chain disruptions due to economic or geopolitical factors.
|
Market Scope |
|
|
Report Coverage |
Details |
|
Page number |
209 |
|
Base year |
2024 |
|
Historic period |
2019-2023 |
|
Forecast period |
2025-2029 |
|
Growth momentum & CAGR |
Accelerate at a CAGR of 5.6% |
|
Market growth 2025-2029 |
USD 245.8 million |
|
Market structure |
Fragmented |
|
YoY growth 2024-2025(%) |
5.4 |
|
Key countries |
US, China, Germany, Canada, UK, Japan, France, India, South Korea, and Brazil |
|
Competitive landscape |
Leading Companies, Market Positioning of Companies, Competitive Strategies, and Industry Risks |
What are the Key Data Covered in this Oil Content Analyzer Market Research and Growth Report?
- CAGR of the Oil Content Analyzer industry during the forecast period
- Detailed information on factors that will drive the market growth and forecasting between 2025 and 2029
- Precise estimation of the size of the market and its contribution of the industry in focus to the parent market
- Accurate predictions about upcoming growth and trends and changes in consumer behaviour
- Growth of the market across North America, Europe, APAC, Middle East and Africa, and South America
- Thorough analysis of the market's competitive landscape and detailed information about companies
- Comprehensive analysis of factors that will challenge the oil content analyzer market growth of industry companies
We can help! Our analysts can customize this oil content analyzer market research report to meet your requirements.