
Oil Field Bio-solvents Market Size 2026-2030
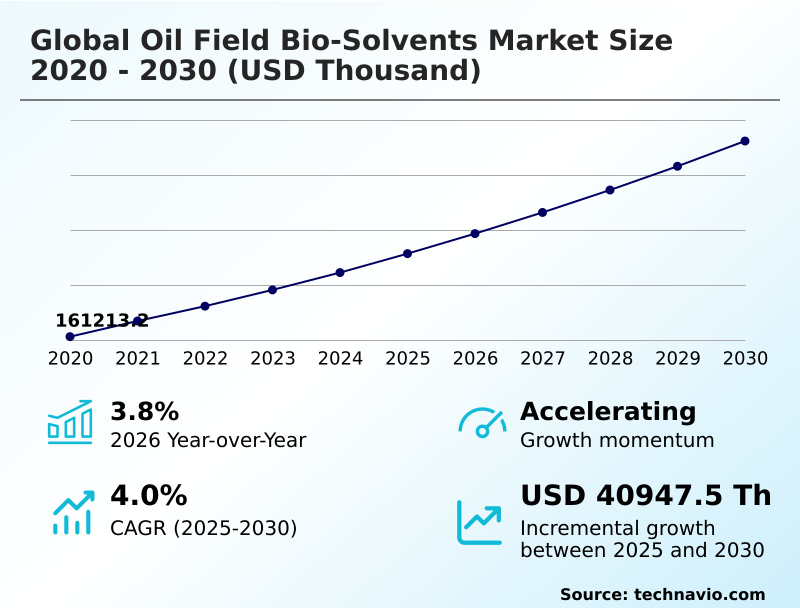
The oil field bio-solvents market size is valued to increase by USD 40.95 million, at a CAGR of 4% from 2025 to 2030. Rising global regulatory pressure and environmental compliance mandates will drive the oil field bio-solvents market.
Major Market Trends & Insights
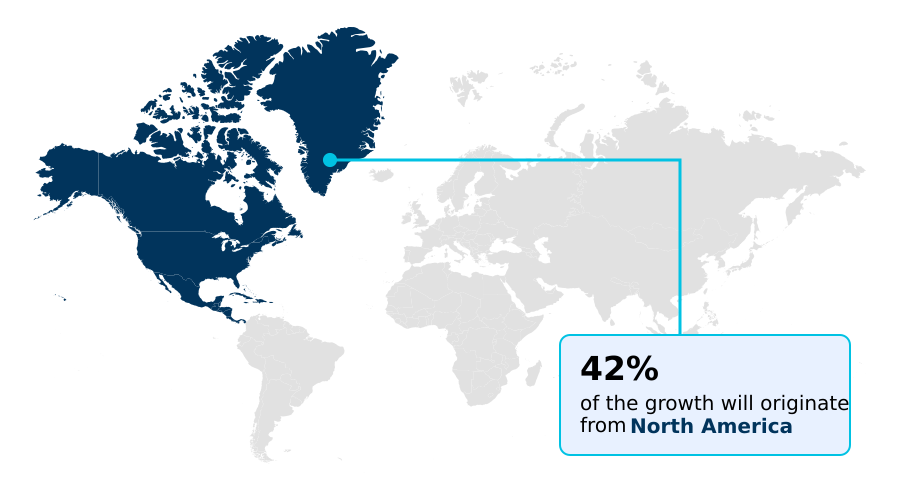
- North America dominated the market and accounted for a 42.1% growth during the forecast period.
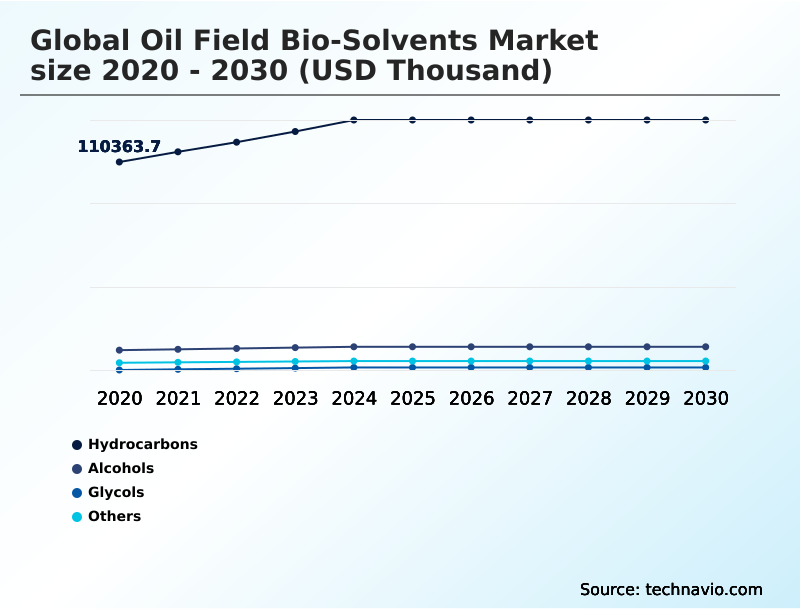
- By Type - Hydrocarbons segment was valued at USD 130.08 million in 2024
- By Application - Oil and gas segment accounted for the largest market revenue share in 2024
Market Size & Forecast
- Market Opportunities:
- Market Future Opportunities: USD 40.95 million
- CAGR from 2025 to 2030 : 4%
Market Summary
- The oil field bio-solvents market is shaped by a decisive shift toward green chemistry principles, driven by stringent environmental regulations and corporate ESG mandates. Energy producers are increasingly compelled to adopt low-toxicity solvent systems and biodegradable drilling fluids to mitigate ecological damage and avoid financial penalties associated with non-compliance.
- This transition involves replacing traditional synthetic chemicals with renewable hydrocarbon alternatives derived from vegetable oil-based esters and microbial fermentation products. A key trend is the development of multi-functional bio-formulations that combine cleaning, lubrication, and corrosion protection, streamlining rig safety chemical solutions.
- For instance, an operator in a sensitive marine environment might deploy a single, plant-based emulsifier that both stabilizes drilling mud and meets strict biodegradability requirements, reducing chemical inventory and simplifying waste management. However, adoption faces challenges from renewable feedstock price volatility and the need for bio-solvent thermal stability in high-pressure, high-temperature wells.
- Technical advancements in bio-refining technologies and advanced molecular synthesis are crucial for overcoming these performance hurdles and improving the economic viability of sustainable oilfield chemicals, supporting a broader circular economy in energy.
What will be the Size of the Oil Field Bio-solvents Market during the forecast period?
Get Key Insights on Market Forecast (PDF) Get Free Sample
How is the Oil Field Bio-solvents Market Segmented?
The oil field bio-solvents industry research report provides comprehensive data (region-wise segment analysis), with forecasts and estimates in "USD thousand" for the period 2026-2030, as well as historical data from 2020-2024 for the following segments.
- Type
- Hydrocarbons
- Alcohols
- Glycols
- Others
- Application
- Oil and gas
- Transportation
- Others
- Product type
- Surfactants
- Emulsifying agents
- Viscosity modifiers
- Solubilizing agents
- Grade type
- Industrial grade
- Technical grade
- High purity grade
- Food grade
- Geography
- North America
- US
- Canada
- Mexico
- Europe
- Germany
- UK
- France
- APAC
- China
- India
- Japan
- Middle East and Africa
- Saudi Arabia
- UAE
- South Africa
- South America
- Brazil
- Argentina
- Rest of World (ROW)
- North America
By Type Insights
The hydrocarbons segment is estimated to witness significant growth during the forecast period.
The hydrocarbons segment is shifting toward renewable chemical feedstock solutions, such as citrus-derived terpenes and bio-paraffins produced via advanced molecular synthesis.
These eco-friendly degreasing agents offer a critical advantage by lacking the aromatic compounds found in mineral oil alternatives, significantly reducing environmental and health risks in offshore operations.
Bio-based hydrocarbons possess high flash point solvents, ensuring safety in high-temperature environments, and provide superior solvency for asphaltene dissolution agents and paraffin wax inhibitors.
This technical performance, often matching or exceeding synthetic counterparts, allows operators to maintain high productivity while complying with environmental mandates.
Formulations based on oleochemical derivatives have demonstrated a 15% increase in cleaning efficiency, underscoring the performance parity achieved by these renewable hydrocarbon alternatives in demanding oilfield applications.
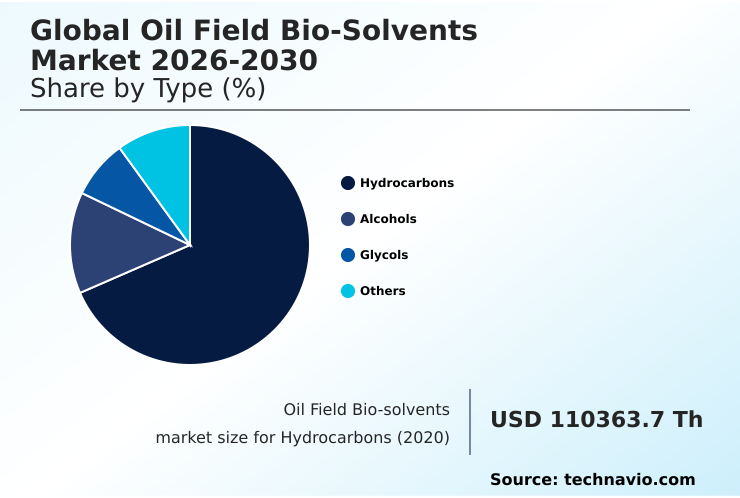
The Hydrocarbons segment was valued at USD 130.08 million in 2024 and showed a gradual increase during the forecast period.
Regional Analysis
North America is estimated to contribute 42.1% to the growth of the global market during the forecast period.Technavio’s analysts have elaborately explained the regional trends and drivers that shape the market during the forecast period.
See How Oil Field Bio-solvents Market Demand is Rising in North America Get Free Sample
The geographic landscape of the market is led by North America, which is projected to account for 42.1% of the market's incremental growth and expand at a rate of 4.7%.
This region's dominance is driven by stringent environmental regulations and a focus on green extraction technologies. Europe follows with a 4.1% growth rate, prioritizing a circular economy in energy and sustainable surfactant technology for its mature offshore fields.
In APAC, the focus is on leveraging abundant agricultural resources for plant-based emulsifiers and eco-friendly stimulation fluids.
The global adoption of bio-solvent lifecycle assessment methodologies is influencing procurement decisions, with a growing emphasis on subsea pipeline maintenance solutions that minimize ecological impact.
This regional differentiation highlights how local regulations and resource availability shape the implementation of sustainable oilfield chemicals worldwide.
Market Dynamics
Our researchers analyzed the data with 2025 as the base year, along with the key drivers, trends, and challenges. A holistic analysis of drivers will help companies refine their marketing strategies to gain a competitive advantage.
- The strategic implementation of advanced chemistries is reshaping oilfield operations, with a specific focus on performance and sustainability. The use of bio-solvents for heavy crude oil removal is becoming critical in mature fields, where these agents improve recovery rates without the harsh environmental impact of traditional solvents.
- Similarly, the deployment of plant-derived solvents for well stimulation helps operators enhance reservoir permeability in a more eco-compliant manner. A comprehensive cost-benefit analysis of green oilfield chemicals often reveals long-term savings, with some operators reporting lower environmental compliance expenditures compared to those using legacy systems.
- The evaluation of bio-based solvent performance in deepwater drilling is a key area of research, as these environments demand exceptional thermal stability and material compatibility. Furthermore, the regulatory impact on bio-solvent market adoption continues to be the primary catalyst, pushing the industry toward greener alternatives.
- As companies navigate these complexities, the ability to balance technical efficacy with environmental stewardship defines market leadership and operational resilience in a rapidly evolving energy landscape.
What are the key market drivers leading to the rise in the adoption of Oil Field Bio-solvents Industry?
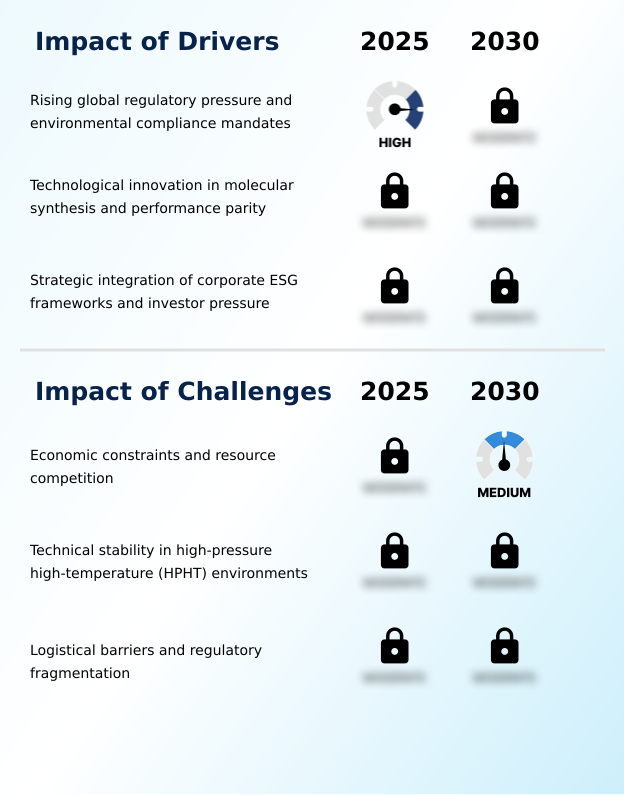
- Rising global regulatory pressure and environmental compliance mandates are a key driver for the market.
- The primary driver for market expansion is the global push for environmental compliance and sustainable operations. A stringent regulatory framework for biosolvents, including mandates for chemicals to exceed 90% biodegradability in offshore environments, compels the adoption of biodegradable drilling fluids.
- This shift is part of a broader move toward a green chemistry supply chain and sustainable chemical procurement strategies that prioritize low-toxicity solvent systems.
- Technological advancements allow these green chemistry principles to deliver tangible benefits, such as a 15% increase in cleaning efficiency.
- These innovations not only meet compliance demands but also enhance rig safety chemical solutions by reducing volatile organic compound reduction, proving that environmental responsibility can align with operational excellence.
What are the market trends shaping the Oil Field Bio-solvents Industry?
- A key market trend is the emergence of multi-functional bio-solvent formulations. These are designed to perform several tasks, such as cleaning and lubrication, simultaneously.
- Key market trends are centered on innovation in chemical design and application optimization. The development of multi-functional bio-formulations allows single products to deliver both cleaning and corrosion protection, streamlining operations. This is complemented by a move toward second-generation feedstock sourcing, which leverages agricultural residue valorization and waste-to-solvent conversion techniques to improve sustainability.
- These advanced materials are used to formulate green completion fluids and enhanced oil recovery chemicals. Furthermore, digital solvent management platforms enable data-driven chemical optimization, ensuring precise application and reducing waste.
- Innovations in this space have led to formulations demonstrating up to a 15% increase in cleaning efficiency in deepwater wellbore maintenance, while new AI-powered systems aim to optimize injection rates to extend asset life.
What challenges does the Oil Field Bio-solvents Industry face during its growth?
- Economic constraints and resource competition represent a key challenge affecting industry growth.
- Significant market challenges stem from economic and technical hurdles. The renewable feedstock price volatility creates financial uncertainty, with shifts in agricultural priorities causing procurement costs for bio-based esters to increase by as much as 15%. This economic pressure complicates the cost-benefit analysis for operators.
- On a technical level, ensuring bio-solvent thermal stability in high-pressure, high-temperature environments remains a persistent issue, as many plant-derived molecules can degrade above 220 degrees Celsius. This limits the replacement of synthetic alternatives in demanding deepwater projects.
- Additionally, industrial bio-solvent logistics and the need for specialized storage add complexity and cost, while the lack of standardized regulations for non-food biomass utilization creates compliance fragmentation across different regions, hindering streamlined global deployment.
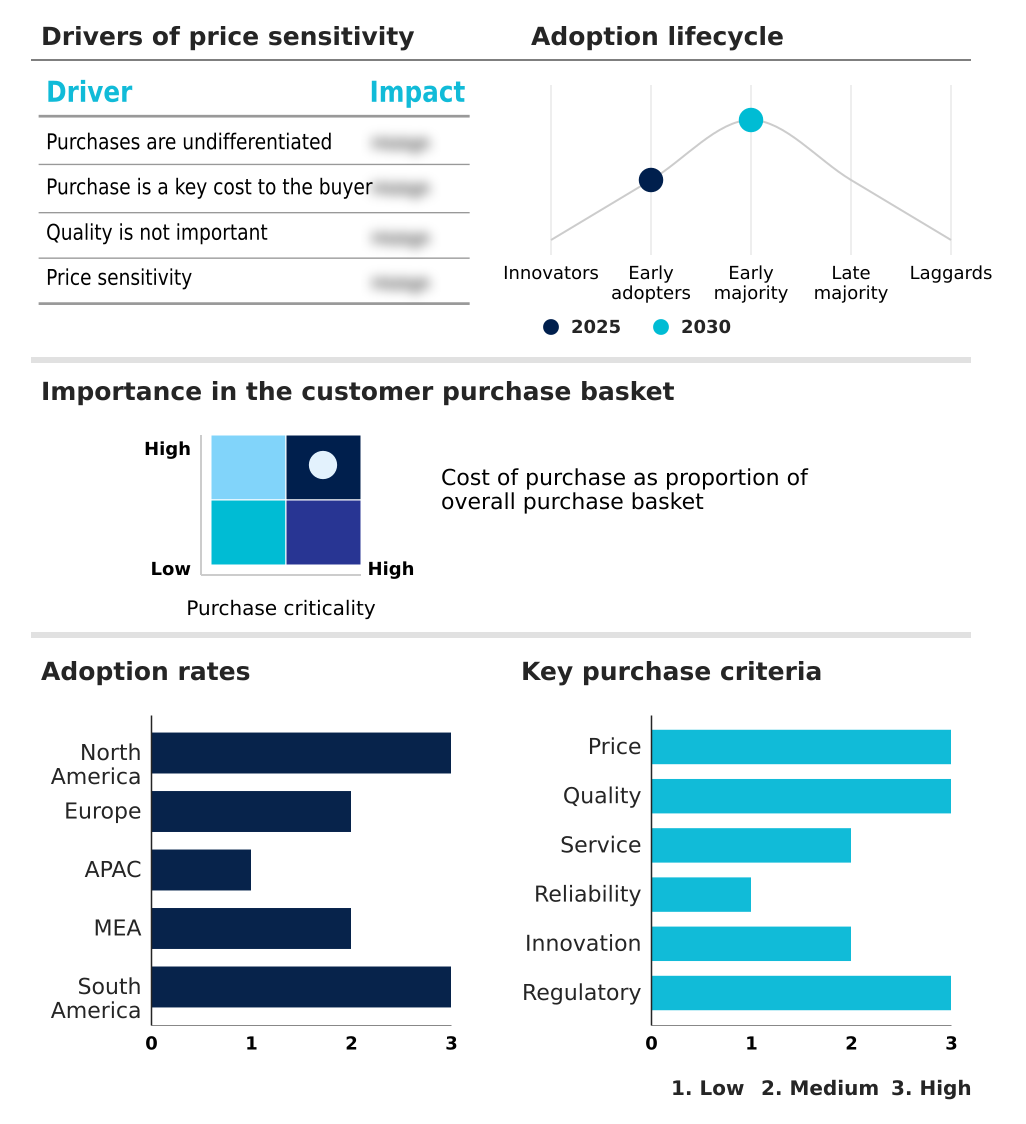
Exclusive Technavio Analysis on Customer Landscape
The oil field bio-solvents market forecasting report includes the adoption lifecycle of the market, covering from the innovator’s stage to the laggard’s stage. It focuses on adoption rates in different regions based on penetration. Furthermore, the oil field bio-solvents market report also includes key purchase criteria and drivers of price sensitivity to help companies evaluate and develop their market growth analysis strategies.
Customer Landscape of Oil Field Bio-solvents Industry
Competitive Landscape
Companies are implementing various strategies, such as strategic alliances, oil field bio-solvents market forecast, partnerships, mergers and acquisitions, geographical expansion, and product/service launches, to enhance their presence in the industry.
Arkema Group - Key offerings include advanced bio-based solvents, biodegradable surfactants, and specialty esters, designed to enhance performance and environmental compliance in global oilfield operations.
The industry research and growth report includes detailed analyses of the competitive landscape of the market and information about key companies, including:
- Arkema Group
- Ashland Inc.
- Baker Hughes Co.
- BASF SE
- Cargill Inc.
- Clariant International Ltd.
- Colonial Chemical Inc.
- Croda International Plc
- Dow Chemical Co.
- Eastman Chemical Co.
- Emery Oleochemicals
- Evonik Industries AG
- GEO Specialty Chemicals Inc.
- Halliburton Co.
- Huntsman International LLC
- Kemira Oyj
- Sasol Ltd.
- Schlumberger Ltd.
- Solvay SA
- Stepan Co.
Qualitative and quantitative analysis of companies has been conducted to help clients understand the wider business environment as well as the strengths and weaknesses of key industry players. Data is qualitatively analyzed to categorize companies as pure play, category-focused, industry-focused, and diversified; it is quantitatively analyzed to categorize companies as dominant, leading, strong, tentative, and weak.
Recent Development and News in Oil field bio-solvents market
- In May, 2025, Croda International PLC introduced a novel bio-solvent range specifically engineered to provide both asphaltene dissolution and long-term corrosion protection in high-salinity subsea pipelines.
- In June, 2025, Clariant AG introduced a new series of high-performance bio-solvents derived from sustainable rice bran oil that demonstrated a 15% increase in cleaning efficiency for deepwater wellbore maintenance.
- In September, 2025, Shell PLC announced a joint venture to build a specialized facility dedicated to the conversion of agricultural waste into high-purity bio-solvents for use in sensitive offshore drilling environments in the North Sea.
- In November, 2025, International Business Machines Corporation launched an artificial intelligence platform designed to optimize the injection rates of specialty bio-chemicals in mature oil fields to extend asset life while minimizing environmental exposure.
Dive into Technavio’s robust research methodology, blending expert interviews, extensive data synthesis, and validated models for unparalleled Oil Field Bio-solvents Market insights. See full methodology.
| Market Scope | |
|---|---|
| Page number | 337 |
| Base year | 2025 |
| Historic period | 2020-2024 |
| Forecast period | 2026-2030 |
| Growth momentum & CAGR | Accelerate at a CAGR of 4% |
| Market growth 2026-2030 | USD 40947.5 thousand |
| Market structure | Fragmented |
| YoY growth 2025-2026(%) | 3.8% |
| Key countries | US, Canada, Mexico, Germany, UK, France, Italy, Spain, The Netherlands, China, India, Japan, Australia, South Korea, Indonesia, Saudi Arabia, UAE, South Africa, Turkey, Israel, Brazil, Argentina and Chile |
| Competitive landscape | Leading Companies, Market Positioning of Companies, Competitive Strategies, and Industry Risks |
Research Analyst Overview
- The market is undergoing a significant transformation centered on the adoption of sustainable wellbore cleaning and green completion fluids. This shift is driven by the need for low-toxicity solvent systems that comply with stringent environmental regulations while delivering high performance.
- Key technologies include vegetable oil-based esters, citrus-derived terpenes, and microbial fermentation products, which serve as effective asphaltene dissolution agents and paraffin wax inhibitors. The application of these eco-friendly degreasing agents and non-toxic drilling muds is critical for subsea pipeline maintenance and enhanced oil recovery chemicals.
- A notable boardroom-level consideration is the strategic advantage gained from using high flash point solvents, which improve rig safety and align with corporate ESG goals. Formulations utilizing oleochemical derivatives have demonstrated a 15% increase in cleaning efficiency, validating the performance of renewable hydrocarbon alternatives.
- The integration of bio-refining technologies for agricultural residue valorization and sustainable surfactant technology underpins this industrial evolution toward green chemistry principles.
What are the Key Data Covered in this Oil Field Bio-solvents Market Research and Growth Report?
-
What is the expected growth of the Oil Field Bio-solvents Market between 2026 and 2030?
-
USD 40.95 million, at a CAGR of 4%
-
-
What segmentation does the market report cover?
-
The report is segmented by Type (Hydrocarbons, Alcohols, Glycols, and Others), Application (Oil and gas, Transportation, and Others), Product Type (Surfactants, Emulsifying agents, Viscosity modifiers, and Solubilizing agents), Grade Type (Industrial grade, Technical grade, High purity grade, and Food grade) and Geography (North America, Europe, APAC, Middle East and Africa, South America)
-
-
Which regions are analyzed in the report?
-
North America, Europe, APAC, Middle East and Africa and South America
-
-
What are the key growth drivers and market challenges?
-
Rising global regulatory pressure and environmental compliance mandates, Economic constraints and resource competition
-
-
Who are the major players in the Oil Field Bio-solvents Market?
-
Arkema Group, Ashland Inc., Baker Hughes Co., BASF SE, Cargill Inc., Clariant International Ltd., Colonial Chemical Inc., Croda International Plc, Dow Chemical Co., Eastman Chemical Co., Emery Oleochemicals, Evonik Industries AG, GEO Specialty Chemicals Inc., Halliburton Co., Huntsman International LLC, Kemira Oyj, Sasol Ltd., Schlumberger Ltd., Solvay SA and Stepan Co.
-
Market Research Insights
- Market dynamics are influenced by a strategic focus on sustainable chemical procurement, where operators prioritize eco-friendly stimulation fluids to align with stringent environmental compliance. This shift is substantiated by mandates requiring chemicals to achieve a biodegradability rate exceeding 90% within 28 days in all offshore interventions.
- The adoption of advanced bio-based formulations has yielded tangible performance gains, with some high-performance bio-solvents demonstrating a 15% increase in cleaning efficiency for wellbore maintenance compared to conventional options. This data-driven chemical optimization not only enhances operational effectiveness but also supports corporate sustainability goals, reinforcing the business case for transitioning away from traditional chemistries.
- The development of multi-functional bio-formulations and waste-to-solvent conversion technologies further exemplifies the industry's commitment to innovation and resource efficiency.
We can help! Our analysts can customize this oil field bio-solvents market research report to meet your requirements.
 RIA -
RIA - 
