
Pressure Pumping Market Size 2024-2028
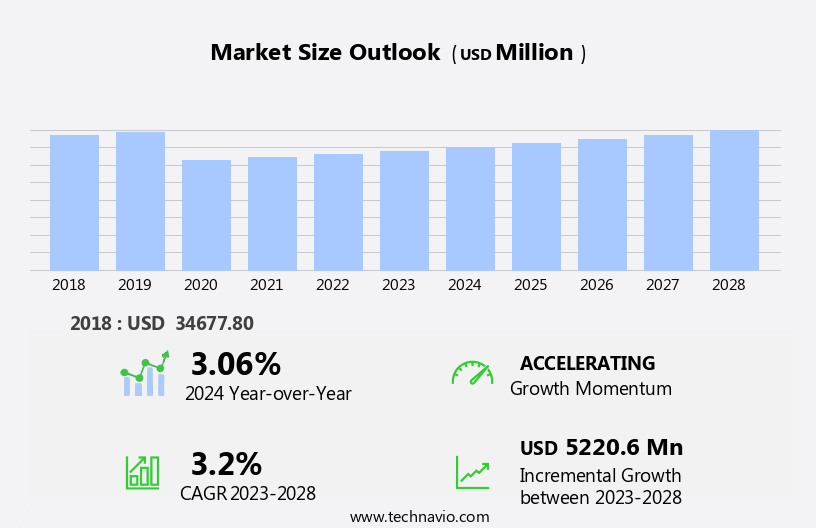
The pressure pumping market size is forecast to increase by USD 5.22 billion, at a CAGR of 3.2% between 2023 and 2028.
- The market is experiencing significant growth, driven by the surge in investments in oil and gas exploration and production (E&P) activities. This trend is further fueled by the increasing number of deepwater and ultra-deepwater upstream projects worldwide. However, the market faces challenges as well. The growing adoption of renewable sources of energy is shifting the industry focus, potentially reducing the demand for traditional pressure pumping services. A key challenge for pressure pumping companies is adapting to this energy transition while maintaining competitiveness.
- Additionally, operational efficiency and cost reduction remain critical factors as market players strive to maximize profits amidst increasing competition. Companies that can effectively navigate these challenges and capitalize on the opportunities presented by the evolving energy landscape will be well-positioned for success in the market.
What will be the Size of the Pressure Pumping Market during the forecast period?
Explore in-depth regional segment analysis with market size data - historical 2018-2022 and forecasts 2024-2028 - in the full report.
Request Free Sample
The market continues to evolve, driven by the ongoing quest for operational efficiency and Enhanced Oil Recovery in various sectors. Well stimulation techniques, such as fracking stages and reservoir characterization, play a crucial role in maximizing well productivity. Electric lift and equipment maintenance are essential components of ensuring consistent production. Data acquisition and analysis are integral to optimizing production and reducing costs. Water recycling and wastewater management are increasingly important in minimizing environmental impact. Reservoir stimulation and safety standards are key considerations in the evolving landscape of pressure pumping services. Pumping systems, including high-pressure pumps and surface pumping units, are essential for efficient well intervention and completion techniques.
Logistics and transportation, treatment design, and the use of fracturing additives are all critical elements of successful fracking operations. The market is characterized by continuous innovation, with advancements in downhole tools, artificial lift, and remote monitoring. Unconventional resources, such as tight oil and Shale Gas, are driving demand for pressure pumping services. Regulatory compliance and environmental impact are also significant factors shaping market dynamics. Well performance is a key focus, with seismic analysis, hydraulic fracture monitoring, and flowback analysis all playing important roles in optimizing production. Wellbore integrity and the use of ceramic proppant are essential for ensuring well productivity.
The market is a complex and dynamic ecosystem, with ongoing activities in pumping rate optimization, injection pressure management, and completion techniques. The integration of eor techniques, such as carbon sequestration, is a promising area of development. Overall, the market is characterized by a constant unfolding of patterns and evolving market activities.
How is this Pressure Pumping Industry segmented?
The pressure pumping industry research report provides comprehensive data (region-wise segment analysis), with forecasts and estimates in "USD million" for the period 2024-2028, as well as historical data from 2018-2022 for the following segments.
- Type
- Hydraulic fracturing
- Cementing
- Others
- Application
- Horizontal well
- Vertical well
- Geography
- North America
- US
- Canada
- APAC
- China
- Rest of World (ROW)
- North America
.
By Type Insights
The hydraulic fracturing segment is estimated to witness significant growth during the forecast period.
Hydraulic fracturing, a process that involves injecting a high-pressure mixture of water, sand, and chemicals into rock formations, is a crucial aspect of the oil and gas industry. This technique creates new fractures and expands existing ones, enhancing oil and gas production from wells. The demand for hydraulic fracturing is significant due to its ability to increase effective drainage areas, reduce the number of required wells, and minimize asphalt deposition in wells. Pressure pumping services play a vital role in hydraulic fracturing, providing the necessary high-pressure conditions for the process. These services enable the drilling industry to operate more efficiently and effectively, particularly in the context of enhanced oil recovery and well stimulation.
Additionally, reservoir characterization and seismic analysis help optimize the fracturing process, ensuring maximum production and cost savings. Safety standards are paramount in the market. Compliance with regulations, wastewater management, and equipment maintenance are essential for ensuring the safe and efficient operation of pressure pumping units. Moreover, the integration of downhole tools, such as downhole motors and artificial lift systems, enhances well productivity and performance. The market for pressure pumping services is continuously evolving, with advancements in technology leading to improvements in operational efficiency and cost optimization. Innovations in hydraulic fracturing techniques, such as slickwater fracturing and high-pressure pumps, have expanded the application of pressure pumping services to unconventional resources like shale gas and tight oil.
Furthermore, the integration of remote monitoring, data acquisition, and production data analysis supports real-time optimization and enhanced production. In the realm of environmental considerations, pressure pumping services have made strides in water recycling and treatment design, minimizing the environmental impact of hydraulic fracturing. Carbon sequestration and eor techniques are also gaining traction as the industry seeks to reduce its carbon footprint and maximize resource recovery. The market is a dynamic and essential component of the oil and gas industry, with a significant impact on production enhancement, cost optimization, and operational efficiency. The integration of various technologies, such as hydraulic fracturing, electric submersible pumps, and surface pumping units, enables the industry to effectively and safely extract resources from complex reservoirs, ensuring a sustainable and efficient energy future.
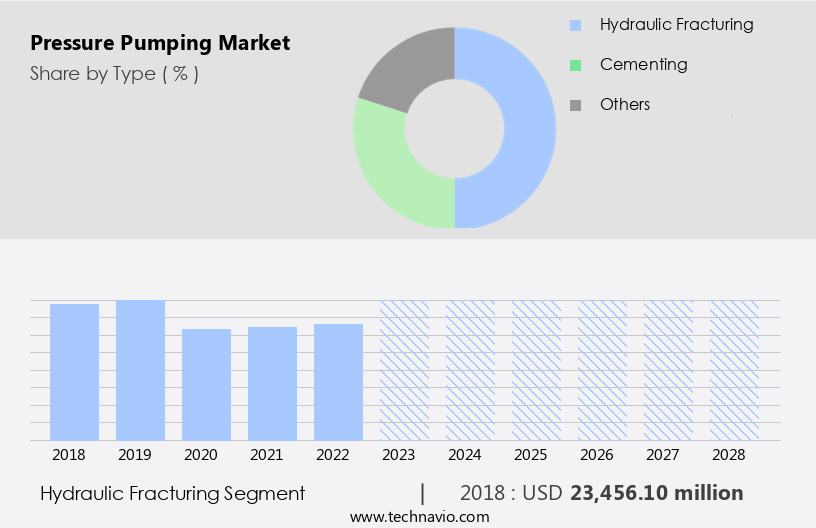
The Hydraulic fracturing segment was valued at USD 23.46 billion in 2018 and showed a gradual increase during the forecast period.
Regional Analysis
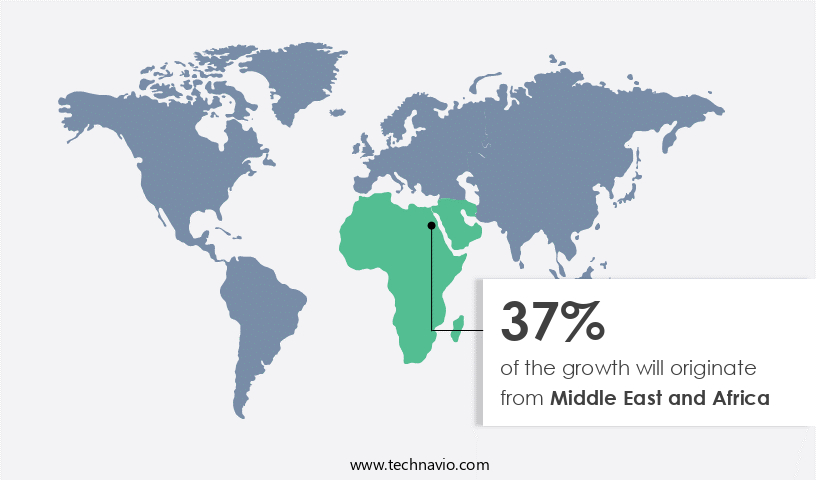
Middle East and Africa is estimated to contribute 37% to the growth of the global market during the forecast period. Technavio's analysts have elaborately explained the regional trends and drivers that shape the market during the forecast period.
The US Energy Information Administration reports that the US operated 129 refineries as of 2023, making it a significant player in global Crude Oil refining and consumption. North America, specifically the US and Canada, are major hubs for oil and gas drilling activities. In Canada, major oil and gas companies are expanding unconventional Exploration and Production (E&P) efforts by exploring the Duvernay and Montney formations for oil sands. This investment aims to compete with the prolific US shale plays. Unconventional drilling is the second largest adopter in North America, with substantial investments in Canada's E&P sector. Well logging, operational efficiency, and reservoir characterization are crucial aspects of oil and gas drilling.
Enhanced oil recovery, well stimulation, and reservoir stimulation techniques improve production and extend the life of oil and gas wells. Safety standards, production data, and production optimization ensure efficient and cost-effective operations. Water recycling, wastewater management, and environmental impact are essential considerations in modern drilling practices. Slickwater fracturing, high-pressure pumps, and fracturing additives are integral components of well stimulation. Artificial lift systems, such as electric lift and gas lift, maintain production rates. Downhole tools and equipment maintenance ensure well productivity. Logistics and transportation, treatment design, and regulatory compliance are essential aspects of field operations. Seismic analysis, hydraulic fracture monitoring, and micro-seismic monitoring provide valuable insights into reservoir behavior.
Unconventional resources, such as tight oil and shale gas, are accessed through horizontal drilling and hydraulic fracturing. EOR techniques, carbon sequestration, and production data analysis contribute to maximizing production and minimizing costs. Production enhancement strategies, such as remote monitoring and real-time data acquisition, optimize well performance. The market for pressure pumping services continues to evolve, with advancements in technology and operational efficiency.
Market Dynamics
Our researchers analyzed the data with 2023 as the base year, along with the key drivers, trends, and challenges. A holistic analysis of drivers will help companies refine their marketing strategies to gain a competitive advantage.
What are the key market drivers leading to the rise in the adoption of Pressure Pumping Industry?
- The significant increase in investments towards exploration and production (E&P) activities in the oil and gas sector serves as the primary market driver.
- The market is experiencing significant growth due to the increasing demand for unconventional resources, particularly shale gas and tight oil, which require advanced drilling techniques such as horizontal drilling and hydraulic fracturing. Regulatory compliance with environmental regulations is a key driver in the market, leading to the adoption of eor techniques, carbon sequestration, and the use of chemical additives for enhanced production. Field operations are being optimized through the implementation of remote monitoring systems, production data analysis, and the use of electric submersible pumps, surface pumping units, downhole motors, and ceramic proppant.
- The market is expected to continue its growth trajectory as companies focus on production enhancement and the development of new E and P projects to meet the increasing demand for liquid fuels from developing countries like China and India.
What are the market trends shaping the Pressure Pumping Industry?
- The trend in the energy sector indicates a significant rise in deepwater and ultra-deepwater upstream projects. These projects represent the future of the industry, with increasing demand for exploration and production in greater depths.
- The market plays a crucial role in enhancing operational efficiency in oil and gas production, particularly in deepwater and ultra-deepwater resources. Well logging, reservoir characterization, and well stimulation are essential processes in pressure pumping that contribute to reservoir understanding and optimization. Enhanced oil recovery techniques, such as fracking stages, electric lift, and water recycling, are integral to maximizing production from reservoirs. Safety standards are paramount in pressure pumping operations, ensuring the wellbore is secure and the environment is protected. Data acquisition and production optimization are key drivers for cost optimization, enabling real-time monitoring and analysis of production data.
- Equipment maintenance is essential for maintaining operational efficiency and reducing downtime. Reservoir stimulation through pressure pumping is a complex process that requires precise control of fluid injection and pressure management. The market's growth is influenced by the increasing demand for energy, advancements in technology, and the need for cost-effective production methods. Despite the challenges, the market continues to evolve, offering opportunities for innovation and growth in the oil and gas industry.
What challenges does the Pressure Pumping Industry face during its growth?
- The increasing utilization of renewable energy sources poses a significant challenge to the expansion of the industry, necessitating continuous adaptation and innovation within the sector.
- The market plays a significant role in the energy sector, particularly in the implementation of pumping systems for wastewater management in various industries, including oil and gas. One of the primary applications of pressure pumping is in slickwater fracturing, a technique used to enhance the production of tight oil and gas wells. This method relies on high pumping rates and injection pressures to effectively deliver fracking fluids and downhole tools to the reservoir. Effective reservoir management is crucial for optimizing well performance, and pressure pumping services are essential in this regard. Completion techniques, such as artificial lift and logistics and transportation, are also facilitated by pressure pumping systems.
- Treatment design and the selection of appropriate fracking fluids are key considerations in the pressure pumping process. As the energy landscape evolves, the demand for pressure pumping services is expected to continue growing due to the increasing focus on improving well productivity and reducing operational costs. The market dynamics are influenced by factors such as technological advancements, regulatory requirements, and the availability of cost-effective solutions. In conclusion, the market is a vital component of the energy sector, enabling the efficient and effective implementation of various completion techniques and contributing to the overall success of oil and gas operations.
- With a focus on innovation and continuous improvement, the market is poised to play a significant role in the future of energy production. Recent research indicates a growing trend towards the adoption of advanced technologies and sustainable practices in pressure pumping, further enhancing its importance in the energy sector.
Exclusive Customer Landscape
The pressure pumping market forecasting report includes the adoption lifecycle of the market, covering from the innovator's stage to the laggard's stage. It focuses on adoption rates in different regions based on penetration. Furthermore, the pressure pumping market report also includes key purchase criteria and drivers of price sensitivity to help companies evaluate and develop their market growth analysis strategies.
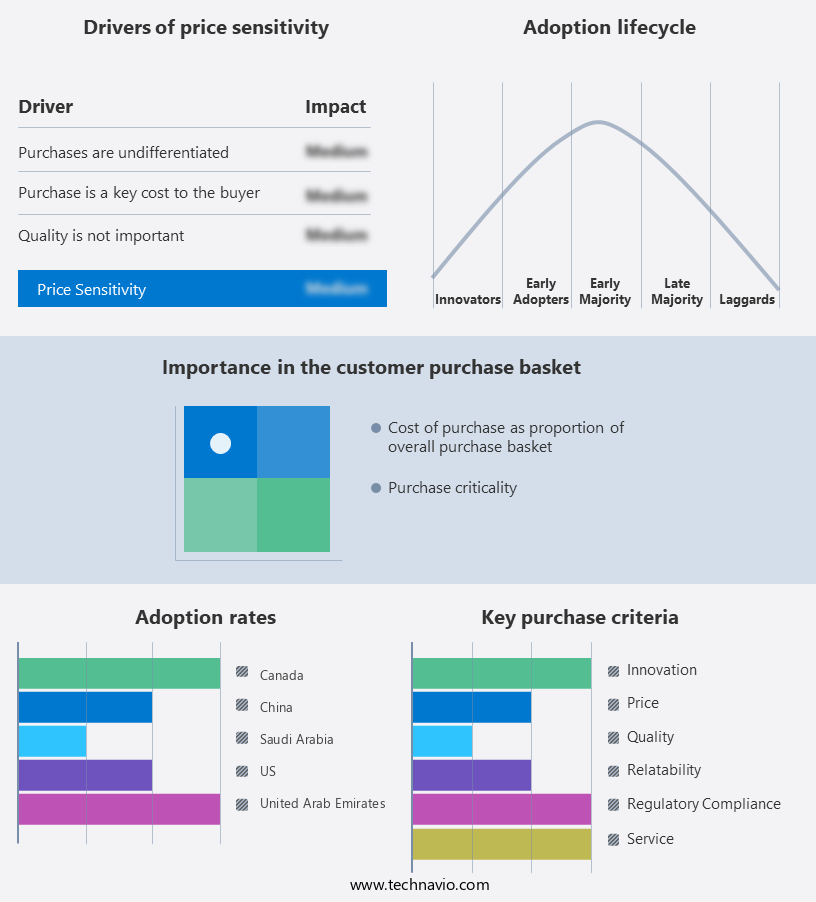
Customer Landscape
Key Companies & Market Insights
Companies are implementing various strategies, such as strategic alliances, pressure pumping market forecast, partnerships, mergers and acquisitions, geographical expansion, and product/service launches, to enhance their presence in the industry.
Baker Hughes Co. - The company delivers pressure pumping solutions, utilizing a synergistic natural gas and diesel system.
The industry research and growth report includes detailed analyses of the competitive landscape of the market and information about key companies, including:
- Baker Hughes Co.
- Calfrac Well Services Ltd.
- Danfoss AS
- Flowserve Corp.
- Halliburton Co.
- ITT Inc.
- KAMAT GmbH and Co. KG
- KSB SE and Co. KGaA
- LEWA GmbH
- MAXIMATOR GmbH
- NOV Inc.
- Patterson UTI Energy Inc.
- RPC Inc.
- Sam Turbo Industry Pvt. Ltd.
- Schlumberger Ltd.
- SPP Pumps Ltd.
- Sulzer Ltd.
- Superior Energy Services Inc.
- Trican Well Service Ltd.
- Weatherford International Plc
Qualitative and quantitative analysis of companies has been conducted to help clients understand the wider business environment as well as the strengths and weaknesses of key industry players. Data is qualitatively analyzed to categorize companies as pure play, category-focused, industry-focused, and diversified; it is quantitatively analyzed to categorize companies as dominant, leading, strong, tentative, and weak.
Recent Development and News in Pressure Pumping Market
- In February 2023, Schlumberger Limited, a leading oilfield services company, announced the launch of its new electric frac fleet, E-Frac, marking a significant technological advancement in the market (Schlumberger, 2023). This innovative solution aims to reduce emissions and enhance operational efficiency by up to 30% compared to conventional hydraulic fracturing fleets.
- In May 2024, Halliburton Company and Baker Hughes, two major players in the pressure pumping industry, entered into a strategic collaboration to combine their pressure pumping services businesses (Baker Hughes, 2024). This merger, valued at approximately USD3.5 billion, is expected to create a leading pressure pumping services provider with a combined market share of over 30%.
- In October 2024, National Oilwell Varco, a leading provider of equipment and components used in oil and gas drilling and production operations, secured a major contract from Saudi Aramco to supply pressure pumping equipment for its Marjan and Berri offshore fields (National Oilwell Varco, 2024). This strategic partnership is valued at over USD500 million and underscores National Oilwell Varco's commitment to the Middle East market.
- In March 2025, the United States Environmental Protection Agency (EPA) announced new regulations on methane emissions from oil and gas operations, including requirements for leak detection and repair (EPA, 2025). These regulations are expected to significantly impact the market, as companies will need to invest in technologies and services to comply with the new rules. According to a recent report, the market for methane detection and mitigation technologies is projected to reach USD1.7 billion by 2027 (Market Research Future, 2021).
Research Analyst Overview
- The market is experiencing significant activity and trends in various areas, including pumping rate optimization, multi-stage fracturing, and well performance modeling. Hydraulic fracture modeling plays a crucial role in understanding fracture complexity and optimizing wellbore stability. Fracking fluid rheology and fracture modeling are essential for designing effective fracking stimulation. Reservoir engineering and reservoir simulation are integral to well performance optimization and pressure decline analysis. Environmental remediation and flowback water treatment are becoming increasingly important in sustainable fracking practices. Production optimization software and downhole sensors enable real-time monitoring and analysis of well performance. Wellhead equipment and surface equipment are continually evolving to improve pumping efficiency and reduce costs.
- Fracturing chemistry, fracture conductivity, and hydraulic fracture geometry are key factors in designing high-pressure hose systems for slickwater frac designs. Proppant placement and horizontal well completion are critical aspects of well stimulation design. Fracking regulation and cost analysis are ongoing concerns for the industry, requiring continuous innovation and adaptation. Well performance optimization and production logging provide valuable insights into the effectiveness of fracking stimulation and the overall well productivity. Data analytics and pumping efficiency are essential for identifying opportunities to enhance well performance and reduce operational costs. The market is continually advancing with new technologies and innovations to improve the efficiency, safety, and sustainability of pressure pumping operations.
Dive into Technavio's robust research methodology, blending expert interviews, extensive data synthesis, and validated models for unparalleled Pressure Pumping Market insights. See full methodology.
|
Market Scope |
|
|
Report Coverage |
Details |
|
Page number |
174 |
|
Base year |
2023 |
|
Historic period |
2018-2022 |
|
Forecast period |
2024-2028 |
|
Growth momentum & CAGR |
Accelerate at a CAGR of 3.2% |
|
Market growth 2024-2028 |
USD 5220.6 million |
|
Market structure |
Fragmented |
|
YoY growth 2023-2024(%) |
3.06 |
|
Key countries |
US, Canada, United Arab Emirates, China, and Saudi Arabia |
|
Competitive landscape |
Leading Companies, Market Positioning of Companies, Competitive Strategies, and Industry Risks |
What are the Key Data Covered in this Pressure Pumping Market Research and Growth Report?
- CAGR of the Pressure Pumping industry during the forecast period
- Detailed information on factors that will drive the growth and forecasting between 2024 and 2028
- Precise estimation of the size of the market and its contribution of the industry in focus to the parent market
- Accurate predictions about upcoming growth and trends and changes in consumer behaviour
- Growth of the market across North America, Middle East and Africa, Europe, APAC, and South America
- Thorough analysis of the market's competitive landscape and detailed information about companies
- Comprehensive analysis of factors that will challenge the pressure pumping market growth of industry companies
We can help! Our analysts can customize this pressure pumping market research report to meet your requirements.
 RIA -
RIA - 
