Online Bus Ticketing Service Market Analysis APAC, North America, Europe, South America, Middle East and Africa - US, Canada, India, China, Germany - Size and Forecast 2024-2028

Online Bus Ticketing Service Market Analysis APAC, North America, Europe, South America, Middle East and Africa - US, Canada, India, China, Germany - Size and Forecast 2024-2028

Published: Oct 2023 157 Pages SKU: IRTNTR72590

Market Overview at a Glance

$5.74 B
Market Opportunity
26.97%
CAGR
25.63
YoY growth 2023-2024(%)

Online Bus Ticketing Service Market Size 2024-2028

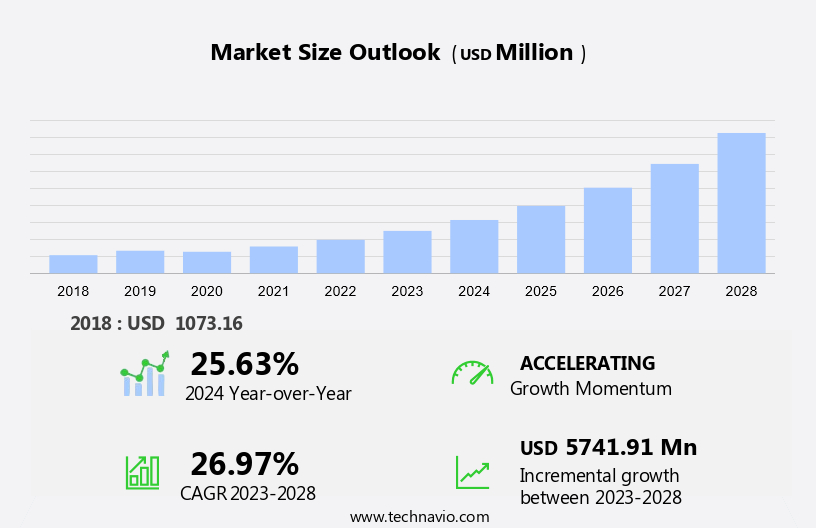
The online bus ticketing service market size is forecast to increase by USD 5.74 billion at a CAGR of 26.97% between 2023 and 2028.

  • The market is witnessing significant growth due to several key factors. The increasing penetration of the internet and smartphones has made it easier for consumers to book bus tickets digitally. Moreover, the adoption of digital payment platforms, such as e-wallets and software-based wallets, has catalyzed the growth of the market. However, the global economic slowdown has presented challenges for market growth. Despite these challenges, the market is expected to continue its upward trajectory, driven by the convenience and time-saving benefits of online bus ticketing services. Consumers can now easily purchase bus tickets using their smartphones and make payments through various digital wallets, making the process more efficient and convenient. This trend is particularly prominent in business travel, where time management is crucial. Overall, the market is poised for steady growth In the coming years.

What will be the Size of the Online Bus Ticketing Service Market During the Forecast Period?

Online Bus Ticketing Service Market Size

 Request Free Sample

  • The market encompasses the provision of booking applications and websites that enable customers to purchase bus tickets digitally. This market is experiencing significant growth due to the increasing adoption of smartphones and secure transaction methods among tech-friendly tourists and working adults. Online transaction applications and websites offer convenience and real-time reporting, allowing users to access travel updates, alerts, and personalized offers. Both private and public bus companies, as well as travel agencies, have integrated reservation technology and software into their operations, creating a centralized network for booking. Local travel agents and online travel agents also participate in this market, with the latter often earning commissions through partnerships.
  • The tourism industry's shift towards digital platforms has fueled the market's expansion, with social media and digital marketing playing essential roles in customer acquisition. Desktop-based applications and smart gadgets further broaden the market's reach, while discount codes and real-time reporting enhance the user experience. Overall, the market is poised for continued growth as the trend towards digital booking solutions continues.

How is this Online Bus Ticketing Service Industry segmented and which is the largest segment?

The online bus ticketing service industry research report provides comprehensive data (region-wise segment analysis), with forecasts and estimates in "USD billion" for the period 2024-2028, as well as historical data from 2018-2022 for the following segments.

  • Application
    • Business travel
    • Tourism travel
  • Type
    • Mobile application
    • Desktop
  • Geography
    • APAC
      • China
      • India
    • North America
      • Canada
      • US
    • Europe
      • Germany
    • South America
    • Middle East and Africa

By Application Insights

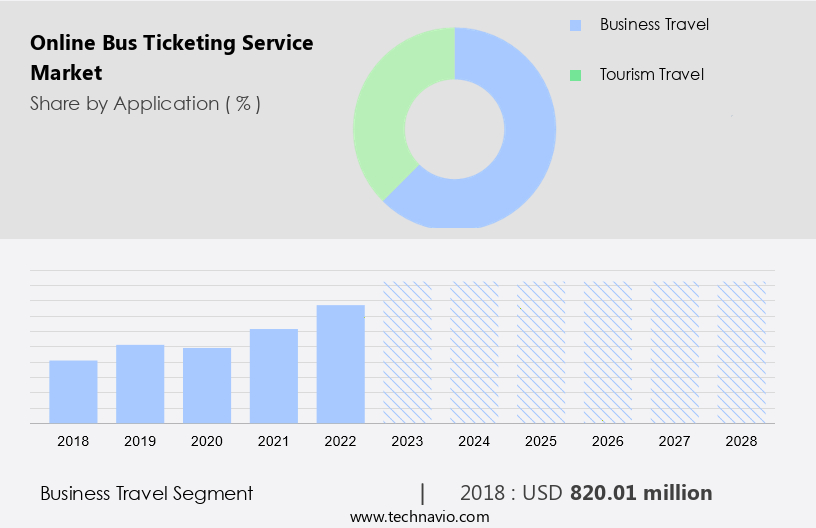
  • The business travel segment is estimated to witness significant growth during the forecast period.

The business travel segment In the market caters to professionals requiring bus transportation for their work-related journeys. Business travelers often have specific requirements, such as accommodating multiple staff, creating itineraries, and preferring business or first-class seats. To address these needs, online bus ticketing service providers focus on offering unique features like Wi-Fi access, power outlets, and business lounges. These services enable seamless travel planning and enhance the overall experience for corporate clients. Additionally, real-time reporting, commissions for travel agents, and integrated payment solutions like e-wallets streamline the booking process. Online applications, social media, and digital marketing channels facilitate easy access to cost-effective routes and personalized offers for tech-friendly business travelers. The market expansion includes city-to-city buses, digitization, and innovative marketing strategies, ensuring a sophisticated travel experience for business clients.

Online Bus Ticketing Service Market Size

Get a glance at the Online Bus Ticketing Service Industry report of share of various segments Request Free Sample

The business travel segment was valued at USD 820.01 billion in 2018 and showed a gradual increase during the forecast period.

Regional Analysis

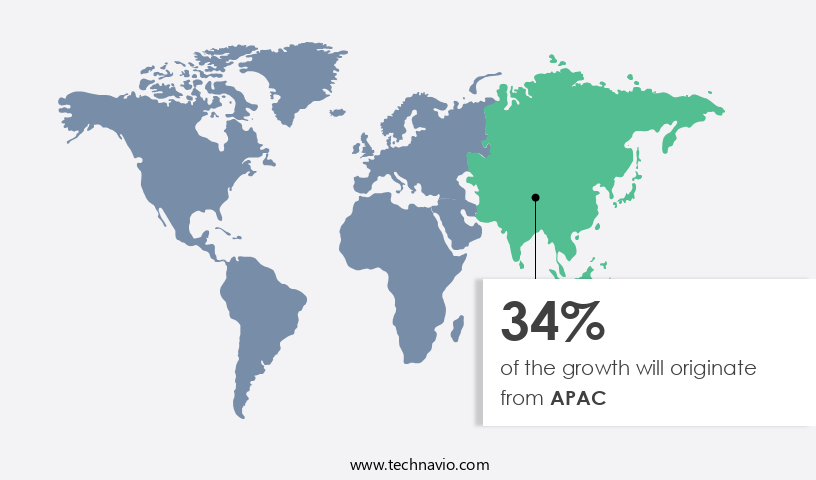
  • APAC is estimated to contribute 34% to the growth of the global market during the forecast period.

Technavio's analysts have elaborately explained the regional trends and drivers that shape the market during the forecast period.

Online Bus Ticketing Service Market Share by Geography

For more insights on the market share of various regions, Request Free Sample

The market in APAC is experiencing significant growth due to the increasing number of business travelers and tourists in countries like China, India, and Japan. The region's strong economy and population growth are key drivers of market expansion. Governments in APAC are focusing on enhancing commuters' travel experience by implementing technologies such as QR codes and Near Field Communication (NFC) in transportation systems. For instance, a partnership was signed to bring mobile ticketing to the Japanese transit market. Online transaction applications, booking websites, and reservation technology are transforming the bus industry, offering bus travelers real-time reporting, seat choice facilities, and personalized services.

Furthermore, smartphone usage is increasing, making online bus ticketing a convenient and cost-effective choice for travelers. Private and public bus companies, travel agencies, and local travel agents are integrating reservation software and e-tickets into their operations to cater to the growing demand for digitization. Customer loyalty programs, advertising, and innovative marketing strategies are also essential components of the market's growth. The market's expansion is further fueled by the integration of payment solutions such as e-wallets and an increase in cross-border travel. The market offers a sophisticated travel experience, providing bus schedules, travel updates, alerts, discounts, and personalized offers to its users.

Market Dynamics

Our researchers analyzed the data with 2023 as the base year, along with the key drivers, trends, and challenges. A holistic analysis of drivers will help companies refine their marketing strategies to gain a competitive advantage.

What are the key market drivers leading to the rise In the adoption of Online Bus Ticketing Service Industry?

Increasing Internet and smartphone penetration is the key driver of the market.

  • The market has experienced substantial growth due to the increasing penetration of the Internet and smartphones. With the widespread availability of free Wi-Fi networks in various countries, including the US, China, India, Japan, and the UK, and the growing sales of smartphones, the number of Internet users, especially among rural and low-income populations, has significantly increased. This digital transformation has led to a rise in online transactions for bus tickets through various channels, such as online booking websites, local travel agents, and private or public bus companies. To cater to this growing demand, travel agencies, tourism industry players, and bus companies have adopted reservation technology and software to offer real-time reporting, seat choice facilities, and personalized services.
  • Customer loyalty programs, advertising, and innovative marketing strategies, including discount codes and personalized offers, have also been integral to the market's growth. The integration of payment solutions, such as e-wallets and sophisticated travel experiences, has further enhanced the convenience and sustainability of bus travel choices. The market dynamics have also led to the emergence of centralized networks, aggregator sites, and city-to-city bus services, offering cost-effective routes and real-time updates, alerts, and travel information. The adoption of IoT, such as bus tracker programs, safety monitoring applications, and itinerary management tools, has added value to the market by providing a more sophisticated travel experience for both online and offline customers, including independent travelers (FITs) and corporate travelers.

What are the market trends shaping the Online Bus Ticketing Service Industry?

Increasing adoption of online payment platforms is the upcoming market trend.

  • The market faces security concerns as a significant challenge, hindering its expansion. However, advancements in security certifications and the growing number of certified ethical hackers are enhancing the security of online transactions. The adoption of online payment methods has risen due to government initiatives promoting digital transactions. Strict regulations, such as Sarbanes-Oxley and PCI-DSS, ensure data security during online transactions, preventing identity and data theft. Online transaction applications and booking websites have become popular among bus travelers, including independent travelers (FITs) and corporate travelers, due to their convenience and cost-effectiveness. Smartphone usage is widespread, enabling real-time reporting, travel updates, alerts, discounts, and personalized offers.
  • Bus ticketing services cater to private and public bus companies, the tourism industry, travel agencies, and local travel agents, providing reservation technology and software. Innovative marketing strategies, such as social media, digital marketing, and discount codes, attract tech-friendly tourists and youth. The market includes aggregator sites, city-to-city buses, and digitization of sustainable travel choices. IoT, integrated payment solutions, e-wallets, and e-tickets are transforming intercity bus transport and cross-border travel. Personalization, seat choice facilities, comfort, and 24/7 availability are essential features of online bus ticketing services. Bus schedules, travel updates, alerts, and discounts offer a sophisticated travel experience for bus travelers.

What challenges does the Online Bus Ticketing Service Industry face during its growth?

The global economic slowdown is a key challenge affecting the industry growth.

  • The market experienced a significant downturn in 2020 due to the COVID-19 pandemic's widespread impact on the transportation, hospitality, and tourism industries. The pandemic's effects led to strict lockdowns in various countries, causing negative growth In these sectors and hindering the adoption of online bus ticket services. The economic slowdown resulting from the pandemic is projected to trigger a recession in major economies such as the US, Canada, the UK, Germany, France, China, Japan, and India during the forecast period. Online transaction applications through online booking websites became essential for private and public bus companies, travel agencies, and local travel agents to offer reservation technology and reservation software for bus tickets.
  • Customer loyalty programs, advertising, and real-time reporting were crucial for business continuity. The shift to digitization, sustainable travel choices, and innovative marketing strategies, including e-tickets, bus tracker programs, aggregator sites, and city-to-city buses, continued to gain traction among tech-friendly tourists and independent travelers (FITs). Integrated payment solutions, e-wallets, and cost-effective routes offered a sophisticated travel experience for business travel segments, including corporate travelers, and the tourism segment. The market's future growth will depend on the successful implementation of itinerary management, safety monitoring applications, and 24/7 availability for multiple bus routes and seat choice facilities. Internet-enabled devices, such as smartphones and tablets, will continue to play a significant role In the market's expansion.

Exclusive Customer Landscape

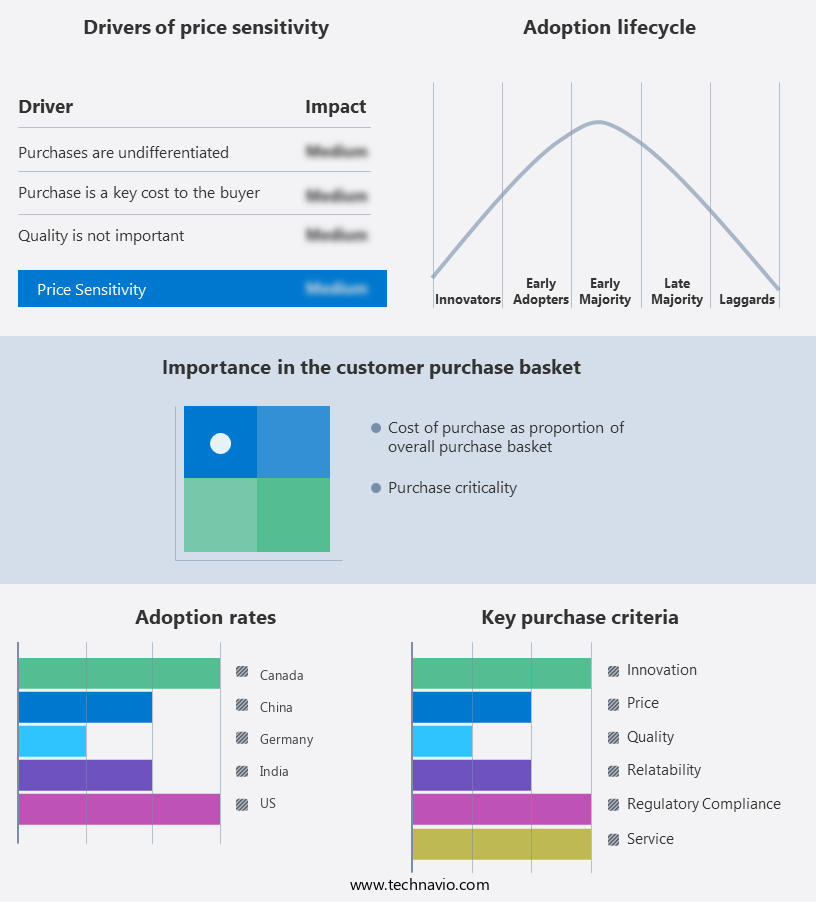
The market forecasting report includes the adoption lifecycle of the market, covering from the innovator's stage to the laggard's stage. It focuses on adoption rates in different regions based on penetration. Furthermore, the market report also includes key purchase criteria and drivers of price sensitivity to help companies evaluate and develop their market growth analysis strategies.

Online Bus Ticketing Service Market Share by Geography

 Customer Landscape

Key Companies & Market Insights

Companies are implementing various strategies, such as strategic alliances, market forecast, partnerships, mergers and acquisitions, geographical expansion, and product/service launches, to enhance their presence In the industry.

The industry research and growth report includes detailed analyses of the competitive landscape of the market and information about key companies, including:

  • BAOLAU Pte Ltd.
  • Busbud Inc.
  • Busonlineticket Pte Ltd.
  • Easy Trip Planners Ltd.
  • FlixMobility GmbH
  • Global Charter Services Inc.
  • GoEuro Corp.
  • GotoBus
  • Gozing Technology Pvt. Ltd.
  • Hip Mobility Inc.
  • KOBO CO. LTD.
  • Le Travenues Technology Ltd.
  • MakeMyTrip Ltd.
  • Mantis Technologies Pvt. Ltd.
  • Stelling Technologies Pvt. Ltd.
  • TicketGoose
  • Vy Bus AS
  • WILLER Inc.
  • Yatra Online Inc.
  • Zeelo Ltd.

Qualitative and quantitative analysis of companies has been conducted to help clients understand the wider business environment as well as the strengths and weaknesses of key industry players. Data is qualitatively analyzed to categorize companies as pure play, category-focused, industry-focused, and diversified; it is quantitatively analyzed to categorize companies as dominant, leading, strong, tentative, and weak.

Research Analyst Overview

The market for bus ticketing services has experienced significant growth in recent years, driven by the increasing popularity of smartphones and secure transaction methods among bus travelers. This trend is particularly prominent In the tourism industry, where travelers seek convenience and flexibility in planning and booking their intercity travel modes. Private and public bus companies, travel agencies, and local travel agents have embraced reservation technology and software to offer real-time reporting, personalized services, and innovative marketing strategies. Centralized networks enable travelers to access bus schedules, travel updates, alerts, discounts, and personalized offers from various bus operators in one place.

Furthermore, the digitization of bus ticketing services has led to the emergence of aggregator sites, allowing travelers to compare cost-effective routes and choose from multiple bus routes with ease. The integration of IoT devices, such as bus tracker programs and tablets, offers a sophisticated travel experience for tech-friendly tourists. The business segment and tourism segment are key markets for online bus ticketing services, with corporate travelers and youth and working adults being significant user groups. Commissions earned by travel agents and bus companies through online bookings provide an additional incentive for the adoption of reservation technology. Despite the numerous benefits, challenges persist In the form of application errors, itinerary management, and safety monitoring applications.

Moreover, the use of integrated payment solutions, such as e-wallets and sophisticated travel experience offerings, is essential to address these challenges and maintain customer loyalty. The growth of online bus ticketing services has led to network expansion, with intercity bus transport and cross-border travel becoming increasingly popular. The use of e-tickets and digital marketing, including social media and subscribers, has enabled bus operators to reach a wider audience and offer personalized services to individual travelers. The online bus ticketing market is expected to continue growing, with bus travelers seeking a seamless, cost-effective, and convenient travel experience. The integration of AI and machine learning technologies, real-time reporting, and personalized offers are likely to further enhance the value proposition of online bus ticketing services.

Market Scope

Report Coverage

Details

Page number

157

Base year

2023

Historic period

2018-2022

Forecast period

2024-2028

Growth momentum & CAGR

Accelerate at a CAGR of 26.97%

Market Growth 2024-2028

USD 5.74 billion

Market structure

Fragmented

YoY growth 2023-2024(%)

25.63

Key countries

US, Canada, India, China, and Germany

Competitive landscape

Leading Companies, Market Positioning of Companies, Competitive Strategies, and Industry Risks

Request Free Sample

What are the Key Data Covered in this Online Bus Ticketing Service Market Research and Growth Report?

  • CAGR of the Online Bus Ticketing Service industry during the forecast period
  • Detailed information on factors that will drive the market growth and forecasting between 2024 and 2028
  • Precise estimation of the size of the market and its contribution of the industry in focus to the parent market
  • Accurate predictions about upcoming growth and trends and changes in consumer behaviour
  • Growth of the market across APAC, North America, Europe, South America, and Middle East and Africa
  • Thorough analysis of the market's competitive landscape and detailed information about companies
  • Comprehensive analysis of factors that will challenge the online bus ticketing service market growth of industry companies

We can help! Our analysts can customize this online bus ticketing service market research report to meet your requirements.

Get in touch

1 Executive Summary

  • 1.1 Market overview
    • Exhibit 01: Executive Summary – Chart on Market Overview
    • Exhibit 02: Executive Summary – Data Table on Market Overview
    • Exhibit 03: Executive Summary – Chart on Global Market Characteristics
    • Exhibit 04: Executive Summary – Chart on Market by Geography
    • Exhibit 05: Executive Summary – Chart on Market Segmentation by Application
    • Exhibit 06: Executive Summary – Chart on Market Segmentation by Type
    • Exhibit 07: Executive Summary – Chart on Incremental Growth
    • Exhibit 08: Executive Summary – Data Table on Incremental Growth
    • Exhibit 09: Executive Summary – Chart on Vendor Market Positioning

2 Market Landscape

  • 2.1 Market ecosystem
    • Exhibit 10: Parent market
    • Exhibit 11: Market Characteristics

3 Market Sizing

  • 3.1 Market definition
    • Exhibit 12: Offerings of vendors included in the market definition
  • 3.2 Market segment analysis
    • Exhibit 13: Market segments
  • 3.3 Market size 2023
    • 3.4 Market outlook: Forecast for 2023-2028
      • Exhibit 14: Chart on Global - Market size and forecast 2023-2028 ($ million)
      • Exhibit 15: Data Table on Global - Market size and forecast 2023-2028 ($ million)
      • Exhibit 16: Chart on Global Market: Year-over-year growth 2023-2028 (%)
      • Exhibit 17: Data Table on Global Market: Year-over-year growth 2023-2028 (%)

    4 Historic Market Size

    • 4.1 Global online bus ticketing service market 2018 - 2022
      • Exhibit 18: Historic Market Size – Data Table on global online bus ticketing service market 2018 - 2022 ($ million)
    • 4.2 Application Segment Analysis 2018 - 2022
      • Exhibit 19: Historic Market Size – Application Segment 2018 - 2022 ($ million)
    • 4.3 Type Segment Analysis 2018 - 2022
      • Exhibit 20: Historic Market Size – Type Segment 2018 - 2022 ($ million)
    • 4.4 Geography Segment Analysis 2018 - 2022
      • Exhibit 21: Historic Market Size – Geography Segment 2018 - 2022 ($ million)
    • 4.5 Country Segment Analysis 2018 - 2022
      • Exhibit 22: Historic Market Size – Country Segment 2018 - 2022 ($ million)

    5 Five Forces Analysis

    • 5.1 Five forces summary
      • Exhibit 23: Five forces analysis - Comparison between 2023 and 2028
    • 5.2 Bargaining power of buyers
      • Exhibit 24: Chart on Bargaining power of buyers – Impact of key factors 2023 and 2028
    • 5.3 Bargaining power of suppliers
      • Exhibit 25: Bargaining power of suppliers – Impact of key factors in 2023 and 2028
    • 5.4 Threat of new entrants
      • Exhibit 26: Threat of new entrants – Impact of key factors in 2023 and 2028
    • 5.5 Threat of substitutes
      • Exhibit 27: Threat of substitutes – Impact of key factors in 2023 and 2028
    • 5.6 Threat of rivalry
      • Exhibit 28: Threat of rivalry – Impact of key factors in 2023 and 2028
    • 5.7 Market condition
      • Exhibit 29: Chart on Market condition - Five forces 2023 and 2028

    6 Market Segmentation by Application

    • 6.1 Market segments
      • Exhibit 30: Chart on Application - Market share 2023-2028 (%)
      • Exhibit 31: Data Table on Application - Market share 2023-2028 (%)
    • 6.2 Comparison by Application
      • Exhibit 32: Chart on Comparison by Application
      • Exhibit 33: Data Table on Comparison by Application
    • 6.3 Business travel - Market size and forecast 2023-2028
      • Exhibit 34: Chart on Business travel - Market size and forecast 2023-2028 ($ million)
      • Exhibit 35: Data Table on Business travel - Market size and forecast 2023-2028 ($ million)
      • Exhibit 36: Chart on Business travel - Year-over-year growth 2023-2028 (%)
      • Exhibit 37: Data Table on Business travel - Year-over-year growth 2023-2028 (%)
    • 6.4 Tourism travel - Market size and forecast 2023-2028
      • Exhibit 38: Chart on Tourism travel - Market size and forecast 2023-2028 ($ million)
      • Exhibit 39: Data Table on Tourism travel - Market size and forecast 2023-2028 ($ million)
      • Exhibit 40: Chart on Tourism travel - Year-over-year growth 2023-2028 (%)
      • Exhibit 41: Data Table on Tourism travel - Year-over-year growth 2023-2028 (%)
    • 6.5 Market opportunity by Application
      • Exhibit 42: Market opportunity by Application ($ million)
      • Exhibit 43: Data Table on Market opportunity by Application ($ million)

    7 Market Segmentation by Type

    • 7.1 Market segments
      • Exhibit 44: Chart on Type - Market share 2023-2028 (%)
      • Exhibit 45: Data Table on Type - Market share 2023-2028 (%)
    • 7.2 Comparison by Type
      • Exhibit 46: Chart on Comparison by Type
      • Exhibit 47: Data Table on Comparison by Type
    • 7.3 Mobile application - Market size and forecast 2023-2028
      • Exhibit 48: Chart on Mobile application - Market size and forecast 2023-2028 ($ million)
      • Exhibit 49: Data Table on Mobile application - Market size and forecast 2023-2028 ($ million)
      • Exhibit 50: Chart on Mobile application - Year-over-year growth 2023-2028 (%)
      • Exhibit 51: Data Table on Mobile application - Year-over-year growth 2023-2028 (%)
    • 7.4 Desktop - Market size and forecast 2023-2028
      • Exhibit 52: Chart on Desktop - Market size and forecast 2023-2028 ($ million)
      • Exhibit 53: Data Table on Desktop - Market size and forecast 2023-2028 ($ million)
      • Exhibit 54: Chart on Desktop - Year-over-year growth 2023-2028 (%)
      • Exhibit 55: Data Table on Desktop - Year-over-year growth 2023-2028 (%)
    • 7.5 Market opportunity by Type
      • Exhibit 56: Market opportunity by Type ($ million)
      • Exhibit 57: Data Table on Market opportunity by Type ($ million)

    8 Customer Landscape

    • 8.1 Customer landscape overview
      • Exhibit 58: Analysis of price sensitivity, lifecycle, customer purchase basket, adoption rates, and purchase criteria

    9 Geographic Landscape

    • 9.1 Geographic segmentation
      • Exhibit 59: Chart on Market share by geography 2023-2028 (%)
      • Exhibit 60: Data Table on Market share by geography 2023-2028 (%)
    • 9.2 Geographic comparison
      • Exhibit 61: Chart on Geographic comparison
      • Exhibit 62: Data Table on Geographic comparison
    • 9.3 APAC - Market size and forecast 2023-2028
      • Exhibit 63: Chart on APAC - Market size and forecast 2023-2028 ($ million)
      • Exhibit 64: Data Table on APAC - Market size and forecast 2023-2028 ($ million)
      • Exhibit 65: Chart on APAC - Year-over-year growth 2023-2028 (%)
      • Exhibit 66: Data Table on APAC - Year-over-year growth 2023-2028 (%)
    • 9.4 North America - Market size and forecast 2023-2028
      • Exhibit 67: Chart on North America - Market size and forecast 2023-2028 ($ million)
      • Exhibit 68: Data Table on North America - Market size and forecast 2023-2028 ($ million)
      • Exhibit 69: Chart on North America - Year-over-year growth 2023-2028 (%)
      • Exhibit 70: Data Table on North America - Year-over-year growth 2023-2028 (%)
    • 9.5 Europe - Market size and forecast 2023-2028
      • Exhibit 71: Chart on Europe - Market size and forecast 2023-2028 ($ million)
      • Exhibit 72: Data Table on Europe - Market size and forecast 2023-2028 ($ million)
      • Exhibit 73: Chart on Europe - Year-over-year growth 2023-2028 (%)
      • Exhibit 74: Data Table on Europe - Year-over-year growth 2023-2028 (%)
    • 9.6 South America - Market size and forecast 2023-2028
      • Exhibit 75: Chart on South America - Market size and forecast 2023-2028 ($ million)
      • Exhibit 76: Data Table on South America - Market size and forecast 2023-2028 ($ million)
      • Exhibit 77: Chart on South America - Year-over-year growth 2023-2028 (%)
      • Exhibit 78: Data Table on South America - Year-over-year growth 2023-2028 (%)
    • 9.7 Middle East and Africa - Market size and forecast 2023-2028
      • Exhibit 79: Chart on Middle East and Africa - Market size and forecast 2023-2028 ($ million)
      • Exhibit 80: Data Table on Middle East and Africa - Market size and forecast 2023-2028 ($ million)
      • Exhibit 81: Chart on Middle East and Africa - Year-over-year growth 2023-2028 (%)
      • Exhibit 82: Data Table on Middle East and Africa - Year-over-year growth 2023-2028 (%)
    • 9.8 India - Market size and forecast 2023-2028
      • Exhibit 83: Chart on India - Market size and forecast 2023-2028 ($ million)
      • Exhibit 84: Data Table on India - Market size and forecast 2023-2028 ($ million)
      • Exhibit 85: Chart on India - Year-over-year growth 2023-2028 (%)
      • Exhibit 86: Data Table on India - Year-over-year growth 2023-2028 (%)
    • 9.9 US - Market size and forecast 2023-2028
      • Exhibit 87: Chart on US - Market size and forecast 2023-2028 ($ million)
      • Exhibit 88: Data Table on US - Market size and forecast 2023-2028 ($ million)
      • Exhibit 89: Chart on US - Year-over-year growth 2023-2028 (%)
      • Exhibit 90: Data Table on US - Year-over-year growth 2023-2028 (%)
    • 9.10 China - Market size and forecast 2023-2028
      • Exhibit 91: Chart on China - Market size and forecast 2023-2028 ($ million)
      • Exhibit 92: Data Table on China - Market size and forecast 2023-2028 ($ million)
      • Exhibit 93: Chart on China - Year-over-year growth 2023-2028 (%)
      • Exhibit 94: Data Table on China - Year-over-year growth 2023-2028 (%)
    • 9.11 Germany - Market size and forecast 2023-2028
      • Exhibit 95: Chart on Germany - Market size and forecast 2023-2028 ($ million)
      • Exhibit 96: Data Table on Germany - Market size and forecast 2023-2028 ($ million)
      • Exhibit 97: Chart on Germany - Year-over-year growth 2023-2028 (%)
      • Exhibit 98: Data Table on Germany - Year-over-year growth 2023-2028 (%)
    • 9.12 Canada - Market size and forecast 2023-2028
      • Exhibit 99: Chart on Canada - Market size and forecast 2023-2028 ($ million)
      • Exhibit 100: Data Table on Canada - Market size and forecast 2023-2028 ($ million)
      • Exhibit 101: Chart on Canada - Year-over-year growth 2023-2028 (%)
      • Exhibit 102: Data Table on Canada - Year-over-year growth 2023-2028 (%)
    • 9.13 Market opportunity by geography
      • Exhibit 103: Market opportunity by geography ($ million)
      • Exhibit 104: Data Tables on Market opportunity by geography ($ million)

    10 Drivers, Challenges, and Trends

    • 10.1 Market drivers
      • 10.2 Market challenges
        • 10.3 Impact of drivers and challenges
          • Exhibit 105: Impact of drivers and challenges in 2023 and 2028
        • 10.4 Market trends

          11 Vendor Landscape

          • 11.1 Overview
            • 11.2 Vendor landscape
              • Exhibit 106: Overview on Criticality of inputs and Factors of differentiation
            • 11.3 Landscape disruption
              • Exhibit 107: Overview on factors of disruption
            • 11.4 Industry risks
              • Exhibit 108: Impact of key risks on business

            12 Vendor Analysis

            • 12.1 Vendors covered
              • Exhibit 109: Vendors covered
            • 12.2 Market positioning of vendors
              • Exhibit 110: Matrix on vendor position and classification
            • 12.3 BAOLAU Pte Ltd.
              • Exhibit 111: BAOLAU Pte Ltd. - Overview
              • Exhibit 112: BAOLAU Pte Ltd. - Product / Service
              • Exhibit 113: BAOLAU Pte Ltd. - Key offerings
            • 12.4 Busonlineticket Pte Ltd.
              • Exhibit 114: Busonlineticket Pte Ltd. - Overview
              • Exhibit 115: Busonlineticket Pte Ltd. - Product / Service
              • Exhibit 116: Busonlineticket Pte Ltd. - Key offerings
            • 12.5 Easy Trip Planners Ltd.
              • Exhibit 117: Easy Trip Planners Ltd. - Overview
              • Exhibit 118: Easy Trip Planners Ltd. - Business segments
              • Exhibit 119: Easy Trip Planners Ltd. - Key offerings
              • Exhibit 120: Easy Trip Planners Ltd. - Segment focus
            • 12.6 FlixMobility GmbH
              • Exhibit 121: FlixMobility GmbH - Overview
              • Exhibit 122: FlixMobility GmbH - Product / Service
              • Exhibit 123: FlixMobility GmbH - Key offerings
            • 12.7 GoEuro Corp.
              • Exhibit 124: GoEuro Corp. - Overview
              • Exhibit 125: GoEuro Corp. - Product / Service
              • Exhibit 126: GoEuro Corp. - Key offerings
            • 12.8 GotoBus
              • Exhibit 127: GotoBus - Overview
              • Exhibit 128: GotoBus - Product / Service
              • Exhibit 129: GotoBus - Key offerings
            • 12.9 Gozing Technology Pvt. Ltd.
              • Exhibit 130: Gozing Technology Pvt. Ltd. - Overview
              • Exhibit 131: Gozing Technology Pvt. Ltd. - Product / Service
              • Exhibit 132: Gozing Technology Pvt. Ltd. - Key offerings
            • 12.10 KOBO CO. LTD.
              • Exhibit 133: KOBO CO. LTD. - Overview
              • Exhibit 134: KOBO CO. LTD. - Product / Service
              • Exhibit 135: KOBO CO. LTD. - Key offerings
            • 12.11 Le Travenues Technology Ltd.
              • Exhibit 136: Le Travenues Technology Ltd. - Overview
              • Exhibit 137: Le Travenues Technology Ltd. - Product / Service
              • Exhibit 138: Le Travenues Technology Ltd. - Key offerings
            • 12.12 MakeMyTrip Ltd.
              • Exhibit 139: MakeMyTrip Ltd. - Overview
              • Exhibit 140: MakeMyTrip Ltd. - Business segments
              • Exhibit 141: MakeMyTrip Ltd. - Key offerings
              • Exhibit 142: MakeMyTrip Ltd. - Segment focus
            • 12.13 Stelling Technologies Pvt. Ltd.
              • Exhibit 143: Stelling Technologies Pvt. Ltd. - Overview
              • Exhibit 144: Stelling Technologies Pvt. Ltd. - Product / Service
              • Exhibit 145: Stelling Technologies Pvt. Ltd. - Key offerings
            • 12.14 TicketGoose
              • Exhibit 146: TicketGoose - Overview
              • Exhibit 147: TicketGoose - Product / Service
              • Exhibit 148: TicketGoose - Key offerings
            • 12.15 Vy Bus AS
              • Exhibit 149: Vy Bus AS - Overview
              • Exhibit 150: Vy Bus AS - Product / Service
              • Exhibit 151: Vy Bus AS - Key offerings
            • 12.16 WILLER Inc.
              • Exhibit 152: WILLER Inc. - Overview
              • Exhibit 153: WILLER Inc. - Product / Service
              • Exhibit 154: WILLER Inc. - Key offerings
            • 12.17 Yatra Online Inc.
              • Exhibit 155: Yatra Online Inc. - Overview
              • Exhibit 156: Yatra Online Inc. - Business segments
              • Exhibit 157: Yatra Online Inc. - Key offerings
              • Exhibit 158: Yatra Online Inc. - Segment focus

            13 Appendix

            • 13.1 Scope of the report
              • 13.2 Inclusions and exclusions checklist
                • Exhibit 159: Inclusions checklist
                • Exhibit 160: Exclusions checklist
              • 13.3 Currency conversion rates for US$
                • Exhibit 161: Currency conversion rates for US$
              • 13.4 Research methodology
                • Exhibit 162: Research methodology
                • Exhibit 163: Validation techniques employed for market sizing
                • Exhibit 164: Information sources
              • 13.5 List of abbreviations
                • Exhibit 165: List of abbreviations

              Research Methodology

              Technavio presents a detailed picture of the market by way of study, synthesis, and summation of data from multiple sources. The analysts have presented the various facets of the market with a particular focus on identifying the key industry influencers. The data thus presented is comprehensive, reliable, and the result of extensive research, both primary and secondary.

              INFORMATION SOURCES

              Primary sources

              • Manufacturers and suppliers
              • Channel partners
              • Industry experts
              • Strategic decision makers

              Secondary sources

              • Industry journals and periodicals
              • Government data
              • Financial reports of key industry players
              • Historical data
              • Press releases

              DATA ANALYSIS

              Data Synthesis

              • Collation of data
              • Estimation of key figures
              • Analysis of derived insights

              Data Validation

              • Triangulation with data models
              • Reference against proprietary databases
              • Corroboration with industry experts

              REPORT WRITING

              Qualitative

              • Market drivers
              • Market challenges
              • Market trends
              • Five forces analysis

              Quantitative

              • Market size and forecast
              • Market segmentation
              • Geographical insights
              • Competitive landscape

              Interested in this report?

              Get your sample now to see our research methodology and insights!

              Download Now

              Frequently Asked Questions

              Online Bus Ticketing Service market growth will increase by 5741.91 million during 2024-2028.

              The Online Bus Ticketing Service market is expected to grow at a CAGR of 26.97% during 2024-2028.

              Online Bus Ticketing Service market is segmented by Application( Business travel, Tourism travel) Type( Mobile application, Desktop)

              BAOLAU Pte Ltd., Busbud Inc., Busonlineticket Pte Ltd., Easy Trip Planners Ltd., FlixMobility GmbH, Global Charter Services Inc., GoEuro Corp., GotoBus, Gozing Technology Pvt. Ltd., Hip Mobility Inc., KOBO CO. LTD., Le Travenues Technology Ltd., MakeMyTrip Ltd., Mantis Technologies Pvt. Ltd., Stelling Technologies Pvt. Ltd., TicketGoose, Vy Bus AS, WILLER Inc., Yatra Online Inc., Zeelo Ltd. are a few of the key vendors in the Online Bus Ticketing Service market.

              APAC will register the highest growth rate of 34.06% among the other regions. Therefore, the Online Bus Ticketing Service market in APAC is expected to garner significant business opportunities for the vendors during the forecast period.

              US, Canada, India, China, Germany

              • Increasing Internet and smartphone penetrationThe rapid technological advances increased the Internet and smartphone penetration globally in the past decade is the driving factor this market.
              • which had a vital role in the global online bus ticket service market. Internet connectivity has become necessary in homes is the driving factor this market.
              • offices is the driving factor this market.
              • and public places. The governments of various countries is the driving factor this market.
              • such as China is the driving factor this market.
              • India is the driving factor this market.
              • Japan is the driving factor this market.
              • the US is the driving factor this market.
              • and the UK is the driving factor this market.
              • provide free Wi-Fi networks for their citizens. With the evolution of smartphones and free Wi-Fi services is the driving factor this market.
              • the use of the Internet through mobile phones has been increasing significantly over the past decade. With the growth in the sales of smartphones is the driving factor this market.
              • there is a massive increase in the number of Internet users is the driving factor this market.
              • as rural people and low-income people are using smartphones as a medium to connect to the Internet. For instance is the driving factor this market.
              • countries such as India and China are witnessing significant growth in Internet penetration due to the rising number of smartphone users and low-cost is the driving factor this market.
              • high-speed Internet services. In India is the driving factor this market.
              • Internet penetration was 50% in 2020 is the driving factor this market.
              • and around half of the 1.37 billion Indians had access to the Internet in 2020.  Telecom providers and smartphone companies are focusing on underdeveloped or developing countries to increase their market share is the driving factor this market.
              • which will increase smartphone sales during the forecast period. For instance is the driving factor this market.
              • the smartphone shipment in India in 2021 was around 160-168 million is the driving factor this market.
              • as compared to 2020. Owing to growing support from local governments is the driving factor this market.
              • mobile and Internet connectivity across lower-middle-income countries worldwide is increasing. In 2020 is the driving factor this market.
              • the number of people living outside of mobile broadband coverage areas worldwide reduced to 450 million due to the growing development of networking infrastructure. With the potential growth in the mobile phone and Internet sectors is the driving factor this market.
              • online travel companies such as Expedia Group and MakeMyTrip are launching innovative and user-friendly mobile applications is the driving factor this market.
              • increasing the demand for the global online bus ticket service market. Ease of selecting and using mobile applications and more customer base are driving the demand for smartphone-based online bus ticket services. Many key players in the global online bus ticket service market are trying to provide their mobile applications pre-loaded in the phones during sales is the driving factor this market.
              • which is increasing the reach of their mobile applications. Also is the driving factor this market.
              • travel companies are partnering with mobile phone companies to manufacture special edition apps and offers for certain models or brands. Such factors will drive the market's growth in focus during the forecast period. is the driving factor this market.

              The Online Bus Ticketing Service market vendors should focus on grabbing business opportunities from the Business travel segment as it accounted for the largest market share in the base year.
              RIA - Research AI Assistant
              Ask RIA