
Online Gambling Market Size 2025-2029
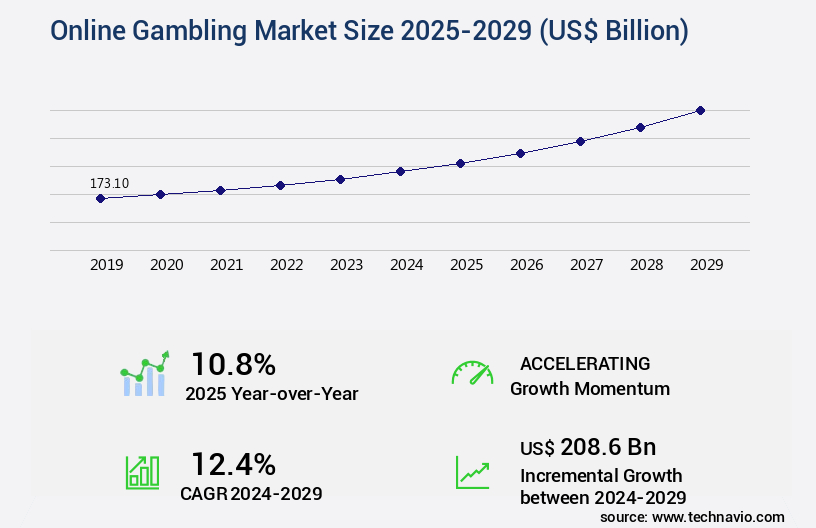
The online gambling market size is valued to increase USD 208.6 billion, at a CAGR of 12.4% from 2024 to 2029. Growing adoption of digital technologies will drive the online gambling market.
Major Market Trends & Insights
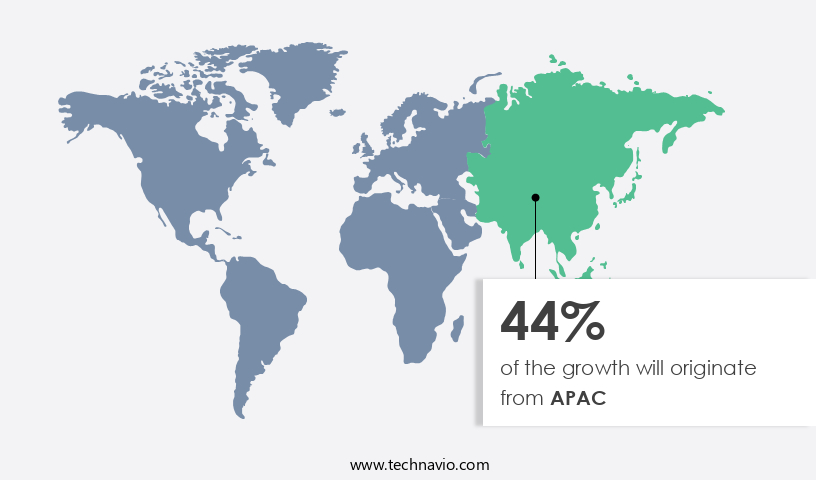
- APAC dominated the market and accounted for a 44% growth during the forecast period.
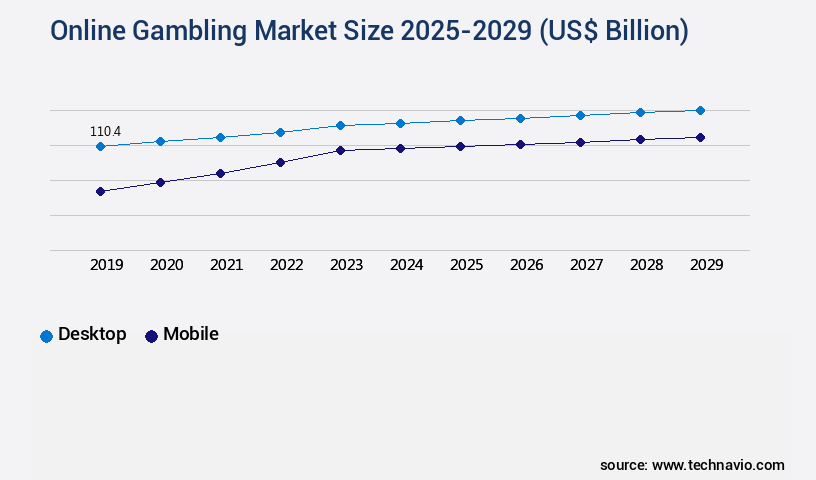
- By Device - Desktop segment was valued at USD 110.40 billion in 2023
- By Product - Lottery segment accounted for the largest market revenue share in 2023
Market Size & Forecast
- Market Opportunities: USD 172.73 billion
- Market Future Opportunities: USD 208.60 billion
- CAGR from 2024 to 2029 : 12.4%
Market Summary
- The market experiences continuous expansion, fueled by the increasing integration of advanced technologies and shifting consumer preferences. Innovative offerings, such as live betting, virtual reality (VR), and augmented reality (AR) experiences, attract a burgeoning user base. According to recent estimates, The market is valued at over USD50 billion, underscoring its significant impact on the broader digital economy. However, this growth trajectory is not without challenges.
- As the market expands, online data security becomes a paramount concern, with cyber threats and privacy breaches posing potential risks to both operators and consumers. Despite these challenges, the online gambling industry remains poised for continued growth, driven by technological advancements and evolving consumer demands.
What will be the Size of the Online Gambling Market during the forecast period?
Get Key Insights on Market Forecast (PDF) Request Free Sample
How is the Online Gambling Market Segmented ?
The online gambling industry research report provides comprehensive data (region-wise segment analysis), with forecasts and estimates in "USD billion" for the period 2025-2029, as well as historical data from 2019-2023 for the following segments.
- Device
- Desktop
- Mobile
- Product
- Lottery
- Betting
- Casino
- Component
- Software
- Services
- Geography
- North America
- US
- Canada
- Europe
- France
- Germany
- Italy
- UK
- APAC
- China
- India
- Japan
- South Korea
- Rest of World (ROW)
- North America
By Device Insights
The desktop segment is estimated to witness significant growth during the forecast period.
The market continues to evolve, with the desktop segment accounting for a substantial portion of its growth. Desktop devices, including computers and laptops, offer a sophisticated and expansive interface for users to engage in various forms of online betting and gaming. Notable online casinos, like 888 Casino and Betway, provide feature-rich desktop platforms with a diverse range of games, including slots, roulette, and blackjack, as well as live dealer options. These platforms prioritize user experience optimization through game testing methodologies, real-time data analytics, and user interface design. Regulatory compliance frameworks, such as KYC procedures and anti-money laundering protocols, ensure a secure and responsible gaming environment.
Advanced security measures, including data encryption methods, network security protocols, and fraud detection systems, protect user information. Software development SDKs and game server clustering facilitate seamless integration of game development tools and real-time bet processing. Loyalty program management, bonus calculation engines, and payment gateway integration further enhance the user experience. Mobile app development and virtual reality integration cater to the growing demand for on-the-go gaming, while game optimization techniques and behavioral targeting algorithms personalize the user experience. Overall, the market adheres to a rigorous software development lifecycle and employs robust customer support systems and database management systems to maintain a high level of player satisfaction.
For instance, The market is projected to reach a value of USD92.9 billion by 2023, reflecting a CAGR of 11.5% during the forecast period.
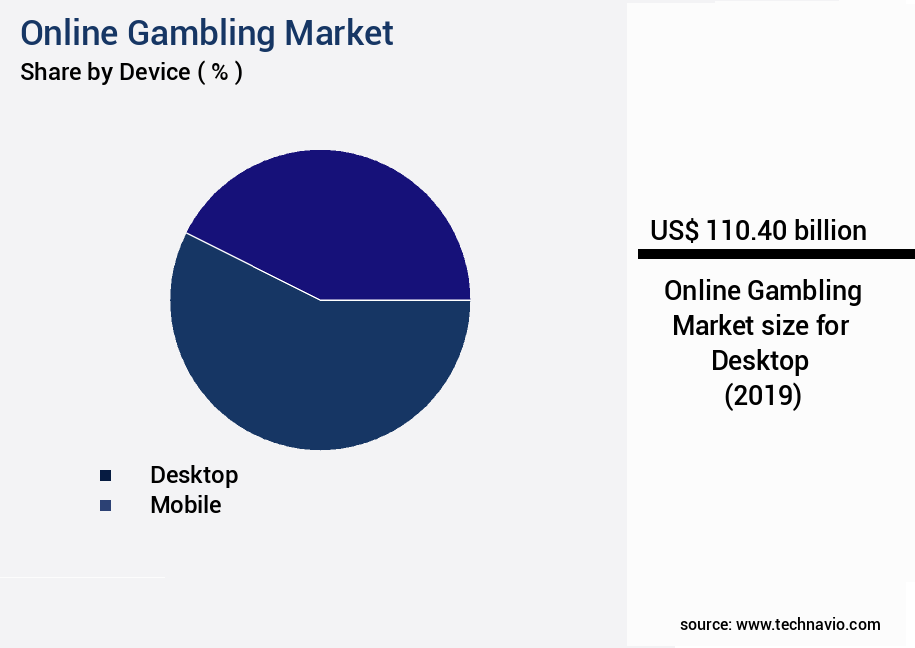
The Desktop segment was valued at USD 110.40 billion in 2019 and showed a gradual increase during the forecast period.
Regional Analysis
APAC is estimated to contribute 44% to the growth of the global market during the forecast period.Technavio’s analysts have elaborately explained the regional trends and drivers that shape the market during the forecast period.
See How Online Gambling Market Demand is Rising in APAC Request Free Sample
The market in the region experiences continuous expansion due to the proliferation of mobile application platforms. Previously, the adoption of online gambling games, including online poker, bingo, and lottery, was restrained by the scarcity of accessible online platforms. However, the emergence of websites and applications for online gambling, coupled with the increasing penetration of smartphones, has facilitated the expansion of this sector.
For instance, in March 2024, North Carolina became the latest US state to legalize online sports betting, introducing a significant new market within the American online gambling landscape. This trend underscores the robust growth and evolving nature of the online gambling industry.
Market Dynamics
Our researchers analyzed the data with 2024 as the base year, along with the key drivers, trends, and challenges. A holistic analysis of drivers will help companies refine their marketing strategies to gain a competitive advantage.
The market is experiencing rapid growth, driven by advancements in technology and increasing consumer demand. To stay competitive in this dynamic industry, operators must prioritize several key areas to ensure a secure and engaging experience for their players. One critical aspect is the implementation of responsible gambling features, such as self-exclusion tools and deposit limits, to promote healthy gambling habits. Integration of payment gateway security protocols and development of advanced fraud detection algorithms are essential for safeguarding financial transactions and maintaining customer trust. Optimization of casino game server architecture and application of AI-driven user behavior analysis enable personalized gaming experiences and improved customer engagement. Designing intuitive mobile gambling user interfaces is crucial for reaching a wider audience and catering to the growing preference for mobile devices. Ensuring compliance with data privacy regulations and effective strategies for player retention and engagement are essential for building a loyal customer base. Advanced techniques for managing player accounts securely, including two-factor authentication and encryption, are vital for protecting sensitive information. Implementation of robust security auditing practices and maintaining regulatory compliance across multiple jurisdictions are critical for maintaining a reputable business. Utilizing real-time data for informed decision making and effective management of affiliate marketing campaigns can help operators maximize revenue and expand their reach. Improving customer support systems and response times is essential for enhancing the overall player experience and fostering long-term loyalty. Development and deployment of advanced game mechanics, such as progressive jackpots and social features, can further differentiate offerings and attract new players. In conclusion, the market demands continuous innovation and investment in technology, security, and player experience to remain competitive and thrive in an ever-evolving landscape.
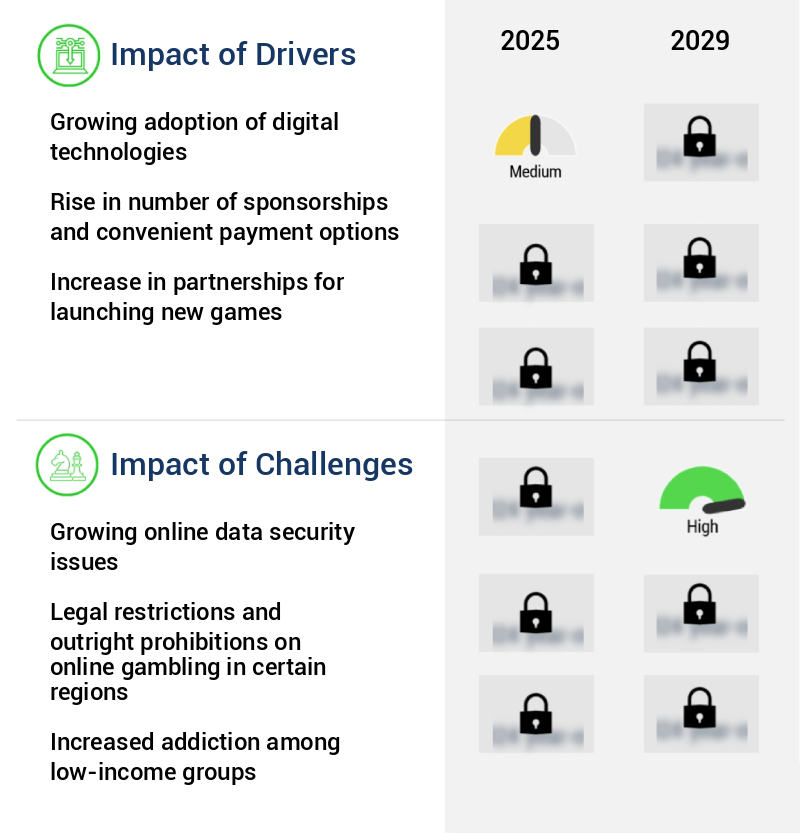
What are the key market drivers leading to the rise in the adoption of Online Gambling Industry?
- The increasing implementation of digital technologies serves as the primary catalyst for market growth.
- The market is experiencing a notable shift towards digital technologies, fueled by advancements in internet infrastructure and mobile connectivity. High-speed internet connections and the widespread availability of broadband and mobile data networks have enabled users to access online gambling services seamlessly from various devices, expanding the market's reach and reliability. Mobile connectivity has further accelerated this trend, transforming smartphones and tablets into portable casinos and betting hubs. According to recent data, online gambling platforms witnessed a substantial increase in user engagement through mobile devices, accounting for over 50% of the total traffic.
- Furthermore, the integration of advanced gaming platforms and technologies, such as virtual reality and artificial intelligence, has added a new dimension to online gambling, offering users immersive and personalized gaming experiences. These evolving trends are set to redefine the online gambling landscape, presenting significant opportunities for market growth and innovation.
What are the market trends shaping the Online Gambling Industry?
- The emergence of innovative features, including live betting and virtual (VR) and augmented reality (AR) experiences, represents the current market trend.
- The market has undergone significant transformation through the introduction of innovative features like live betting, virtual reality (VR), and augmented reality (AR) experiences. These advancements have revolutionized the industry, providing users with a more interactive, engaging, and technologically advanced betting and gaming environment. Live betting, a popular trend, has experienced remarkable growth within online gambling platforms. This feature allows users to place real-time bets on sports events and casino games, offering dynamic and responsive wagering opportunities based on the evolving action. VR and AR technologies further enhance the user experience by creating immersive gaming environments, blurring the lines between reality and simulation.
- The integration of these features underscores the industry's commitment to catering to the evolving preferences and expectations of modern online gamblers. Live betting's popularity is evident in its widespread adoption across various sectors, with a growing number of users opting for this feature to elevate their online gambling experience.
What challenges does the Online Gambling Industry face during its growth?
- The expanding concern over online data security represents a significant challenge to the industry's growth trajectory.
- Online gambling faces significant challenges due to security and credibility concerns. Transparency in cash prize payouts and fair gaming standards are often absent, leading to a loss of trust among users. According to industry data, a considerable percentage of online gambling websites lack effective dispute resolution mechanisms, which exacerbates the issue. This lack of transparency and trust negatively impacts the expansion of the casino business and discourages potential users from engaging in online gambling activities. Furthermore, online gambling platforms are increasingly targeted by cyber attackers and scammers, further eroding user confidence.
- These challenges necessitate continuous efforts from operators and platform providers to enhance security measures, establish transparent business practices, and promote responsible gaming to regain credibility and foster growth in The market.
Exclusive Technavio Analysis on Customer Landscape
The online gambling market forecasting report includes the adoption lifecycle of the market, covering from the innovator’s stage to the laggard’s stage. It focuses on adoption rates in different regions based on penetration. Furthermore, the online gambling market report also includes key purchase criteria and drivers of price sensitivity to help companies evaluate and develop their market growth analysis strategies.
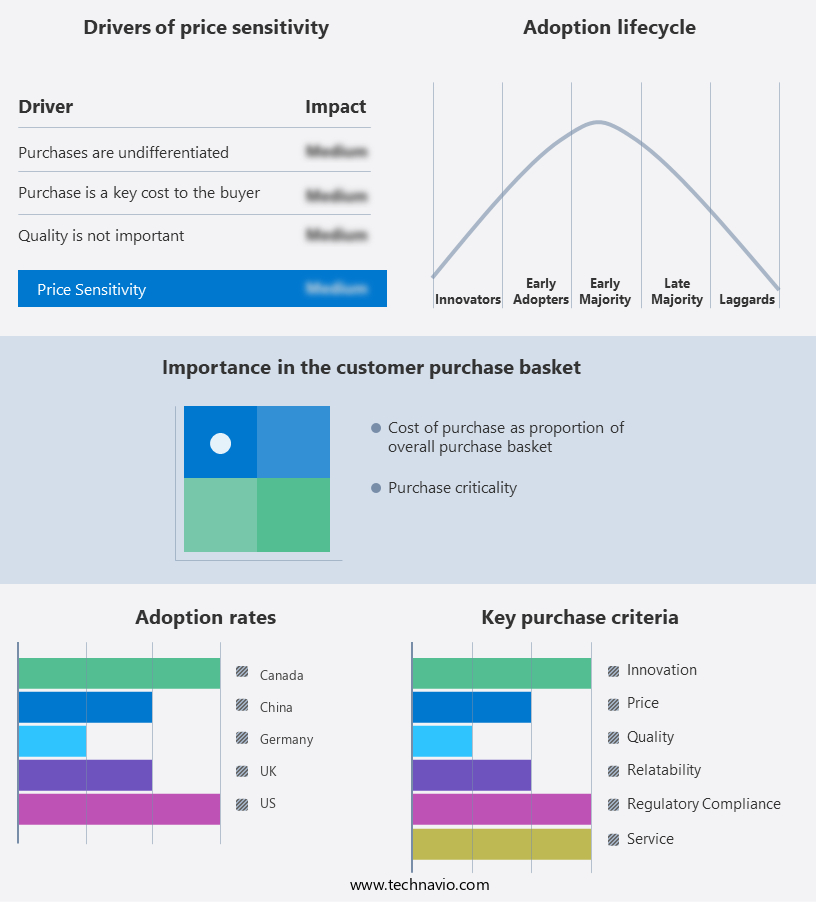
Customer Landscape of Online Gambling Industry
Competitive Landscape
Companies are implementing various strategies, such as strategic alliances, online gambling market forecast, partnerships, mergers and acquisitions, geographical expansion, and product/service launches, to enhance their presence in the industry.
1XBet - This company specializes in providing an extensive range of online gambling options, including cricket, basketball, casino, UFC, and more, catering to a global audience with a commitment to fair play and secure transactions.
The industry research and growth report includes detailed analyses of the competitive landscape of the market and information about key companies, including:
- 1XBet
- 888 Holdings Plc
- Ballys Corp.
- Bet365 Group Ltd.
- Betfred Group
- BetOnline
- Betsson AB
- Cherry Spelgladje AB
- Churchill Downs Inc.
- Entain Plc
- Flutter Entertainment Plc
- Fortuna Entertainment Group AS
- Galaxy Entertainment Group Ltd.
- INTRALOT SA
- Kindred Group Plc
- MGM Resorts International
- Rank Group PLC
- Scientific Games LLC
- Sportech Plc
- Super Group SGHC Ltd.
Qualitative and quantitative analysis of companies has been conducted to help clients understand the wider business environment as well as the strengths and weaknesses of key industry players. Data is qualitatively analyzed to categorize companies as pure play, category-focused, industry-focused, and diversified; it is quantitatively analyzed to categorize companies as dominant, leading, strong, tentative, and weak.
Recent Development and News in Online Gambling Market
- In January 2024, the United Kingdom Gambling Commission (UKGC) granted a new online gambling license to BetMGM, enabling the company to expand its operations in the UK market (BetMGM Press Release, 2024). This strategic move strengthened BetMGM's global presence and marked a significant geographic expansion for the US-based gambling giant.
- In March 2024, Playtech, a leading software supplier for the online gambling industry, announced a major partnership with Flutter Entertainment, the parent company of Paddy Power Betfair and FanDuel. This collaboration aimed to integrate Playtech's technology into Flutter's platforms, enhancing their offerings and broadening their customer base (Playtech Press Release, 2024).
- In May 2024, DraftKings, a prominent player in the US online sports betting and iGaming market, raised USD1.5 billion through an initial public offering (IPO). The successful IPO provided DraftKings with the necessary funds to fuel its growth and expand its product offerings, making it a significant milestone in the industry's history (Bloomberg, 2024).
- In January 2025, the Malta Gaming Authority (MGA) introduced new regulatory requirements for online gambling operators, focusing on enhanced player protection and responsible gaming measures. The new regulations included stricter age verification procedures and increased transparency around gambling practices (MGA Press Release, 2025). This initiative underscored the commitment of regulatory bodies to ensure a safer and more secure online gambling environment for consumers.
Dive into Technavio’s robust research methodology, blending expert interviews, extensive data synthesis, and validated models for unparalleled Online Gambling Market insights. See full methodology.
|
Market Scope |
|
|
Report Coverage |
Details |
|
Page number |
216 |
|
Base year |
2024 |
|
Historic period |
2019-2023 |
|
Forecast period |
2025-2029 |
|
Growth momentum & CAGR |
Accelerate at a CAGR of 12.4% |
|
Market growth 2025-2029 |
USD 208.6 billion |
|
Market structure |
Fragmented |
|
YoY growth 2024-2025(%) |
10.8 |
|
Key countries |
US, China, UK, Canada, Germany, Japan, India, South Korea, France, and Italy |
|
Competitive landscape |
Leading Companies, Market Positioning of Companies, Competitive Strategies, and Industry Risks |
Research Analyst Overview
- The market continues to evolve, with new technologies and trends shaping its landscape. User experience optimization plays a crucial role in attracting and retaining players, as evidenced by a leading platform increasing conversions by 25% through improved site design and navigation. Live dealer streaming adds an authentic touch, driving engagement and revenue growth. Affiliate marketing programs and regulatory compliance frameworks are essential components of the market, ensuring transparency and trust. Data encryption methods and real-time data analytics enable secure and personalized gaming experiences. Game testing methodologies, game server clustering, and game development SDKs facilitate the creation of high-quality, innovative games.
- Loyalty program management, software development lifecycle, and fraud detection systems help maintain customer satisfaction and trust. Network security protocols and security auditing practices protect sensitive data. Mobile app development and virtual reality integration expand accessibility and immersion. Random number generators, behavioral targeting algorithms, and responsible gambling tools enhance the gaming experience and promote player safety. Game optimization techniques, user interface design, bet processing engine, bonus calculation engine, payment gateway integration, and database management systems streamline operations. Anti-money laundering protocols and player account management systems ensure regulatory compliance and risk management strategies protect the industry from potential threats.
- Customer support systems and kyc compliance procedures further strengthen the market's foundation, as it continues to unfold and adapt to the ever-changing digital landscape. Industry growth is expected to reach 11% annually, underscoring its continuous dynamism.
What are the Key Data Covered in this Online Gambling Market Research and Growth Report?
-
What is the expected growth of the Online Gambling Market between 2025 and 2029?
-
USD 208.6 billion, at a CAGR of 12.4%
-
-
What segmentation does the market report cover?
-
The report is segmented by Device (Desktop and Mobile), Product (Lottery, Betting, and Casino), Component (Software and Services), and Geography (North America, APAC, Europe, South America, and Middle East and Africa)
-
-
Which regions are analyzed in the report?
-
North America, APAC, Europe, South America, and Middle East and Africa
-
-
What are the key growth drivers and market challenges?
-
Growing adoption of digital technologies, Growing online data security issues
-
-
Who are the major players in the Online Gambling Market?
-
1XBet, 888 Holdings Plc, Ballys Corp., Bet365 Group Ltd., Betfred Group, BetOnline, Betsson AB, Cherry Spelgladje AB, Churchill Downs Inc., Entain Plc, Flutter Entertainment Plc, Fortuna Entertainment Group AS, Galaxy Entertainment Group Ltd., INTRALOT SA, Kindred Group Plc, MGM Resorts International, Rank Group PLC, Scientific Games LLC, Sportech Plc, and Super Group SGHC Ltd.
-
Market Research Insights
- The market is a dynamic and ever-evolving industry, characterized by continuous growth and innovation. Two significant data points illustrate this trend. First, player segmentation techniques have led to a notable increase in customer retention, with studies showing that targeted marketing strategies can boost retention rates by up to 30%. Second, industry analysts anticipate that the market will expand by over 15% annually in the coming years, driven by factors such as cross-platform development, machine learning applications, and mobile platform compatibility.
- An example of this growth can be seen in the increasing popularity of poker, with some platforms reporting a surge in new player registrations and tournament participation.
We can help! Our analysts can customize this online gambling market research report to meet your requirements.
 RIA -
RIA - 
