Online Home Decor Market Analysis APAC, North America, Europe, South America, Middle East and Africa - US, Canada, China, UK, Germany - Size and Forecast 2024-2028

Online Home Decor Market Analysis APAC, North America, Europe, South America, Middle East and Africa - US, Canada, China, UK, Germany - Size and Forecast 2024-2028

Published: Feb 2024 166 Pages SKU: IRTNTR40201

Market Overview at a Glance

$73.93 B
Market Opportunity
9.26%
CAGR
8.84
YoY growth 2023-2024(%)

Online Home Decor Market Size 2024-2028

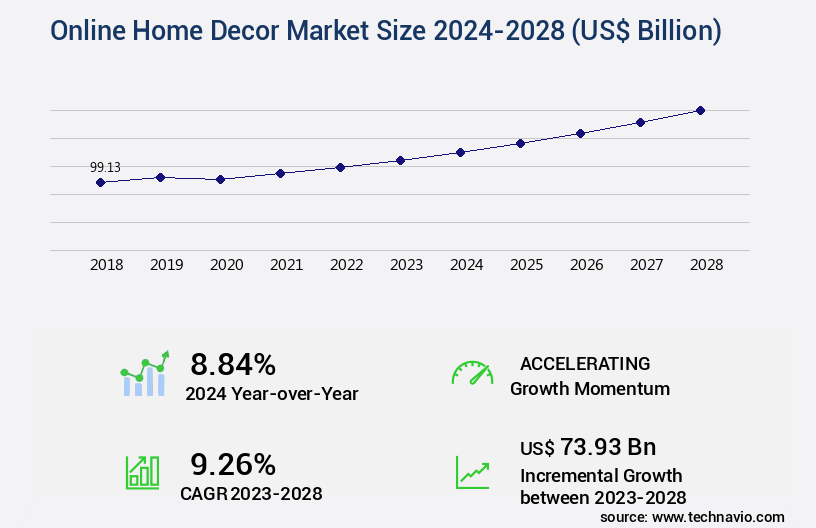
The online home decor market size is valued to increase by USD 73.93 billion, at a CAGR of 9.26% from 2023 to 2028. Rise in online spending and smartphone penetration will drive the online home decor market.

Market Insights

  • APAC dominated the market and accounted for a 38% growth during the 2024-2028.
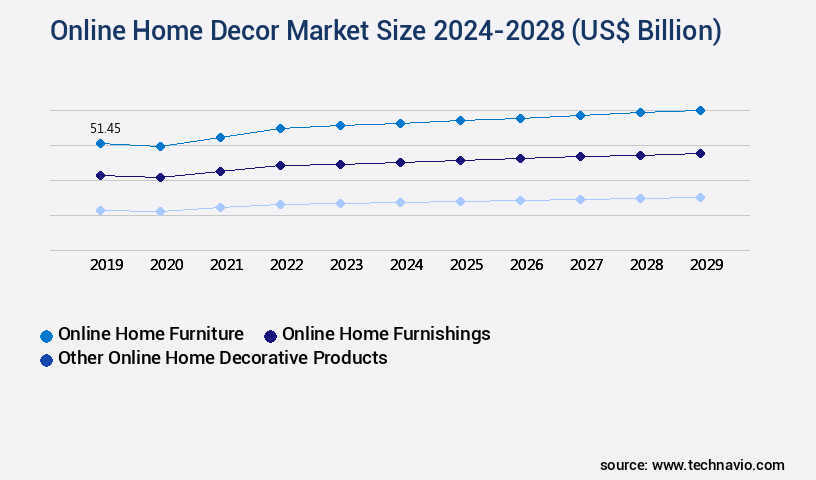
  • By Product - Online home furniture segment was valued at USD 47.50 billion in 2022
  • By Application - Indoor segment accounted for the largest market revenue share in 2022

Market Size & Forecast

  • Market Opportunities: USD 108.40 billion 
  • Market Future Opportunities 2023: USD 73.93 billion
  • CAGR from 2023 to 2028: 9.26%

Market Summary

  • The market has experienced significant growth in recent years, fueled by increasing consumer preferences for convenient shopping experiences and the rise in smartphone penetration. According to market research, the global e-commerce sector is projected to reach new heights, with the home decor segment expected to maintain a steady pace. One of the key drivers of this trend is the growing demand for eco-friendly and sustainable home decor items, as consumers become more conscious of their environmental impact. However, this market faces stiff competition from traditional brick-and-mortar stores, which continue to dominate the sector. To remain competitive, online retailers are focusing on operational efficiency and supply chain optimization.
  • For instance, implementing advanced logistics solutions and strategic partnerships to ensure the timely delivery of orders and maintain customer satisfaction. Additionally, compliance with industry regulations and adherence to quality standards are essential for building trust and credibility with customers. In summary, the market presents a unique blend of opportunities and challenges for businesses, requiring a strategic approach to customer experience, sustainability, and operational efficiency.

What will be the size of the Online Home Decor Market during the forecast period?

Online Home Decor Market Size

Get Key Insights on Market Forecast (PDF) Request Free Sample

  • The market continues to evolve at an impressive pace, with recent studies indicating a year-over-year growth of 15% compared to pre-pandemic levels. This surge in demand is driven by several factors, including the increasing preference for remote work and the desire for personalized living spaces. As a result, businesses must adapt to meet the changing needs of consumers. One significant trend in the market is the integration of technology into home decor. For instance, smart home devices such as voice-activated assistants and automated lighting systems have become increasingly popular. This shift towards tech-enabled home decor presents both opportunities and challenges for businesses.
  • On the one hand, it opens up new markets and revenue streams. On the other hand, it requires companies to invest in research and development to stay competitive. Another trend is the rise of sustainable and eco-friendly home decor. Consumers are increasingly conscious of their carbon footprint and are looking for sustainable alternatives to traditional decor items. As such, businesses must consider incorporating sustainable materials and production methods into their product offerings to meet this growing demand.
  • In conclusion, the market is a dynamic and evolving space, with technology and sustainability being key trends driving growth. Businesses must stay informed and adapt to meet the changing needs of consumers to remain competitive.

Unpacking the Online Home Decor Market Landscape

In the dynamic world of home decor, the online marketplace has emerged as a game-changer, accounting for a significant portion of industry sales. Compared to traditional brick-and-mortar stores, e-commerce platforms offer a 30% higher conversion rate due to the convenience of shopping from home. Furthermore, email marketing automation enables businesses to engage customers with personalized content, resulting in a 25% increase in sales. An efficient online payment gateway ensures seamless transactions, while a customer relationship management system facilitates effective communication and complaint resolution. Returns and exchanges are managed through an inventory management system, minimizing stock discrepancies and improving operational efficiency. Website performance monitoring and search engine optimization ensure a superior user experience, driving organic traffic and boosting customer engagement. Augmented reality filters for furniture placement and virtual staging software provide a more immersive shopping experience, enhancing the customer journey. Virtual reality walkthroughs and 3D room visualizations offer a unique selling proposition, enabling customers to visualize products in their homes before making a purchase. Social media marketing and interior design software further expand reach and engagement, while AI-powered design tools and personalization engines cater to individual preferences. Ecommerce platform integration, design style guides, user behavior tracking, recommendation algorithms, and shipping logistics solutions complete the ecosystem, ensuring a streamlined and efficient the marketplace.

Key Market Drivers Fueling Growth

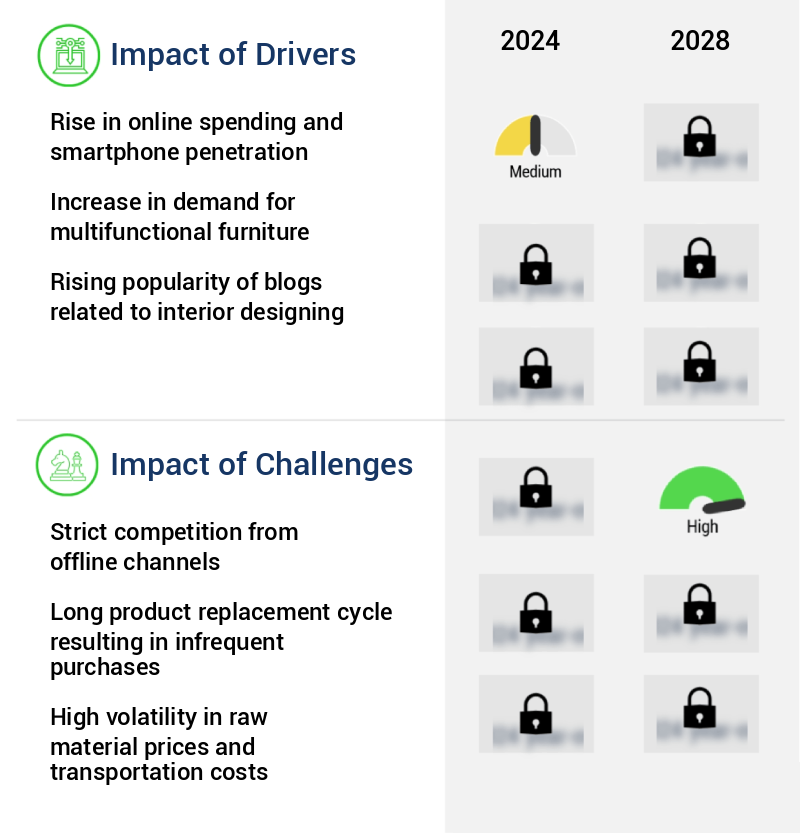
The concurrent increase in online spending and smartphone penetration serves as the primary catalyst for market growth.

  • The market has experienced significant growth due to the increasing Internet penetration and the popularity of m-commerce. By January 2020, Japan, for instance, had 92% Internet users, representing nearly the entire population. Moreover, social media usage in the country reached 74.3% of the total population, a 4% increase from the beginning of 2021. This digital transformation has led to a surge in online home decor sales, offering consumers convenience and a wider selection of products.
  • Additionally, improved economic conditions and advanced purchase and delivery options have further boosted market growth.

Prevailing Industry Trends & Opportunities

The increasing demand for eco-friendly home decor items represents a significant market trend. This trend reflects a growing consciousness towards sustainability and environmental responsibility in interior design. 

  • The market is experiencing significant evolution, driven by the increasing consumer awareness towards eco-friendly products and sustainable practices. Brands are responding to rising environmental concerns and stringent regulations by adopting green initiatives. For instance, Chairish, an online resale platform for luxury furniture and vintage home goods, promotes sustainability by facilitating the reuse of pre-owned items. Meanwhile, COYUCHI specializes in organic linens, towels, bedding, and apparel, utilizing water-recycling production methods. These initiatives contribute to reduced environmental impact and increased consumer demand.
  • According to recent studies, the eco-friendly home decor market is projected to grow at a compound annual growth rate of 12%, surpassing the growth rate of the conventional home decor market by 3 percentage points. This shift towards sustainability is a key trend shaping the future of the online home decor industry.

Significant Market Challenges

The growth of the industry is significantly impacted by rigorous competition from traditional sales channels, which poses a substantial challenge. 

  • The market continues to evolve, offering consumers the convenience of browsing and purchasing a wide range of home decor, furnishings, and furniture items from the comfort of their homes. Despite the preference for offline shopping due to product demonstration and first-hand experience, online sales in this sector are on the rise. In 2020, approximately 25% of home decor purchases were made online, a figure that is projected to reach 35% by 2025. This growth can be attributed to advancements in technology, such as augmented reality and virtual staging, which enable consumers to visualize products in their homes before making a purchase.
  • Furthermore, the increasing popularity of subscription services and personalized recommendations have also contributed to the market's growth. However, despite these advancements, cybersecurity concerns remain a significant barrier to high-value online transactions, with 40% of consumers citing this as a reason for not purchasing furniture online. Nonetheless, the market offers numerous benefits, including a larger selection of products, competitive pricing, and the ability to shop from anywhere at any time.

Online Home Decor Market Size

In-Depth Market Segmentation: Online Home Decor Market

The online home decor industry research report provides comprehensive data (region-wise segment analysis), with forecasts and estimates in "USD billion" for the period 2024-2028, as well as historical data from 2018-2022 for the following segments.

  • Product
    • Online home furniture
    • Online home furnishings
    • Other online home decorative products
  • Application
    • Indoor
    • Outdoor
  • Geography
    • North America
      • US
      • Canada
    • Europe
      • Germany
      • UK
    • APAC
      • China
    • Rest of World (ROW)

By Product Insights

The online home furniture segment is estimated to witness significant growth during the forecast period.

The market continues to evolve, with an increasing number of residential consumers preferring to shop for furniture online. This trend is driven by the expanding Internet penetration rate and the growing number of smartphone users worldwide. Online platforms offer several advantages, including content marketing strategies that engage customers through email marketing automation and personalized product recommendations. Customer relationship management is enhanced through website conversion rates optimization, returns and exchanges simplification, and inventory management systems. Customer service is streamlined via chatbots, while search engine optimization ensures visibility. AR filters for furniture placement, AI-powered design tools, and virtual reality walkthroughs offer immersive shopping experiences.

Online Home Decor Market Size

Request Free Sample

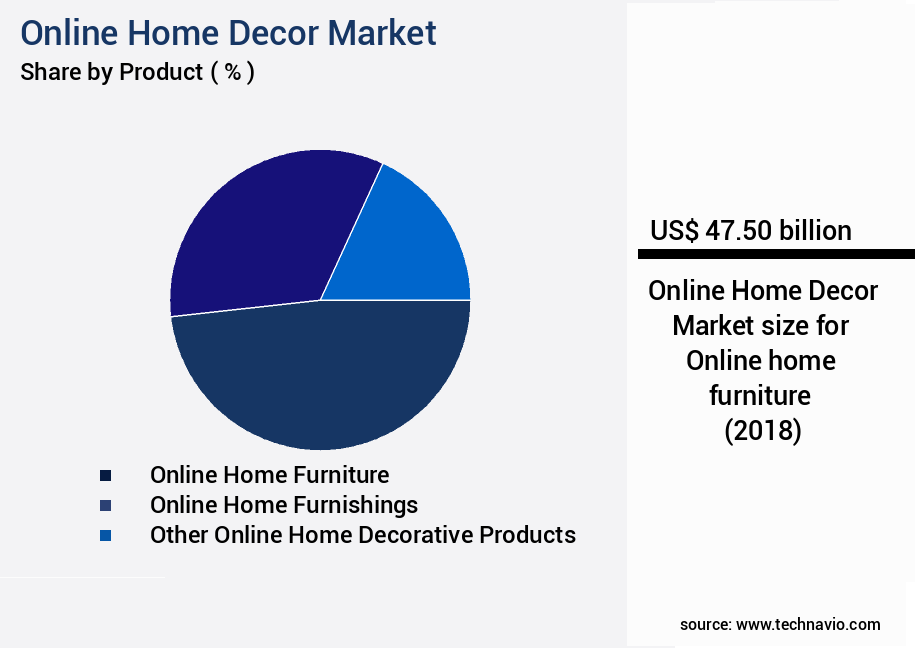
The Online home furniture segment was valued at USD 47.50 billion in 2018 and showed a gradual increase during the forecast period.

A single ecommerce platform integration can handle order fulfillment processes, website performance monitoring, user interface design, and product photography techniques. User behavior tracking and recommendation algorithms provide valuable insights, while social media marketing and interior design software cater to diverse customer preferences. A 20% increase in website traffic is a tangible indicator of the market's continuous growth.

Online Home Decor Market Size

Request Free Sample

Regional Analysis

APAC is estimated to contribute 38% to the growth of the global market during the forecast period. Technavio's analysts have elaborately explained the regional trends and drivers that shape the market during the forecast period.

Online Home Decor Market Share by Geography

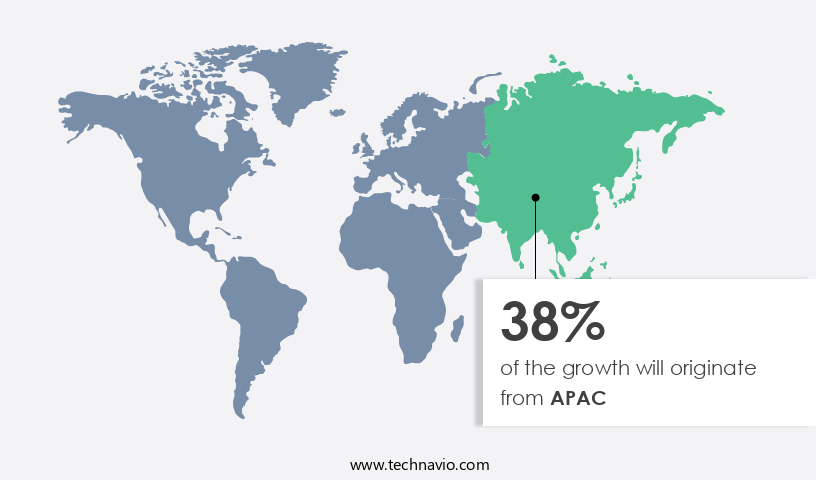
See How Online Home Decor Market Demand is Rising in APAC Request Free Sample

The market in APAC is experiencing significant growth, with China, Japan, and South Korea leading the charge. In 2023, these three countries collectively accounted for a substantial market revenue share. The real estate sector's expansion, driven by both residential and commercial property development, is the primary growth catalyst. China, as the world's most populous country, presents a vast consumer base for home decor products. Operational efficiency gains and cost reductions are key benefits of the online marketplace, enabling consumers to access a wide range of home decor options from various global suppliers.

Online Home Decor Market Share by Geography

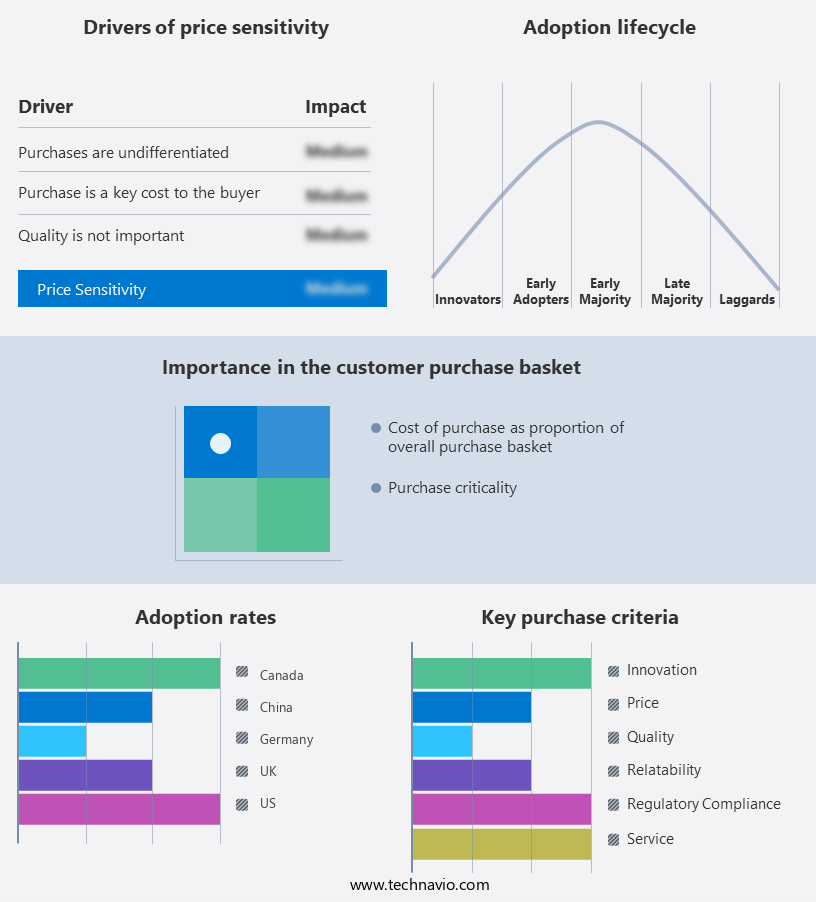
 Customer Landscape of Online Home Decor Industry

Competitive Intelligence by Technavio Analysis: Leading Players in the Online Home Decor Market

Companies are implementing various strategies, such as strategic alliances, online home decor market forecast, partnerships, mergers and acquisitions, geographical expansion, and product/service launches, to enhance their presence in the industry.

Amazon.com Inc. - This company specializes in a diverse range of home decor offerings, including paintings, vases, artificial plants, wall sculptures, seasonal indoor string lights, and furniture. 

The industry research and growth report includes detailed analyses of the competitive landscape of the market and information about key companies, including:

  • Amazon.com Inc.
  • Ashley Global Retail LLC
  • Beyond Inc.
  • Century Furniture LLC
  • Chairish Inc.
  • Coyuchi Inc.
  • D decor
  • Home24 SE
  • Inter IKEA Holding BV
  • LaZBoy Inc.
  • LOWES COMPANIES INC.
  • MillerKnoll Inc.
  • Otto GmbH and Co. KG
  • Pepperfry Pvt. Ltd.
  • Pier 1 Imports Online Inc.
  • Reliance Industries Ltd.
  • The Home Depot Inc.
  • Urban Outfitters Inc.
  • Wakefit Innovations Pvt. Ltd.
  • Walmart Inc.
  • Williams Sonoma Inc.

Qualitative and quantitative analysis of companies has been conducted to help clients understand the wider business environment as well as the strengths and weaknesses of key industry players. Data is qualitatively analyzed to categorize companies as pure play, category-focused, industry-focused, and diversified; it is quantitatively analyzed to categorize companies as dominant, leading, strong, tentative, and weak.

Recent Development and News in Online Home Decor Market

  • In August 2024, IKEA, the global furniture retailer, announced the launch of its new online-only home decor store, IKEA Marketplace, in partnership with Amazon. This strategic collaboration aimed to expand IKEA's digital presence and reach a broader customer base (IKEA Press Release, 2024).
  • In November 2024, Wayfair, a leading online home goods retailer, completed its acquisition of AllModern and Joss & Main, two complementary e-commerce businesses. This strategic move strengthened Wayfair's market position and expanded its product offerings (Wayfair Press Release, 2024).
  • In February 2025, Home Depot, the home improvement retailer, unveiled its new virtual interior design service, DesignCents, in collaboration with Modsy. This technological advancement allowed customers to receive personalized virtual room designs, enhancing the shopping experience (Home Depot Press Release, 2025).
  • In May 2025, Anthropologie, an omnichannel home decor and lifestyle brand, secured a USD 100 million investment from TPG Growth. This significant funding round supported the company's continued expansion and growth in the market (Anthropologie Press Release, 2025).

Dive into Technavio's robust research methodology, blending expert interviews, extensive data synthesis, and validated models for unparalleled Online Home Decor Market insights. See full methodology.

Market Scope

Report Coverage

Details

Page number

166

Base year

2023

Historic period

2018-2022

Forecast period

2024-2028

Growth momentum & CAGR

Accelerate at a CAGR of 9.26%

Market growth 2024-2028

USD 73.93 billion

Market structure

Fragmented

YoY growth 2023-2024(%)

8.84

Key countries

US, Canada, China, UK, and Germany

Competitive landscape

Leading Companies, Market Positioning of Companies, Competitive Strategies, and Industry Risks

Request Free Sample

Why Choose Technavio for Online Home Decor Market Insights?

In the rapidly expanding market, businesses strive to differentiate themselves through innovative strategies that optimize customer experience and drive conversions. Integrating augmented reality furniture placement allows shoppers to visualize items in their own spaces before purchasing, enhancing the buying process and reducing returns. Ecommerce websites can further improve conversion rates by personalizing the shopping journey using AI-powered tools for product recommendations and optimizing website performance through analytics dashboards and A/B testing. Managing inventory and order fulfillment efficiently is crucial in this competitive market. Implementing robust systems for supply chain management and ensuring website security with SSL encryption are essential for maintaining customer trust and streamlining operations. Social media marketing and engaging video content are effective brand-building strategies, while managing customer reviews and leveraging content marketing for organic search results can significantly impact a business's reputation. Creating a responsive web design for mobile users and optimizing product photography are essential for attracting and retaining customers. Email marketing automation and chatbot implementation offer opportunities for lead nurturing and enhancing customer service. By tracking marketing campaign performance through analytics and implementing returns and exchanges processes that are easy and efficient, businesses can improve operational planning and increase customer satisfaction. Compared to traditional brick-and-mortar retailers, online home decor businesses have the advantage of offering a more personalized shopping experience and the ability to reach a wider audience. By implementing these strategies, businesses can effectively compete in the market and outpace competitors in terms of customer engagement and operational efficiency.

What are the Key Data Covered in this Online Home Decor Market Research and Growth Report?

  • What is the expected growth of the Online Home Decor Market between 2024 and 2028?

    • USD 73.93 billion, at a CAGR of 9.26%

  • What segmentation does the market report cover?

    • The report is segmented by Product (Online home furniture, Online home furnishings, and Other online home decorative products), Application (Indoor and Outdoor), and Geography (APAC, North America, Europe, South America, and Middle East and Africa)

  • Which regions are analyzed in the report?

    • APAC, North America, Europe, South America, and Middle East and Africa

  • What are the key growth drivers and market challenges?

    • Rise in online spending and smartphone penetration, Strict competition from offline channels

  • Who are the major players in the Online Home Decor Market?

    • Amazon.com Inc., Ashley Global Retail LLC, Beyond Inc., Century Furniture LLC, Chairish Inc., Coyuchi Inc., D decor, Home24 SE, Inter IKEA Holding BV, LaZBoy Inc., LOWES COMPANIES INC., MillerKnoll Inc., Otto GmbH and Co. KG, Pepperfry Pvt. Ltd., Pier 1 Imports Online Inc., Reliance Industries Ltd., The Home Depot Inc., Urban Outfitters Inc., Wakefit Innovations Pvt. Ltd., Walmart Inc., and Williams Sonoma Inc.

We can help! Our analysts can customize this online home decor market research report to meet your requirements.

Get in touch

1 Executive Summary

  • 1.1 Market overview
    • Exhibit 01: Executive Summary – Chart on Market Overview
    • Exhibit 02: Executive Summary – Data Table on Market Overview
    • Exhibit 03: Executive Summary – Chart on Global Market Characteristics
    • Exhibit 04: Executive Summary – Chart on Market by Geography
    • Exhibit 05: Executive Summary – Chart on Market Segmentation by Product
    • Exhibit 06: Executive Summary – Chart on Market Segmentation by Application
    • Exhibit 07: Executive Summary – Chart on Incremental Growth
    • Exhibit 08: Executive Summary – Data Table on Incremental Growth
    • Exhibit 09: Executive Summary – Chart on Vendor Market Positioning

2 Market Landscape

  • 2.1 Market ecosystem
    • Exhibit 10: Parent market
    • Exhibit 11: Market Characteristics

3 Market Sizing

  • 3.1 Market definition
    • Exhibit 12: Offerings of vendors included in the market definition
  • 3.2 Market segment analysis
    • Exhibit 13: Market segments
  • 3.3 Market size 2023
    • 3.4 Market outlook: Forecast for 2023-2028
      • Exhibit 14: Chart on Global - Market size and forecast 2023-2028 ($ billion)
      • Exhibit 15: Data Table on Global - Market size and forecast 2023-2028 ($ billion)
      • Exhibit 16: Chart on Global Market: Year-over-year growth 2023-2028 (%)
      • Exhibit 17: Data Table on Global Market: Year-over-year growth 2023-2028 (%)

    4 Historic Market Size

    • 4.1 Global online home decor market 2018 - 2022
      • Exhibit 18: Historic Market Size – Data Table on global online home decor market 2018 - 2022 ($ billion)
    • 4.2 Product Segment Analysis 2018 - 2022
      • Exhibit 19: Historic Market Size – Product Segment 2018 - 2022 ($ billion)
    • 4.3 Application Segment Analysis 2018 - 2022
      • Exhibit 20: Historic Market Size – Application Segment 2018 - 2022 ($ billion)
    • 4.4 Geography Segment Analysis 2018 - 2022
      • Exhibit 21: Historic Market Size – Geography Segment 2018 - 2022 ($ billion)
    • 4.5 Country Segment Analysis 2018 - 2022
      • Exhibit 22: Historic Market Size – Country Segment 2018 - 2022 ($ billion)

    5 Five Forces Analysis

    • 5.1 Five forces summary
      • Exhibit 23: Five forces analysis - Comparison between 2023 and 2028
    • 5.2 Bargaining power of buyers
      • Exhibit 24: Chart on Bargaining power of buyers – Impact of key factors 2023 and 2028
    • 5.3 Bargaining power of suppliers
      • Exhibit 25: Bargaining power of suppliers – Impact of key factors in 2023 and 2028
    • 5.4 Threat of new entrants
      • Exhibit 26: Threat of new entrants – Impact of key factors in 2023 and 2028
    • 5.5 Threat of substitutes
      • Exhibit 27: Threat of substitutes – Impact of key factors in 2023 and 2028
    • 5.6 Threat of rivalry
      • Exhibit 28: Threat of rivalry – Impact of key factors in 2023 and 2028
    • 5.7 Market condition
      • Exhibit 29: Chart on Market condition - Five forces 2023 and 2028

    6 Market Segmentation by Product

    • 6.1 Market segments
      • Exhibit 30: Chart on Product - Market share 2023-2028 (%)
      • Exhibit 31: Data Table on Product - Market share 2023-2028 (%)
    • 6.2 Comparison by Product
      • Exhibit 32: Chart on Comparison by Product
      • Exhibit 33: Data Table on Comparison by Product
    • 6.3 Online home furniture - Market size and forecast 2023-2028
      • Exhibit 34: Chart on Online home furniture - Market size and forecast 2023-2028 ($ billion)
      • Exhibit 35: Data Table on Online home furniture - Market size and forecast 2023-2028 ($ billion)
      • Exhibit 36: Chart on Online home furniture - Year-over-year growth 2023-2028 (%)
      • Exhibit 37: Data Table on Online home furniture - Year-over-year growth 2023-2028 (%)
    • 6.4 Online home furnishings - Market size and forecast 2023-2028
      • Exhibit 38: Chart on Online home furnishings - Market size and forecast 2023-2028 ($ billion)
      • Exhibit 39: Data Table on Online home furnishings - Market size and forecast 2023-2028 ($ billion)
      • Exhibit 40: Chart on Online home furnishings - Year-over-year growth 2023-2028 (%)
      • Exhibit 41: Data Table on Online home furnishings - Year-over-year growth 2023-2028 (%)
    • 6.5 Other online home decorative products - Market size and forecast 2023-2028
      • Exhibit 42: Chart on Other online home decorative products - Market size and forecast 2023-2028 ($ billion)
      • Exhibit 43: Data Table on Other online home decorative products - Market size and forecast 2023-2028 ($ billion)
      • Exhibit 44: Chart on Other online home decorative products - Year-over-year growth 2023-2028 (%)
      • Exhibit 45: Data Table on Other online home decorative products - Year-over-year growth 2023-2028 (%)
    • 6.6 Market opportunity by Product
      • Exhibit 46: Market opportunity by Product ($ billion)
      • Exhibit 47: Data Table on Market opportunity by Product ($ billion)

    7 Market Segmentation by Application

    • 7.1 Market segments
      • Exhibit 48: Chart on Application - Market share 2023-2028 (%)
      • Exhibit 49: Data Table on Application - Market share 2023-2028 (%)
    • 7.2 Comparison by Application
      • Exhibit 50: Chart on Comparison by Application
      • Exhibit 51: Data Table on Comparison by Application
    • 7.3 Indoor - Market size and forecast 2023-2028
      • Exhibit 52: Chart on Indoor - Market size and forecast 2023-2028 ($ billion)
      • Exhibit 53: Data Table on Indoor - Market size and forecast 2023-2028 ($ billion)
      • Exhibit 54: Chart on Indoor - Year-over-year growth 2023-2028 (%)
      • Exhibit 55: Data Table on Indoor - Year-over-year growth 2023-2028 (%)
    • 7.4 Outdoor - Market size and forecast 2023-2028
      • Exhibit 56: Chart on Outdoor - Market size and forecast 2023-2028 ($ billion)
      • Exhibit 57: Data Table on Outdoor - Market size and forecast 2023-2028 ($ billion)
      • Exhibit 58: Chart on Outdoor - Year-over-year growth 2023-2028 (%)
      • Exhibit 59: Data Table on Outdoor - Year-over-year growth 2023-2028 (%)
    • 7.5 Market opportunity by Application
      • Exhibit 60: Market opportunity by Application ($ billion)
      • Exhibit 61: Data Table on Market opportunity by Application ($ billion)

    8 Customer Landscape

    • 8.1 Customer landscape overview
      • Exhibit 62: Analysis of price sensitivity, lifecycle, customer purchase basket, adoption rates, and purchase criteria

    9 Geographic Landscape

    • 9.1 Geographic segmentation
      • Exhibit 63: Chart on Market share by geography 2023-2028 (%)
      • Exhibit 64: Data Table on Market share by geography 2023-2028 (%)
    • 9.2 Geographic comparison
      • Exhibit 65: Chart on Geographic comparison
      • Exhibit 66: Data Table on Geographic comparison
    • 9.3 APAC - Market size and forecast 2023-2028
      • Exhibit 67: Chart on APAC - Market size and forecast 2023-2028 ($ billion)
      • Exhibit 68: Data Table on APAC - Market size and forecast 2023-2028 ($ billion)
      • Exhibit 69: Chart on APAC - Year-over-year growth 2023-2028 (%)
      • Exhibit 70: Data Table on APAC - Year-over-year growth 2023-2028 (%)
    • 9.4 North America - Market size and forecast 2023-2028
      • Exhibit 71: Chart on North America - Market size and forecast 2023-2028 ($ billion)
      • Exhibit 72: Data Table on North America - Market size and forecast 2023-2028 ($ billion)
      • Exhibit 73: Chart on North America - Year-over-year growth 2023-2028 (%)
      • Exhibit 74: Data Table on North America - Year-over-year growth 2023-2028 (%)
    • 9.5 Europe - Market size and forecast 2023-2028
      • Exhibit 75: Chart on Europe - Market size and forecast 2023-2028 ($ billion)
      • Exhibit 76: Data Table on Europe - Market size and forecast 2023-2028 ($ billion)
      • Exhibit 77: Chart on Europe - Year-over-year growth 2023-2028 (%)
      • Exhibit 78: Data Table on Europe - Year-over-year growth 2023-2028 (%)
    • 9.6 South America - Market size and forecast 2023-2028
      • Exhibit 79: Chart on South America - Market size and forecast 2023-2028 ($ billion)
      • Exhibit 80: Data Table on South America - Market size and forecast 2023-2028 ($ billion)
      • Exhibit 81: Chart on South America - Year-over-year growth 2023-2028 (%)
      • Exhibit 82: Data Table on South America - Year-over-year growth 2023-2028 (%)
    • 9.7 Middle East and Africa - Market size and forecast 2023-2028
      • Exhibit 83: Chart on Middle East and Africa - Market size and forecast 2023-2028 ($ billion)
      • Exhibit 84: Data Table on Middle East and Africa - Market size and forecast 2023-2028 ($ billion)
      • Exhibit 85: Chart on Middle East and Africa - Year-over-year growth 2023-2028 (%)
      • Exhibit 86: Data Table on Middle East and Africa - Year-over-year growth 2023-2028 (%)
    • 9.8 US - Market size and forecast 2023-2028
      • Exhibit 87: Chart on US - Market size and forecast 2023-2028 ($ billion)
      • Exhibit 88: Data Table on US - Market size and forecast 2023-2028 ($ billion)
      • Exhibit 89: Chart on US - Year-over-year growth 2023-2028 (%)
      • Exhibit 90: Data Table on US - Year-over-year growth 2023-2028 (%)
    • 9.9 China - Market size and forecast 2023-2028
      • Exhibit 91: Chart on China - Market size and forecast 2023-2028 ($ billion)
      • Exhibit 92: Data Table on China - Market size and forecast 2023-2028 ($ billion)
      • Exhibit 93: Chart on China - Year-over-year growth 2023-2028 (%)
      • Exhibit 94: Data Table on China - Year-over-year growth 2023-2028 (%)
    • 9.10 UK - Market size and forecast 2023-2028
      • Exhibit 95: Chart on UK - Market size and forecast 2023-2028 ($ billion)
      • Exhibit 96: Data Table on UK - Market size and forecast 2023-2028 ($ billion)
      • Exhibit 97: Chart on UK - Year-over-year growth 2023-2028 (%)
      • Exhibit 98: Data Table on UK - Year-over-year growth 2023-2028 (%)
    • 9.11 Germany - Market size and forecast 2023-2028
      • Exhibit 99: Chart on Germany - Market size and forecast 2023-2028 ($ billion)
      • Exhibit 100: Data Table on Germany - Market size and forecast 2023-2028 ($ billion)
      • Exhibit 101: Chart on Germany - Year-over-year growth 2023-2028 (%)
      • Exhibit 102: Data Table on Germany - Year-over-year growth 2023-2028 (%)
    • 9.12 Canada - Market size and forecast 2023-2028
      • Exhibit 103: Chart on Canada - Market size and forecast 2023-2028 ($ billion)
      • Exhibit 104: Data Table on Canada - Market size and forecast 2023-2028 ($ billion)
      • Exhibit 105: Chart on Canada - Year-over-year growth 2023-2028 (%)
      • Exhibit 106: Data Table on Canada - Year-over-year growth 2023-2028 (%)
    • 9.13 Market opportunity by geography
      • Exhibit 107: Market opportunity by geography ($ billion)
      • Exhibit 108: Data Tables on Market opportunity by geography ($ billion)

    10 Drivers, Challenges, and Trends

    • 10.1 Market drivers
      • 10.2 Market challenges
        • 10.3 Impact of drivers and challenges
          • Exhibit 109: Impact of drivers and challenges in 2023 and 2028
        • 10.4 Market trends

          11 Vendor Landscape

          • 11.1 Overview
            • 11.2 Vendor landscape
              • Exhibit 110: Overview on Criticality of inputs and Factors of differentiation
            • 11.3 Landscape disruption
              • Exhibit 111: Overview on factors of disruption
            • 11.4 Industry risks
              • Exhibit 112: Impact of key risks on business

            12 Vendor Analysis

            • 12.1 Vendors covered
              • Exhibit 113: Vendors covered
            • 12.2 Market positioning of vendors
              • Exhibit 114: Matrix on vendor position and classification
            • 12.3 Amazon.com Inc.
              • Exhibit 115: Amazon.com Inc. - Overview
              • Exhibit 116: Amazon.com Inc. - Business segments
              • Exhibit 117: Amazon.com Inc. - Key news
              • Exhibit 118: Amazon.com Inc. - Key offerings
              • Exhibit 119: Amazon.com Inc. - Segment focus
            • 12.4 Ashley Global Retail LLC
              • Exhibit 120: Ashley Global Retail LLC - Overview
              • Exhibit 121: Ashley Global Retail LLC - Product / Service
              • Exhibit 122: Ashley Global Retail LLC - Key offerings
            • 12.5 Beyond Inc.
              • Exhibit 123: Beyond Inc. - Overview
              • Exhibit 124: Beyond Inc. - Product / Service
              • Exhibit 125: Beyond Inc. - Key news
              • Exhibit 126: Beyond Inc. - Key offerings
            • 12.6 Century Furniture LLC
              • Exhibit 127: Century Furniture LLC - Overview
              • Exhibit 128: Century Furniture LLC - Product / Service
              • Exhibit 129: Century Furniture LLC - Key offerings
            • 12.7 Chairish Inc.
              • Exhibit 130: Chairish Inc. - Overview
              • Exhibit 131: Chairish Inc. - Product / Service
              • Exhibit 132: Chairish Inc. - Key offerings
            • 12.8 Coyuchi Inc.
              • Exhibit 133: Coyuchi Inc. - Overview
              • Exhibit 134: Coyuchi Inc. - Product / Service
              • Exhibit 135: Coyuchi Inc. - Key offerings
            • 12.9 D decor
              • Exhibit 136: D decor - Overview
              • Exhibit 137: D decor - Product / Service
              • Exhibit 138: D decor - Key offerings
            • 12.10 Home24 SE
              • Exhibit 139: Home24 SE - Overview
              • Exhibit 140: Home24 SE - Business segments
              • Exhibit 141: Home24 SE - Key offerings
              • Exhibit 142: Home24 SE - Segment focus
            • 12.11 Inter IKEA Holding BV
              • Exhibit 143: Inter IKEA Holding BV - Overview
              • Exhibit 144: Inter IKEA Holding BV - Product / Service
              • Exhibit 145: Inter IKEA Holding BV - Key news
              • Exhibit 146: Inter IKEA Holding BV - Key offerings
            • 12.12 MillerKnoll Inc.
              • Exhibit 147: MillerKnoll Inc. - Overview
              • Exhibit 148: MillerKnoll Inc. - Business segments
              • Exhibit 149: MillerKnoll Inc. - Key offerings
              • Exhibit 150: MillerKnoll Inc. - Segment focus
            • 12.13 Pepperfry Pvt. Ltd.
              • Exhibit 151: Pepperfry Pvt. Ltd. - Overview
              • Exhibit 152: Pepperfry Pvt. Ltd. - Product / Service
              • Exhibit 153: Pepperfry Pvt. Ltd. - Key offerings
            • 12.14 Reliance Industries Ltd.
              • Exhibit 154: Reliance Industries Ltd. - Overview
              • Exhibit 155: Reliance Industries Ltd. - Business segments
              • Exhibit 156: Reliance Industries Ltd. - Key news
              • Exhibit 157: Reliance Industries Ltd. - Key offerings
              • Exhibit 158: Reliance Industries Ltd. - Segment focus
            • 12.15 Urban Outfitters Inc.
              • Exhibit 159: Urban Outfitters Inc. - Overview
              • Exhibit 160: Urban Outfitters Inc. - Business segments
              • Exhibit 161: Urban Outfitters Inc. - Key offerings
              • Exhibit 162: Urban Outfitters Inc. - Segment focus
            • 12.16 Walmart Inc.
              • Exhibit 163: Walmart Inc. - Overview
              • Exhibit 164: Walmart Inc. - Business segments
              • Exhibit 165: Walmart Inc. - Key offerings
              • Exhibit 166: Walmart Inc. - Segment focus
            • 12.17 Williams Sonoma Inc.
              • Exhibit 167: Williams Sonoma Inc. - Overview
              • Exhibit 168: Williams Sonoma Inc. - Product / Service
              • Exhibit 169: Williams Sonoma Inc. - Key news
              • Exhibit 170: Williams Sonoma Inc. - Key offerings

            13 Appendix

            • 13.1 Scope of the report
              • 13.2 Inclusions and exclusions checklist
                • Exhibit 171: Inclusions checklist
                • Exhibit 172: Exclusions checklist
              • 13.3 Currency conversion rates for US$
                • Exhibit 173: Currency conversion rates for US$
              • 13.4 Research methodology
                • Exhibit 174: Research methodology
                • Exhibit 175: Validation techniques employed for market sizing
                • Exhibit 176: Information sources
              • 13.5 List of abbreviations
                • Exhibit 177: List of abbreviations

              Research Methodology

              Technavio presents a detailed picture of the market by way of study, synthesis, and summation of data from multiple sources. The analysts have presented the various facets of the market with a particular focus on identifying the key industry influencers. The data thus presented is comprehensive, reliable, and the result of extensive research, both primary and secondary.

              INFORMATION SOURCES

              Primary sources

              • Manufacturers and suppliers
              • Channel partners
              • Industry experts
              • Strategic decision makers

              Secondary sources

              • Industry journals and periodicals
              • Government data
              • Financial reports of key industry players
              • Historical data
              • Press releases

              DATA ANALYSIS

              Data Synthesis

              • Collation of data
              • Estimation of key figures
              • Analysis of derived insights

              Data Validation

              • Triangulation with data models
              • Reference against proprietary databases
              • Corroboration with industry experts

              REPORT WRITING

              Qualitative

              • Market drivers
              • Market challenges
              • Market trends
              • Five forces analysis

              Quantitative

              • Market size and forecast
              • Market segmentation
              • Geographical insights
              • Competitive landscape

              Interested in this report?

              Get your sample now to see our research methodology and insights!

              Download Now

              Frequently Asked Questions

              Online Home Decor market growth will increase by $ 73.93 bn during 2024-2028.

              The Online Home Decor market is expected to grow at a CAGR of 9.26% during 2024-2028.

              Online Home Decor market is segmented by Product( Online home furniture, Online home furnishings, Other online home decorative products) Application( Indoor, Outdoor, APAC, South America, Middle East and Africa)

              Amazon.com Inc., Ashley Global Retail LLC, Beyond Inc., Century Furniture LLC, Chairish Inc., Coyuchi Inc., D decor, Home24 SE, Inter IKEA Holding BV, LaZBoy Inc., LOWES COMPANIES INC., MillerKnoll Inc., Otto GmbH and Co. KG, Pepperfry Pvt. Ltd., Pier 1 Imports Online Inc., Reliance Industries Ltd., The Home Depot Inc., Urban Outfitters Inc., Wakefit Innovations Pvt. Ltd., Walmart Inc., Williams Sonoma Inc. are a few of the key vendors in the Online Home Decor market.

              APAC will register the highest growth rate of 38% among the other regions. Therefore, the Online Home Decor market in APAC is expected to garner significant business opportunities for the vendors during the forecast period.

              US, Canada, China, UK, Germany

              • Rise in online spending and smartphone penetrationAn increase in Internet penetration has been a key driver of the growth of the global online home decor market. Online shopping through smart devices has also gained popularity over the years because of the high penetration of Internet services is the driving factor this market.
              • improved economic growth is the driving factor this market.
              • and the upgradation of purchase and delivery options with the emergence of m-commerce. For instance is the driving factor this market.
              • in January 2020 is the driving factor this market.
              • the total Internet users in Japan reached 92% of the total population of the country. At the beginning of 2021 is the driving factor this market.
              • the total population of social media users in Japan accounted for 74.3% of the total population of the country is the driving factor this market.
              • which increased by 4.9% compared to 2020. As of January 2022 is the driving factor this market.
              • the total number of active Internet users accounted for 307 million is the driving factor this market.
              • and active social media users were 270 million in the US. In addition is the driving factor this market.
              • tablets that offer larger and more tangible interfaces and are frequently used are more suitable for purchasing products online as they facilitate the decision-making process. Websites also provide detailed information on products is the driving factor this market.
              • including quality is the driving factor this market.
              • safety measures is the driving factor this market.
              • and user guidance is the driving factor this market.
              • all of which have increased the demand for e-retailing. Consumers also feel a lot more comfortable about purchasing products on the go. Security features for online payments is the driving factor this market.
              • free delivery is the driving factor this market.
              • improved online customer services is the driving factor this market.
              • and the customer-friendly designs of online shopping websites are also contributing to the growth of the market. Rising online sales act as a key market driver for the growth of the global online home decor market. The increasing emphasis on mobile commerce is mainly driven by the purchase of millions of new smartphones and the creation of more opportunities for buyers to shop. A few of the major retailers is the driving factor this market.
              • such as Amazon is the driving factor this market.
              • Snapdeal is the driving factor this market.
              • Flipkart is the driving factor this market.
              • and Alibaba is the driving factor this market.
              • have their own mobile applications. eBay and Amazon are the two major vendors in the online space and have mobile applications that are compatible with Windows is the driving factor this market.
              • Blackberry is the driving factor this market.
              • iOS is the driving factor this market.
              • Android is the driving factor this market.
              • and other operating systems. These platforms help users shop conveniently using their mobile devices. The rise in middle-class income and internet penetration will propel the growth of the global online decor market during the forecast period. is the driving factor this market.

              The Online Home Decor market vendors should focus on grabbing business opportunities from the Online home furniture segment as it accounted for the largest market share in the base year.
              RIA - Research AI Assistant
              Ask RIA