Oolong Tea Market Analysis APAC, Europe, North America, South America, Middle East and Africa - US, China, India, Germany, UK - Size and Forecast 2024-2028

Oolong Tea Market Analysis APAC, Europe, North America, South America, Middle East and Africa - US, China, India, Germany, UK - Size and Forecast 2024-2028

Published: Nov 2023 150 Pages SKU: IRTNTR76792

Market Overview at a Glance

$159.3 Mn
Market Opportunity
5.62%
CAGR
5.05
YoY growth 2023-2024(%)

Oolong Tea Market Size 2024-2028 

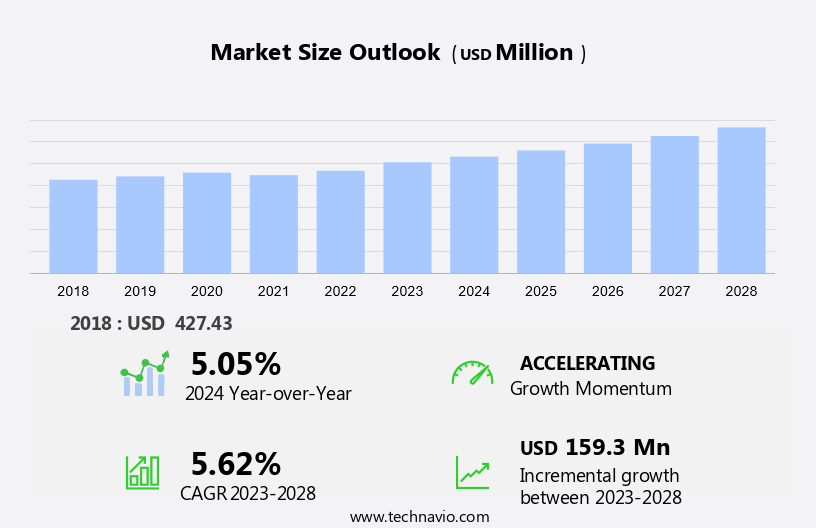
The oolong tea market size is forecast to increase by USD 159.3 million at a CAGR of 5.62% between 2023 and 2028. The global market is witnessing significant growth due to increasing awareness regarding the health benefits associated with consuming Oolong tea. This tea, which undergoes a partial fermentation process, is rich in antioxidants and is known to aid in weight loss and improve heart health. Another trend driving market growth is the rising popularity of artisanal and specialty teas, as consumers seek unique and high-quality tea experiences.

However, the impact of overconsumption of tea, particularly in relation to caffeine intake, may pose a challenge to market growth. Producers and suppliers must ensure they address consumer concerns around health and sustainability to maintain market traction.

Oolong Tea Market Size

 Request Free Sample

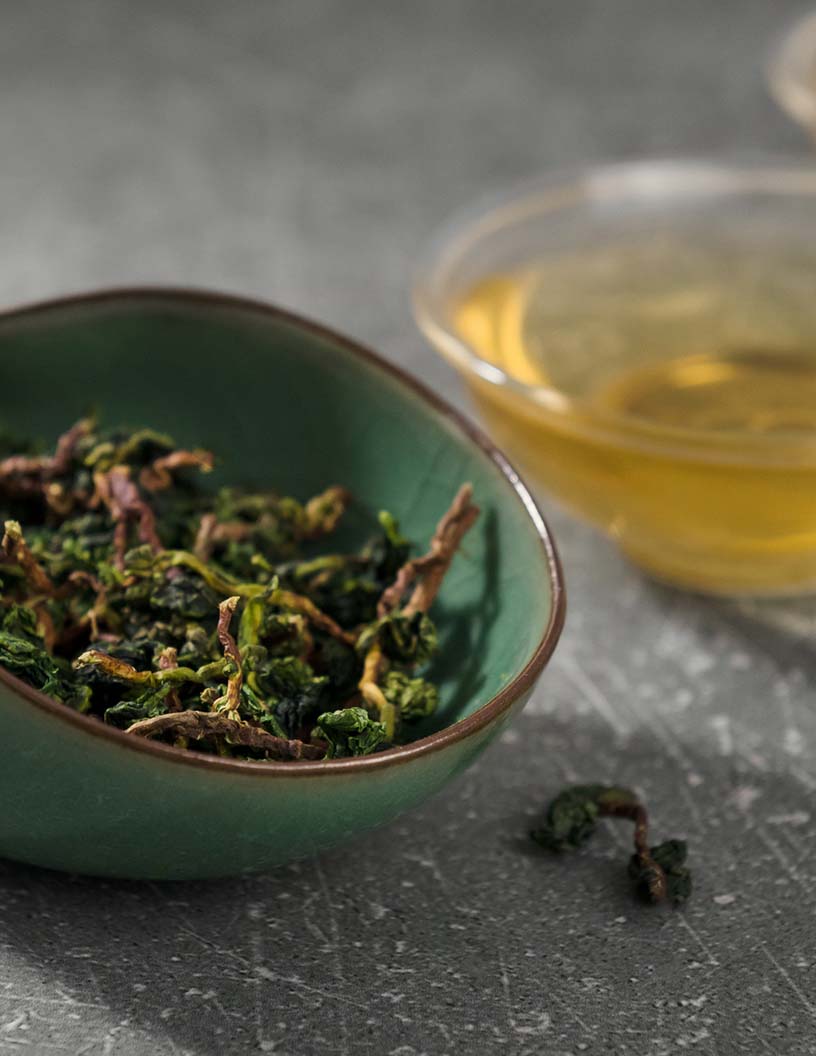
Oolong tea, a partially fermented tea originating from China, has gained significant popularity in the global market due to its numerous health benefits. The market for oolong tea is driven by the increasing consumer awareness towards weight control and digestion enhancement. The tea is rich in antioxidants, making it an ideal choice for consumers seeking functional beverages. Premium and specialty teas, including oolong, are witnessing a wave in demand due to their refreshing and invigorating properties. Cultural influence and digital marketing campaigns, along with celebrity endorsements, have contributed to the growth of the market. Price volatility and retail market pricing are crucial factors influencing the market's growth.

Furthermore, organic oolong teas, known for their health benefits, such as immune function and cholesterol level management, are gaining traction among health-conscious consumers. The market for oolong tea includes various forms, such as loose leaf, powder, and tea bags. Wuyi Oolong and Phoenix Oolong are popular varieties, with milk oolong tea gaining popularity due to its unique taste. The market caters to various segments, including restaurants, hotels, and cafes, among others. Herbal teas and functional beverages continue to face competition from oolong tea due to its superior taste and health benefits.

Market Segmentation

The market research report provides comprehensive data (region-wise segment analysis), with forecasts and estimates in "USD million" for the period 2024-2028, as well as historical data from 2018 - 2022 for the following segments.

  • Type
    • Leaf and powder
    • Tea bag
    • Liquid
  • Distribution Channel
    • Offline
    • Online
  • Geography
    • APAC
      • China
      • India
    • Europe
      • Germany
      • UK
    • North America
      • US
    • South America
    • Middle East and Africa

By Type Insights

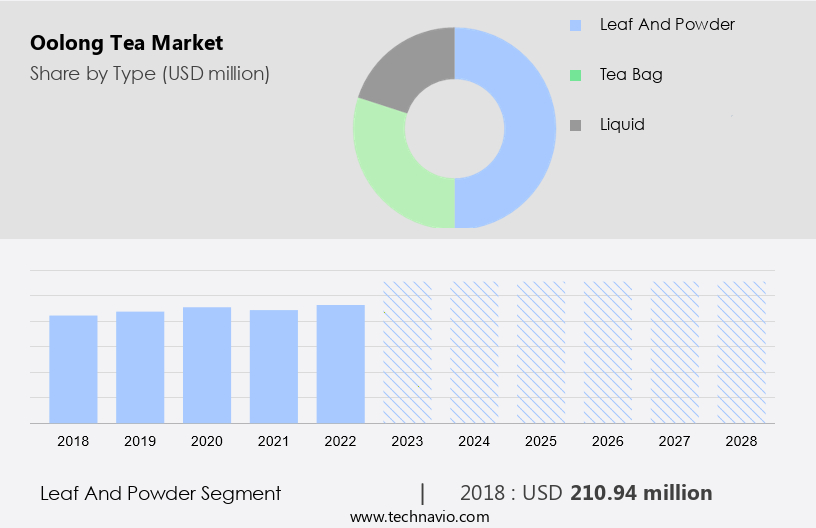
The leaf and powder segment is estimated to witness significant growth during the forecast period. Oolong tea, a premium and specialty type of tea, is recognized for its significant health benefits, including weight control and digestion enhancement. The tea's antioxidant properties make it a refreshing and invigorating beverage, popular among health-conscious consumers. Oolong tea's cultural influence extends beyond traditional tea-drinking countries, with digital marketing campaigns and celebrity endorsements contributing to its growing popularity. Distinguished from other teas by its unique processing methods, oolong tea leaves are hand-picked and undergo partial oxidation. This results in a diverse range of flavors, from light and floral to dark and strong, such as those found in Tie Guan Yin, Da Hong Pao, and Dong Ding.

Moreover, Oolong tea is available in various forms, including loose leaf and tea bags, catering to both traditional tea enthusiasts and modern consumers. Its versatility extends to flavored varieties infused with fruits, flowers, herbs, and spices. Price volatility, retail pricing, and sustainability concerns are crucial factors influencing the market. Environmental and social sustainability are increasingly important, with concerns over deforestation, water usage, food safety, and labeling specifications shaping consumer preferences. Seasonal variability and weather conditions also impact production and availability. Caffeine level and form are essential considerations for consumers, with some preferring the lower caffeine content of oolong tea compared to coffee and other functional beverages. Offline distribution channels, including specialty tea shops, convenience stores, and tea houses, continue to dominate the market, while online sales and e-commerce platforms gain traction.

Oolong Tea Market Size

Get a glance at the market share of various segments Request Free Sample

The leaf and powder segment was valued at USD 210.94 million in 2018 and showed a gradual increase during the forecast period.

Regional Insights

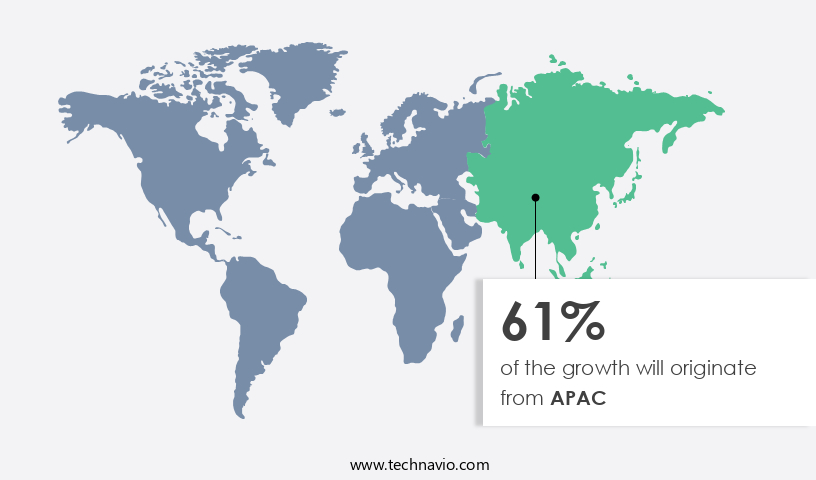
APAC is estimated to contribute 61% to the growth of the global market during the forecast period. Technavio's analysts have elaborately explained the regional trends and drivers that shape the market during the forecast period.

Oolong Tea Market Share by Geography

For more insights on the market share of various regions Request Free Sample

In the Asia-Pacific (APAC) region, the market for oolong tea is experiencing substantial growth due to the increasing consumer preference for health and wellness. The putative health benefits of oolong tea, including its natural antioxidants and components, are driving its demand. Oolong tea consumption is on the rise, particularly in countries such as China, India, Japan, and South Korea. For instance, China's market has been expanding rapidly as consumers favor traditional organic teas like oolong, white, and green tea in their organic forms. India's Darjeeling and Assam regions are renowned for producing exceptional oolong tea. As the demand for oolong tea in the APAC area increases, the market growth is anticipated to continue during the forecast period.

In addition, e-commerce platforms and online distribution channels are increasingly popular for purchasing oolong tea. Online marketplaces offer a wide range of oolong tea products, including tea bags, powder, and organic herbal tea blends with flavors such as blueberry, chocolate, banana, and digestive power seeds. In addition, oolong tea is widely used in the foodservice industry, with restaurants and hotels incorporating it into their menus for its unique taste and health benefits. Both store-based and non-store-based retailers are capitalizing on this trend, offering oolong tea in various forms to cater to the growing consumer base. Overall, the market for oolong tea in the APAC region is poised for significant growth due to its health advantages and increasing popularity.

Our researchers analyzed the data with 2023 as the base year, along with the key drivers, trends, and challenges. A holistic analysis of drivers will help companies refine their marketing strategies to gain a competitive advantage.

Oolong Tea Market Driver

Increasing awareness regarding the health benefits of oolong tea is the key driver of the market. Oolong tea, a premium and specialty beverage derived from the Camellia Sinensis plant, has gained significant popularity worldwide due to its numerous health benefits. This refreshing and invigorating beverage is renowned for its potential role in weight control and digestion enhancement. The unique fermentation process of oolong tea produces a distinct blend of antioxidants, making it a popular choice for consumers seeking functional beverages that promote overall health and wellness. The market has experienced remarkable growth as consumers increasingly prioritize health-conscious choices. Traditional oolong teas, such as Tie Guan Yin, Da Hong Pao, and Dong Ding, continue to be highly sought after, while flavored oolong teas infused with fruits, flowers, herbs, and spices have also gained popularity.

Furthermore, the market for oolong tea is influenced by various factors, including cultural traditions, digital marketing campaigns, and celebrity endorsements. However, price volatility, retail pricing, and sustainability concerns, such as environmental and social sustainability, deforestation, water usage, food safety, and labeling specifications, also play a significant role. Seasonal variability and weather conditions impact the production and availability of oolong tea, while the form of the tea, such as loose leaf or tea bags, and distribution channels, including offline distribution through specialty tea shops, convenience stores, and tea houses, further influence market trends. The caffeine level and form of oolong tea cater to diverse consumer preferences, making it a versatile and dynamic market.

Oolong Tea Market Trends

The rising popularity of artisanal and specialty teas is the upcoming trend in the market. The market has experienced significant growth due to the rising preference for premium and specialty teas. Consumers are increasingly seeking out weight control and digestion enhancement benefits, making oolong tea an attractive choice. Antioxidant-rich oolong tea is gaining popularity as a refreshing and invigorating beverage, setting it apart from coffee and herbal teas. Cultural influence and digital marketing campaigns, as well as celebrity endorsements, have contributed to the market's expansion. Price volatility and retail pricing remain key challenges for producers, but environmental and social sustainability are becoming increasingly important considerations. Issues such as deforestation, water usage, food safety, and labeling specifications are driving demand for sustainable practices.

In addition, seasonal variability and weather conditions also impact production, while the caffeine level and form, including traditional oolong tea varieties like Tie Guan Yin, Da Hong Pao, and Dong Ding, as well as flavored oolong teas with fruits, flowers, herbs, and spices, cater to diverse consumer preferences. The market encompasses loose leaf and tea bags, with offline distribution through specialty tea shops, convenience stores, and tea houses, in addition to online sales. Functional beverages and oolong tea blends continue to gain traction, offering a wealth of opportunities for producers and consumers alike.

Oolong Tea Market Challenge

The impact of overconsumption of tea is a key challenge affecting the market growth. Oolong tea, a premium and specialty beverage, is renowned for its numerous health benefits, including weight control, digestion enhancement, and the presence of antioxidants. This refreshing and invigorating beverage, with its rich cultural influence, has gained popularity in the functional beverage market, competing with coffee and herbal teas. Digital marketing campaigns and celebrity endorsements have contributed to its increasing demand. However, the market is subject to price volatility due to factors such as retail pricing, environmental sustainability, and social sustainability. These considerations include deforestation, water usage, food safety, and labeling specifications. Seasonal variability and weather conditions also impact the production and availability of oolong tea.

In addition, traditional varieties like Tie Guan Yin, Da Hong Pao, and Dong Ding, as well as flavored oolong teas with fruits, flowers, herbs, and spices, are available in various forms, including loose leaf and tea bags. Distribution channels include offline distribution through specialty tea shops, convenience stores, and tea houses. Despite its benefits, it is essential to maintain moderate consumption due to the caffeine level, which can lead to health issues with excessive intake.

Exclusive Customer Landscape

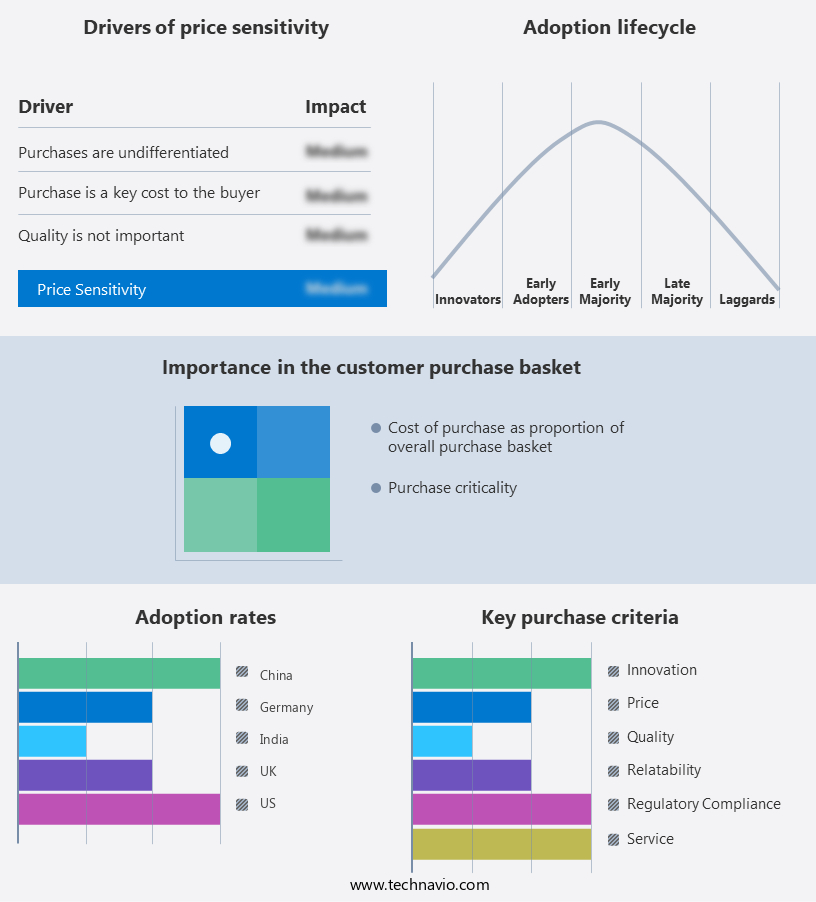
The market forecasting report includes the adoption lifecycle of the market, covering from the innovator's stage to the laggard's stage. It focuses on adoption rates in different regions based on penetration. Furthermore, the report also includes key purchase criteria and drivers of price sensitivity to help companies evaluate and develop their market growth analysis strategies.

Oolong Tea Market Share by Geography

 Customer Landscape

Key Companies & Market Insights

Companies are implementing various strategies, such as strategic alliances, partnerships, mergers and acquisitions, geographical expansion, and product/service launches, to enhance their presence in the market.

Arbor Teas: The company offers oolong tea such as organic Ti Kuan Yin, WuYi and organic plum oolong.

The market research and growth report includes detailed analyses of the competitive landscape of the market and information about key companies, including:

  • adagio teas
  • Chado Tea
  • COFCO International
  • Dilmah Ceylon Tea Co. Plc
  • East West Tea Company LLC
  • generation tea
  • Harada Tea Processing Co Ltd.
  • Harney and Sons Fine Teas
  • International Coffee and Tea LLC
  • Mighty Leaf Tea Canada
  • R. Twining and Co. Ltd.
  • Ren Lifestyle Solutions Pvt.Ltd
  • Rishi Tea and Botanicals
  • Starbucks Corp.
  • Tata Consumer Products Ltd.
  • Te Co.
  • The Republic of Tea Inc.
  • Unilever PLC
  • ITO EN Ltd.

Qualitative and quantitative analysis of companies has been conducted to help clients understand the wider business environment as well as the strengths and weaknesses of key market players. Data is qualitatively analyzed to categorize companies as pure play, category-focused, industry-focused, and diversified; it is quantitatively analyzed to categorize companies as dominant, leading, strong, tentative, and weak.

Research Analyst Overview

Oolong tea, a partially fermented tea originating from Taiwan and China, holds a significant market position in the global beverage industry due to its numerous health benefits. The demand for oolong tea is driven by its ability to aid in weight control and enhance digestion, making it a popular choice among consumers seeking functional beverages. Premium and specialty oolong teas, including Tie Guan Yin, Da Hong Pao, and Dong Ding, are in high demand due to their unique flavors and cultural influence. Oolong tea is also known for its antioxidant properties, making it a refreshing and invigorating beverage that caters to the growing trend of functional beverages.

Moreover, digital marketing campaigns, celebrity endorsements, and cultural influence have contributed to the growth of the market. However, price volatility, retail pricing, and seasonal variability pose challenges to market growth. Environmental and social sustainability, food safety, and labeling specifications are also crucial factors influencing consumer preferences. Oolong tea is available in various forms, including loose leaf and tea bags, and is distributed through offline channels such as specialty tea shops, convenience stores, and tea houses. Coffee and herbal teas are major competitors, but oolong tea's unique taste and health benefits set it apart. The market also offers flavored oolong teas with fruits, flowers, herbs, and spices to cater to diverse consumer preferences.

Further, weather conditions and caffeine level are essential factors influencing the production and quality of oolong tea. Price volatility and retail pricing are significant challenges, but environmental and social sustainability initiatives, along with labeling specifications, can help mitigate these issues. The market is expected to continue growing due to increasing consumer awareness of the health benefits of oolong tea and the growing trend of functional beverages.

Market Scope

Report Coverage

Details

Page number

150

Base year

2023

Historic period

2018 - 2022

Forecast period

2024-2028

Growth momentum & CAGR

Accelerate at a CAGR of 5.62%

Market growth 2024-2028

USD 159.3 million

Market structure

Fragmented

YoY growth 2023-2024(%)

5.05

Regional analysis

APAC, Europe, North America, South America, and Middle East and Africa

Performing market contribution

APAC at 61%

Key countries

US, China, India, Germany, and UK

Competitive landscape

Leading Companies, Market Positioning of Companies, Competitive Strategies, and Industry Risks

Key companies profiled

adagio teas, Arbor Teas, Chado Tea, COFCO International, Dilmah Ceylon Tea Co. Plc, East West Tea Company LLC, generation tea, Harada Tea Processing Co Ltd., Harney and Sons Fine Teas, International Coffee and Tea LLC, Mighty Leaf Tea Canada, R. Twining and Co. Ltd., Ren Lifestyle Solutions Pvt.Ltd, Rishi Tea and Botanicals, Starbucks Corp., Tata Consumer Products Ltd., Te Co., The Republic of Tea Inc., Unilever PLC, and ITO EN Ltd.

Market dynamics

Parent market analysis, market growth inducers and obstacles, market forecast, fast-growing and slow-growing segment analysis, COVID-19 impact and recovery analysis and future consumer dynamics, market condition analysis for the forecast period

Customization purview

If our market report has not included the data that you are looking for, you can reach out to our analysts and get segments customized.

Request Free Sample

What are the Key Data Covered in this Market Research and Growth Report?

  • CAGR of the market during the forecast period
  • Detailed information on factors that will drive the market growth and forecasting between 2024 and 2028
  • Precise estimation of the size of the market  and its contribution of the market in focus to the parent market
  • Accurate predictions about upcoming market growth and trends and changes in consumer behaviour
  • Growth of the market across APAC, Europe, North America, South America, and Middle East and Africa
  • Thorough analysis of the market's competitive landscape and detailed information about companies
  • Comprehensive analysis of factors that will challenge the growth of market companies

We can help! Our analysts can customize this market research report to meet your requirements. Get in touch

1 Executive Summary

  • 1.1 Market overview
    • Exhibit 01: Executive Summary – Chart on Market Overview
    • Exhibit 02: Executive Summary – Data Table on Market Overview
    • Exhibit 03: Executive Summary – Chart on Global Market Characteristics
    • Exhibit 04: Executive Summary – Chart on Market by Geography
    • Exhibit 05: Executive Summary – Chart on Market Segmentation by Type
    • Exhibit 06: Executive Summary – Chart on Market Segmentation by Distribution Channel
    • Exhibit 07: Executive Summary – Chart on Incremental Growth
    • Exhibit 08: Executive Summary – Data Table on Incremental Growth
    • Exhibit 09: Executive Summary – Chart on Vendor Market Positioning

2 Market Landscape

  • 2.1 Market ecosystem
    • Exhibit 10: Parent market
    • Exhibit 11: Market Characteristics

3 Market Sizing

  • 3.1 Market definition
    • Exhibit 12: Offerings of vendors included in the market definition
  • 3.2 Market segment analysis
    • Exhibit 13: Market segments
  • 3.3 Market size 2023
    • 3.4 Market outlook: Forecast for 2023-2028
      • Exhibit 14: Chart on Global - Market size and forecast 2023-2028 ($ million)
      • Exhibit 15: Data Table on Global - Market size and forecast 2023-2028 ($ million)
      • Exhibit 16: Chart on Global Market: Year-over-year growth 2023-2028 (%)
      • Exhibit 17: Data Table on Global Market: Year-over-year growth 2023-2028 (%)

    4 Historic Market Size

    • 4.1 Global oolong tea market 2018 - 2022
      • Exhibit 18: Historic Market Size – Data Table on global oolong tea market 2018 - 2022 ($ million)
    • 4.2 Type Segment Analysis 2018 - 2022
      • Exhibit 19: Historic Market Size – Type Segment 2018 - 2022 ($ million)
    • 4.3 Distribution Channel Segment Analysis 2018 - 2022
      • Exhibit 20: Historic Market Size – Distribution Channel Segment 2018 - 2022 ($ million)
    • 4.4 Geography Segment Analysis 2018 - 2022
      • Exhibit 21: Historic Market Size – Geography Segment 2018 - 2022 ($ million)
    • 4.5 Country Segment Analysis 2018 - 2022
      • Exhibit 22: Historic Market Size – Country Segment 2018 - 2022 ($ million)

    5 Five Forces Analysis

    • 5.1 Five forces summary
      • Exhibit 23: Five forces analysis - Comparison between 2023 and 2028
    • 5.2 Bargaining power of buyers
      • Exhibit 24: Chart on Bargaining power of buyers – Impact of key factors 2023 and 2028
    • 5.3 Bargaining power of suppliers
      • Exhibit 25: Bargaining power of suppliers – Impact of key factors in 2023 and 2028
    • 5.4 Threat of new entrants
      • Exhibit 26: Threat of new entrants – Impact of key factors in 2023 and 2028
    • 5.5 Threat of substitutes
      • Exhibit 27: Threat of substitutes – Impact of key factors in 2023 and 2028
    • 5.6 Threat of rivalry
      • Exhibit 28: Threat of rivalry – Impact of key factors in 2023 and 2028
    • 5.7 Market condition
      • Exhibit 29: Chart on Market condition - Five forces 2023 and 2028

    6 Market Segmentation by Type

    • 6.1 Market segments
      • Exhibit 30: Chart on Type - Market share 2023-2028 (%)
      • Exhibit 31: Data Table on Type - Market share 2023-2028 (%)
    • 6.2 Comparison by Type
      • Exhibit 32: Chart on Comparison by Type
      • Exhibit 33: Data Table on Comparison by Type
    • 6.3 Leaf and powder - Market size and forecast 2023-2028
      • Exhibit 34: Chart on Leaf and powder - Market size and forecast 2023-2028 ($ million)
      • Exhibit 35: Data Table on Leaf and powder - Market size and forecast 2023-2028 ($ million)
      • Exhibit 36: Chart on Leaf and powder - Year-over-year growth 2023-2028 (%)
      • Exhibit 37: Data Table on Leaf and powder - Year-over-year growth 2023-2028 (%)
    • 6.4 Tea bag - Market size and forecast 2023-2028
      • Exhibit 38: Chart on Tea bag - Market size and forecast 2023-2028 ($ million)
      • Exhibit 39: Data Table on Tea bag - Market size and forecast 2023-2028 ($ million)
      • Exhibit 40: Chart on Tea bag - Year-over-year growth 2023-2028 (%)
      • Exhibit 41: Data Table on Tea bag - Year-over-year growth 2023-2028 (%)
    • 6.5 Liquid - Market size and forecast 2023-2028
      • Exhibit 42: Chart on Liquid - Market size and forecast 2023-2028 ($ million)
      • Exhibit 43: Data Table on Liquid - Market size and forecast 2023-2028 ($ million)
      • Exhibit 44: Chart on Liquid - Year-over-year growth 2023-2028 (%)
      • Exhibit 45: Data Table on Liquid - Year-over-year growth 2023-2028 (%)
    • 6.6 Market opportunity by Type
      • Exhibit 46: Market opportunity by Type ($ million)
      • Exhibit 47: Data Table on Market opportunity by Type ($ million)

    7 Market Segmentation by Distribution Channel

    • 7.1 Market segments
      • Exhibit 48: Chart on Distribution Channel - Market share 2023-2028 (%)
      • Exhibit 49: Data Table on Distribution Channel - Market share 2023-2028 (%)
    • 7.2 Comparison by Distribution Channel
      • Exhibit 50: Chart on Comparison by Distribution Channel
      • Exhibit 51: Data Table on Comparison by Distribution Channel
    • 7.3 Offline - Market size and forecast 2023-2028
      • Exhibit 52: Chart on Offline - Market size and forecast 2023-2028 ($ million)
      • Exhibit 53: Data Table on Offline - Market size and forecast 2023-2028 ($ million)
      • Exhibit 54: Chart on Offline - Year-over-year growth 2023-2028 (%)
      • Exhibit 55: Data Table on Offline - Year-over-year growth 2023-2028 (%)
    • 7.4 Online - Market size and forecast 2023-2028
      • Exhibit 56: Chart on Online - Market size and forecast 2023-2028 ($ million)
      • Exhibit 57: Data Table on Online - Market size and forecast 2023-2028 ($ million)
      • Exhibit 58: Chart on Online - Year-over-year growth 2023-2028 (%)
      • Exhibit 59: Data Table on Online - Year-over-year growth 2023-2028 (%)
    • 7.5 Market opportunity by Distribution Channel
      • Exhibit 60: Market opportunity by Distribution Channel ($ million)
      • Exhibit 61: Data Table on Market opportunity by Distribution Channel ($ million)

    8 Customer Landscape

    • 8.1 Customer landscape overview
      • Exhibit 62: Analysis of price sensitivity, lifecycle, customer purchase basket, adoption rates, and purchase criteria

    9 Geographic Landscape

    • 9.1 Geographic segmentation
      • Exhibit 63: Chart on Market share by geography 2023-2028 (%)
      • Exhibit 64: Data Table on Market share by geography 2023-2028 (%)
    • 9.2 Geographic comparison
      • Exhibit 65: Chart on Geographic comparison
      • Exhibit 66: Data Table on Geographic comparison
    • 9.3 APAC - Market size and forecast 2023-2028
      • Exhibit 67: Chart on APAC - Market size and forecast 2023-2028 ($ million)
      • Exhibit 68: Data Table on APAC - Market size and forecast 2023-2028 ($ million)
      • Exhibit 69: Chart on APAC - Year-over-year growth 2023-2028 (%)
      • Exhibit 70: Data Table on APAC - Year-over-year growth 2023-2028 (%)
    • 9.4 Europe - Market size and forecast 2023-2028
      • Exhibit 71: Chart on Europe - Market size and forecast 2023-2028 ($ million)
      • Exhibit 72: Data Table on Europe - Market size and forecast 2023-2028 ($ million)
      • Exhibit 73: Chart on Europe - Year-over-year growth 2023-2028 (%)
      • Exhibit 74: Data Table on Europe - Year-over-year growth 2023-2028 (%)
    • 9.5 North America - Market size and forecast 2023-2028
      • Exhibit 75: Chart on North America - Market size and forecast 2023-2028 ($ million)
      • Exhibit 76: Data Table on North America - Market size and forecast 2023-2028 ($ million)
      • Exhibit 77: Chart on North America - Year-over-year growth 2023-2028 (%)
      • Exhibit 78: Data Table on North America - Year-over-year growth 2023-2028 (%)
    • 9.6 South America - Market size and forecast 2023-2028
      • Exhibit 79: Chart on South America - Market size and forecast 2023-2028 ($ million)
      • Exhibit 80: Data Table on South America - Market size and forecast 2023-2028 ($ million)
      • Exhibit 81: Chart on South America - Year-over-year growth 2023-2028 (%)
      • Exhibit 82: Data Table on South America - Year-over-year growth 2023-2028 (%)
    • 9.7 Middle East and Africa - Market size and forecast 2023-2028
      • Exhibit 83: Chart on Middle East and Africa - Market size and forecast 2023-2028 ($ million)
      • Exhibit 84: Data Table on Middle East and Africa - Market size and forecast 2023-2028 ($ million)
      • Exhibit 85: Chart on Middle East and Africa - Year-over-year growth 2023-2028 (%)
      • Exhibit 86: Data Table on Middle East and Africa - Year-over-year growth 2023-2028 (%)
    • 9.8 China - Market size and forecast 2023-2028
      • Exhibit 87: Chart on China - Market size and forecast 2023-2028 ($ million)
      • Exhibit 88: Data Table on China - Market size and forecast 2023-2028 ($ million)
      • Exhibit 89: Chart on China - Year-over-year growth 2023-2028 (%)
      • Exhibit 90: Data Table on China - Year-over-year growth 2023-2028 (%)
    • 9.9 India - Market size and forecast 2023-2028
      • Exhibit 91: Chart on India - Market size and forecast 2023-2028 ($ million)
      • Exhibit 92: Data Table on India - Market size and forecast 2023-2028 ($ million)
      • Exhibit 93: Chart on India - Year-over-year growth 2023-2028 (%)
      • Exhibit 94: Data Table on India - Year-over-year growth 2023-2028 (%)
    • 9.10 Germany - Market size and forecast 2023-2028
      • Exhibit 95: Chart on Germany - Market size and forecast 2023-2028 ($ million)
      • Exhibit 96: Data Table on Germany - Market size and forecast 2023-2028 ($ million)
      • Exhibit 97: Chart on Germany - Year-over-year growth 2023-2028 (%)
      • Exhibit 98: Data Table on Germany - Year-over-year growth 2023-2028 (%)
    • 9.11 UK - Market size and forecast 2023-2028
      • Exhibit 99: Chart on UK - Market size and forecast 2023-2028 ($ million)
      • Exhibit 100: Data Table on UK - Market size and forecast 2023-2028 ($ million)
      • Exhibit 101: Chart on UK - Year-over-year growth 2023-2028 (%)
      • Exhibit 102: Data Table on UK - Year-over-year growth 2023-2028 (%)
    • 9.12 US - Market size and forecast 2023-2028
      • Exhibit 103: Chart on US - Market size and forecast 2023-2028 ($ million)
      • Exhibit 104: Data Table on US - Market size and forecast 2023-2028 ($ million)
      • Exhibit 105: Chart on US - Year-over-year growth 2023-2028 (%)
      • Exhibit 106: Data Table on US - Year-over-year growth 2023-2028 (%)
    • 9.13 Market opportunity by geography
      • Exhibit 107: Market opportunity by geography ($ million)
      • Exhibit 108: Data Tables on Market opportunity by geography ($ million)

    10 Drivers, Challenges, and Trends

    • 10.1 Market drivers
      • 10.2 Market challenges
        • 10.3 Impact of drivers and challenges
          • Exhibit 109: Impact of drivers and challenges in 2023 and 2028
        • 10.4 Market trends

          11 Vendor Landscape

          • 11.1 Overview
            • 11.2 Vendor landscape
              • Exhibit 110: Overview on Criticality of inputs and Factors of differentiation
            • 11.3 Landscape disruption
              • Exhibit 111: Overview on factors of disruption
            • 11.4 Industry risks
              • Exhibit 112: Impact of key risks on business

            12 Vendor Analysis

            • 12.1 Vendors covered
              • Exhibit 113: Vendors covered
            • 12.2 Market positioning of vendors
              • Exhibit 114: Matrix on vendor position and classification
            • 12.3 Arbor Teas
              • Exhibit 115: Arbor Teas - Overview
              • Exhibit 116: Arbor Teas - Product / Service
              • Exhibit 117: Arbor Teas - Key offerings
            • 12.4 Chado Tea
              • Exhibit 118: Chado Tea - Overview
              • Exhibit 119: Chado Tea - Product / Service
              • Exhibit 120: Chado Tea - Key offerings
            • 12.5 COFCO International
              • Exhibit 121: COFCO International - Overview
              • Exhibit 122: COFCO International - Product / Service
              • Exhibit 123: COFCO International - Key offerings
            • 12.6 Dilmah Ceylon Tea Co. Plc
              • Exhibit 124: Dilmah Ceylon Tea Co. Plc - Overview
              • Exhibit 125: Dilmah Ceylon Tea Co. Plc - Product / Service
              • Exhibit 126: Dilmah Ceylon Tea Co. Plc - Key offerings
            • 12.7 East West Tea Company LLC
              • Exhibit 127: East West Tea Company LLC - Overview
              • Exhibit 128: East West Tea Company LLC - Product / Service
              • Exhibit 129: East West Tea Company LLC - Key offerings
            • 12.8 Harney and Sons Fine Teas
              • Exhibit 130: Harney and Sons Fine Teas - Overview
              • Exhibit 131: Harney and Sons Fine Teas - Product / Service
              • Exhibit 132: Harney and Sons Fine Teas - Key offerings
            • 12.9 International Coffee and Tea LLC
              • Exhibit 133: International Coffee and Tea LLC - Overview
              • Exhibit 134: International Coffee and Tea LLC - Product / Service
              • Exhibit 135: International Coffee and Tea LLC - Key offerings
            • 12.10 ITO EN Ltd.
              • Exhibit 136: ITO EN Ltd. - Overview
              • Exhibit 137: ITO EN Ltd. - Business segments
              • Exhibit 138: ITO EN Ltd. - Key offerings
              • Exhibit 139: ITO EN Ltd. - Segment focus
            • 12.11 Mighty Leaf Tea Canada
              • Exhibit 140: Mighty Leaf Tea Canada - Overview
              • Exhibit 141: Mighty Leaf Tea Canada - Product / Service
              • Exhibit 142: Mighty Leaf Tea Canada - Key offerings
            • 12.12 R. Twining and Co. Ltd.
              • Exhibit 143: R. Twining and Co. Ltd. - Overview
              • Exhibit 144: R. Twining and Co. Ltd. - Product / Service
              • Exhibit 145: R. Twining and Co. Ltd. - Key offerings
            • 12.13 Rishi Tea and Botanicals
              • Exhibit 146: Rishi Tea and Botanicals - Overview
              • Exhibit 147: Rishi Tea and Botanicals - Product / Service
              • Exhibit 148: Rishi Tea and Botanicals - Key offerings
            • 12.14 Starbucks Corp.
              • Exhibit 149: Starbucks Corp. - Overview
              • Exhibit 150: Starbucks Corp. - Business segments
              • Exhibit 151: Starbucks Corp. - Key news
              • Exhibit 152: Starbucks Corp. - Key offerings
              • Exhibit 153: Starbucks Corp. - Segment focus
            • 12.15 Tata Consumer Products Ltd.
              • Exhibit 154: Tata Consumer Products Ltd. - Overview
              • Exhibit 155: Tata Consumer Products Ltd. - Business segments
              • Exhibit 156: Tata Consumer Products Ltd. - Key news
              • Exhibit 157: Tata Consumer Products Ltd. - Key offerings
              • Exhibit 158: Tata Consumer Products Ltd. - Segment focus
            • 12.16 The Republic of Tea Inc.
              • Exhibit 159: The Republic of Tea Inc. - Overview
              • Exhibit 160: The Republic of Tea Inc. - Product / Service
              • Exhibit 161: The Republic of Tea Inc. - Key offerings
            • 12.17 Unilever PLC
              • Exhibit 162: Unilever PLC - Overview
              • Exhibit 163: Unilever PLC - Business segments
              • Exhibit 164: Unilever PLC - Key news
              • Exhibit 165: Unilever PLC - Key offerings
              • Exhibit 166: Unilever PLC - Segment focus

            13 Appendix

            • 13.1 Scope of the report
              • 13.2 Inclusions and exclusions checklist
                • Exhibit 167: Inclusions checklist
                • Exhibit 168: Exclusions checklist
              • 13.3 Currency conversion rates for US$
                • Exhibit 169: Currency conversion rates for US$
              • 13.4 Research methodology
                • Exhibit 170: Research methodology
                • Exhibit 171: Validation techniques employed for market sizing
                • Exhibit 172: Information sources
              • 13.5 List of abbreviations
                • Exhibit 173: List of abbreviations

              Research Methodology

              Technavio presents a detailed picture of the market by way of study, synthesis, and summation of data from multiple sources. The analysts have presented the various facets of the market with a particular focus on identifying the key industry influencers. The data thus presented is comprehensive, reliable, and the result of extensive research, both primary and secondary.

              INFORMATION SOURCES

              Primary sources

              • Manufacturers and suppliers
              • Channel partners
              • Industry experts
              • Strategic decision makers

              Secondary sources

              • Industry journals and periodicals
              • Government data
              • Financial reports of key industry players
              • Historical data
              • Press releases

              DATA ANALYSIS

              Data Synthesis

              • Collation of data
              • Estimation of key figures
              • Analysis of derived insights

              Data Validation

              • Triangulation with data models
              • Reference against proprietary databases
              • Corroboration with industry experts

              REPORT WRITING

              Qualitative

              • Market drivers
              • Market challenges
              • Market trends
              • Five forces analysis

              Quantitative

              • Market size and forecast
              • Market segmentation
              • Geographical insights
              • Competitive landscape

              Interested in this report?

              Get your sample now to see our research methodology and insights!

              Download Now

              Frequently Asked Questions

              Oolong Tea market growth will increase by $ 159.3 mn during 2024-2028 .

              The Oolong Tea market is expected to grow at a CAGR of 5.62% during 2024-2028 .

              Oolong Tea market is segmented by Type( Leaf and powder, Tea bag, Liquid) Distribution Channel( Offline, Online)

              adagio teas, Arbor Teas, Chado Tea, COFCO International, Dilmah Ceylon Tea Co. Plc, East West Tea Company LLC, generation tea, Harada Tea Processing Co Ltd., Harney and Sons Fine Teas, International Coffee and Tea LLC, Mighty Leaf Tea Canada, R. Twining and Co. Ltd., Ren Lifestyle Solutions Pvt.Ltd, Rishi Tea and Botanicals, Starbucks Corp., Tata Consumer Products Ltd., Te Co., The Republic of Tea Inc., Unilever PLC, ITO EN Ltd. are a few of the key vendors in the Oolong Tea market.

              APAC will register the highest growth rate of 61% among the other regions. Therefore, the Oolong Tea market in APAC is expected to garner significant business opportunities for the vendors during the forecast period.

              US, China, India, Germany, UK

              • Increasing awareness regarding health benefits of oolong teaOolong is the driving factor this market.
              • a traditional Chinese variety of tea is the driving factor this market.
              • has become increasingly popular across the world due to its purported health advantages. As consumers globally strive to improve their health is the driving factor this market.
              • the oolong tea market has experienced a surge in demand due to the increasing need for health-enhancing products. Oolong tea is one of the most rapidly expanding types of tea in the world due to the growing recognition of its potential health benefits. This tea is made from a variety of compounds is the driving factor this market.
              • which are fermented to create a unique blend. It is sourced from the same cultivars of the Camellia Sinensis plant as other teas is the driving factor this market.
              • including black and green. Numerous scientific research studies have suggested that oolong Tea may possess health benefits is the driving factor this market.
              • such as weight management is the driving factor this market.
              • improved cardiovascular health is the driving factor this market.
              • and help in improving the immune system. Consumers across the world are increasingly concerned about their weight is the driving factor this market.
              • and the potential benefits of oolong tea in terms of weight loss have made it an attractive option for those who are looking to improve their health. According to research is the driving factor this market.
              • oolong tea has been found to increase metabolism and fat oxidation is the driving factor this market.
              • which may be beneficial in weight reduction when consumed in conjunction with a healthy diet and exercise regimen. All these above-mentioned factors will propel the growth of the global oolong tea market during the forecast period. is the driving factor this market.

              The Oolong Tea market vendors should focus on grabbing business opportunities from the Leaf and powder segment as it accounted for the largest market share in the base year.